in Management from NOVA – School of Business and Economics
Was Ageing a Cause for the Increase in Hospitalization Costs, in the
Portuguese Public Hospitals, between 1994 and 2010?
MANUEL BARBOSA VARANDAS FERNANDES 937
A Project carried out on the Health Economics course, under the supervision of: Professor Pedro Pita Barros
Manuel Varandas Fernandes & Masters in Management 1
Abstract
This work project is an analysis to the role of ageing in the rise of Portuguese hospitalization costs between 1994 and 2010. It was proved that ageing influenced cost increase but its significance depended on the analysis period. From 1994 to 2006, ageing was responsible for 18.55% of the total costs increase, meaning that, alone, it would have generated an increase of 11.09% (172M €). From 2007 to 2010, ageing per se would only have generated a 3% increase in the overall hospitalization costs which would have corresponded to 85M €.
Manuel Varandas Fernandes & Masters in Management 2
1. Introduction
In Portugal, while the debate is centered on financial issues, it is important not to neglect the demographic changes and their implications. The European Commission (EC) 2012 Ageing Report predicts dramatic changes in society’s age composition. It is estimated that the European Union with 27 countries (EU27) will have a below natural replacement fertility rate which will lead to an increase in the share of the age group of people over 64 years old (from 17% to 30% of the population). Consequently, the projections are that, in 2060, EU27 will only have a couple of working-age people per person above 64 years old, while in 2010 there were four working-age people per person over 64. In Portugal, while the share of people below 25 years old decreased from 34.3% in 1994 to 26% in 2010, the share of people above 49 years old increased from 31.2% to 37.4% of total population1.
Meanwhile, the total Portuguese healthcare expenditure has been increasing its weight over the total Gross Domestic Product (GDP). It actually went from 8.6% of GDP in 2000 to 10.2% in 2010. However, while the government healthcare spending increased from 4% to 5.7% of GDP between 2000 and 2010, there were some government budget cuts: in 2005 the total costs were 9541M € (6% of GDP) while the preliminary calculations showed that in 2011 costs were only 8549M € (5.4% of GDP)2. But despite some recent budget reductions, the healthcare expenditure has been following an upward trend.
The combination of both age pyramid changes, and the increasing healthcare costs that Portugal went through, were the trigger of this work project. Society and policy makers often invoke ageing as one of the main reasons of the increasing healthcare costs. While
1
Annex 1
Manuel Varandas Fernandes & Masters in Management 3
their arguments are based on the fact that elder ages have higher healthcare costs, they forget many other variables that could have relevant influence.
Rather than focusing in the country healthcare costs as a whole, this work focuses on the role that ageing had in the increase of the hospitalization healthcare cost between 1994 and 2010 in Portugal. Ageing was defined as the increase in hospitalization costs generated by the increase in the number of people above 64 years old.
This work project comprises a brief literature review, citing some important studies that were developed regarding healthcare costs and ageing; a methodology; the results and discussion; and a main conclusion that summarizes the most important and relevant information to answer the work project question.
It was proved that ageing had influence in the increase of total hospitalization costs. From 1994 to 2006, people over 64 years old were responsible for 64% of the total hospitalizations costs increase, and the enlargement of that population group was responsible for 28.99% of the 113.79% increase in total hospitalization costs within that age group. Moreover, the results showed that ageing alone would have increased the total simulated hospitalization costs by 11.09% from 1994 to 2006.
2. Literature Review
There are many studies regarding ageing and its influence on healthcare costs, and the majority of the scientific work proves that population ageing per se should not be considered a main driver of healthcare costs. However, according Longman (1987), the increasing share of the elder population should increase the demand for health care
Manuel Varandas Fernandes & Masters in Management 4
services. That argument was based on the fact that, on average, elder people require more health care than the younger ones, and it was contested by Getzen (1992).
Zweifel, Felder, Meiers, (1999) also evaluated the influence of ageing on healthcare costs. They studied datasets of healthcare expenditures (HCE) of deceased Swiss people, and developed a model to evaluate age’s role. One of the more relevant conclusions was that calendar age per se is not as significant as the remaining time to death. The results showed “that the terminal phase of life is costly independently of whether they occur at age 60 or 90”, and it was concluded that ageing and the increase of life expectancy does not affect healthcare expenditure. To the authors, the “increase in the elderly’s share of population seems to shift the bulk of HCE to higher age, leaving per capita HCE unchanged”. They reinforced that society should not cover the real causes of healthcare costs increase by blaming ageing. Furthermore, they think that governments and policy makers should stop using age as an argument and should start fighting real healthcare problems like “failures in insurance markets, technical progress in providing health care services and wrong incentives for patients, doctors and hospitals”.
On the other hand, their work was reviewed by Seshamani and Gray (2004) and the later demonstrated that there were some econometric issues on it. In fact, they used a longitudinal hospital dataset from Oxfordshire, England, and concluded that the terminal phase of life and calendar age, were both significant variables that affected quarterly hospital costs. With the use of hospital datasets, this paper revealed that the selection of a good analysis model is crucial to correctly identify healthcare expenditures determinants.
Manuel Varandas Fernandes & Masters in Management 5
case the approach was somehow different. They used population and clinical variables/parameters to verify the relation of ageing with hospital resources utilization. They measured complexity and severity in order to evaluate consumption and hospital costs, and observed that these are higher amongst emergency admitted patients and the deceased. Their work reinforced the idea that illness is appearing less and later, and, therefore, they concluded that for people over 64 years old, age per se is not a driver of hospital resources consumption. Moreover, the authors believe that the increase in number of people over 64 years old will generate a higher demand for social care than for health care, and as such “it is necessary to introduce changes in the functions and characteristics of the hospitals”. In order to maintain a balanced system and to face the future demographic challenges, the paper finishes with an alert to the urgency of those changes.
3. Methodology
In this work project the main goal is to assess whether or not ageing was a significant factor for the increasing hospitalization costs in Portugal between 1994 and 2010. The approach to the problem is centered on a direct analysis of what really happened in the Portuguese public hospitals in that period. This study compares the changes the population’s age pyramid suffered with the hospitalization costs of each age group. For that purpose, a range of ages from 0 to 101 years old was considered. Moreover, ageing was defined as the increase in total costs generated by an increase in number of people above 64 years old.
Manuel Varandas Fernandes & Masters in Management 6
3.1 – Data
The data used in this study was collected from the Database of the Diagnosis Related Groups (DRGs) in Portugal. The DRG is an international classification system that groups patients according to clinical and resources consumption similarities. This classification was implemented in Portugal in 1989 and it is only used for hospitalization episodes (some DRGs, as the ones for chemotherapy sessions, do not necessarily classify hospitalizations) [i].
The database contains every DRG episode registered in all country’s public hospitals, but despite each episode corresponding to only one DRG, over the years, changes occurred and some DRGs had their numbers altered [i]. To solve this issue and make it possible to compare episodes over time, a mapping of the changed DRGs was made. Those that changed were attributed an updated DRG, from Portaria 132 / 2009 – Anexo II [ii], according to similarities in their description and having in consideration other official information3. However, as this mapping was not done by a specialized authority, the possibility that a wrong updated DRG was attributed should be taken into account. While it would have been better to have an accurate mapping done by a technician, doing it manually does not compromise the work project’s aim because the share and value of those DRG episodes over the total DRGs is not too relevant4. Moreover, since some of the changed DRGs had only one updated match, the results are even less affected by a wrong mapping of the few DRGs that had more than one new option. In cases which the old DRG had more than one updated DRG, the one with higher prices was always chosen.
3
Annex 2
Manuel Varandas Fernandes & Masters in Management 7
Another obstacle in this database had to do with childbirths’ DRGs. This cluster suffered huge modifications and, therefore, attributing a new DRG to an old one would have been almost impossible without the help of a codification expert. Thus, it was decided to simply eliminate the old DRGs for childbirth (years: 1994-2004), as well as the correspondent new DRGs (years: 2005-2010)5. While dropping these DRG’s observations does not affect the other ages’ analysis, the relative share of each age over total costs became unrealistic. Nevertheless, a comparison of relative shares over the years is still possible and accurate, and that is what matters the most.
It is also important to mention that all the observations with errors (such as unrealistic birth dates, no gender or no year) and the DRGs 469 (invalid diagnosis) and 470 (without a group) were dropped from this analysis because it would have been impossible to have a valorization for those error cases.
3.2 – Valorization
The DRGs have a relative weight coefficient that reflects the expected value of treating a patient with that respective diagnosis. Each relative weight is expressed in relative terms to the average cost of giving treatment to a typical Portuguese patient, and therefore, a higher relative weight means higher costs and higher treatment complexity [i]. To evaluate the cost of treating one episode it is mandatory to follow the valorization rules and the prices established by the government. Each DRG has a price that could be interpreted as the cost of giving all the needed treatment to a typical average patient of that DRG [i]. However, while this work followed the majority of rules, few of them were not covered
Manuel Varandas Fernandes & Masters in Management 8
because of unreliable data and time management issues6. Although the total costs calculated in this work may differ from the real ones, the results obtained are still trustworthy as the relative comparison among costs over the years is the critical part of this analysis. As such, the followed rules were sufficient to achieve some important, valuable and precise conclusions.
To calculate the total hospitalization costs a quantity index was used. For this work project, the prices of each DRG were fixed in Portaria 132 / 2009 – Anexo II [ii].
Laspeyres purposed to fix prices in one chosen base year and then valorize quantities of each year according with the prices of the year chosen as base. This method allows a comparison of costs among the years without having to consider changes in other variables (such as inflation). Moreover, by valorizing each DRG episode with prices from a base year, and by changing the old DRGs to the correspondent new ones (as described in section 3.1), it became clear that the medical technology to each DRG is also fixed and it does not influence the outcome of the analysis. Another variable that could have an impact on the results is the change of number of beds available for hospitalization episodes. Even though this variable is not controlled in the study, it may not be considered a major issue as the number of beds only decreased 7.3%7. Furthermore, since the number of episodes increased in this same period, the supply decrease did not have a significant impact on the market. In contrast, there are population/demographic variables, such as morbidity or life expectancy, that are not controlled neither fixed over time. Those are the kind of variables that determine the quantities of some specific DRGs, and therefore it is crucial to let those
6
Annex 5
Manuel Varandas Fernandes & Masters in Management 9
factors change over time. For instance, if life expectancy or morbidity increased, the total amount of certain types of DRGs would also increase, and this is an effect that should not be removed.
After valorizing each DRG, a Total Simulated Cost was obtained. This term was used because, as it was mentioned above, it was not possible to calculate the real hospitalization costs. However, this approximation provides a good tool for the study of the ageing issue that is discussed in this work project.
3.3 – The Analysis
This work project query was approached in three different but complementary phases. The years from 2007 to 2010 were compared separately from 1994 to 2006 due to data impediments. Even though the number of episodes almost doubled from 2006 to 2007, the Portuguese people did not necessarily start to go more often to hospitals. This huge increase was due to new procedures regarding the episodes’ registering8. As an alternative, it would have been possible to simply eliminate the DRGs that generated the explosion in the number of episodes. However, those are DRGs that could be influenced by age, and therefore their hypothetical elimination could also abolish part of the ageing effect.
3.3.1 – General Analysis
In the first part of this study, a summary of what happened regarding the costs per year and per age group is analyzed. The aim is to show the evolution of costs and, at the same time, compare it with the changes in society’s age pyramid.
Manuel Varandas Fernandes & Masters in Management 10 Source: Own source
TC(i) Total simulated hospitalization costs of year i; EP(i) Number of episodes (observations) in year i; POP(i) Resident population in Portugal in year i;
3.3.2 – Graphical Analysis
In the second part, the average costs of treatment are computed for each age: from 0 to 101 years old. These results are displayed in a chart and each year has one and only one respective curve. Since it is essential to understand which ages had a bigger average cost increase, this graphical visualization is very helpful as it gives a good insight of the distributional differences per age.
3.3.3 – Total Simulated Hospitalization Costs Decomposition
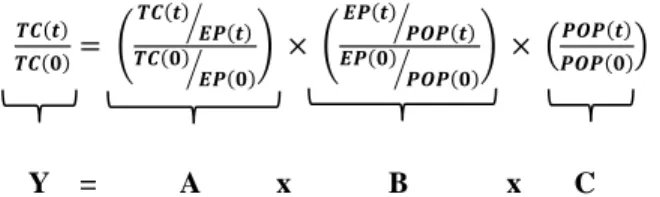
In this last section, an equation was developed to decompose the variation in the total simulated hospitalization costs.
( ) ( ) ( ( ) ( ) ⁄ ( ) ( ) ⁄ ) ( ( ) ( ) ⁄ ( ) ( ) ⁄ ) ( ( ) ( )) ( )
The first term could be interpreted as the variation rate of the total simulated hospitalization costs (between year
t
and 0). Subsequently, that effect is decomposed into the variation rate of the average costs per episode (since prices were fixed, it measures the DRG composition/complexity mix; i.e. higher simulated average costs per episode means higher complexity), the variation rate of the number of episodes per person (which measures how regularly people use hospitalization services: number of episodes per head of population), and the variation rate of the resident population in Portugal (which captures theManuel Varandas Fernandes & Masters in Management 11
changes in the number of people in each age group or in the all society)9. The equation was applied to each age group in order to understand if ageing played an important role in the total simulated costs variations.
To interpret the three indexes above as explanatory variables for the total costs variations, some changes were required on equation (1)10.
( ( ) ( )) ( ( ) ( ) ⁄ ( ) ( ) ⁄ ) ( ( ) ( ) ⁄ ( ) ( ) ⁄ ) ( ( ) ( )) ( )
A multiplication was replaced by a sum and it became possible to study the influence each term alone had over the total simulated costs variation (by dividing each of the logarithmic terms by the logarithm of the TC(t) / TC(0)). These calculations revealed the weight each term had on the variations in the total simulated hospitalization costs. Moreover, to achieve the real decomposition of the changes in the total cost, those weights were multiplied by the total cost variation itself. Thus, what was studied was what would have happened to the total simulated costs if only one of the three terms had changed over time (the two other terms would have remained stable, i.e. equal to 1 and Ln(1) = 0).
4. Results and Discussion
4.1 – General Analysis
To begin the analysis, it is important to examine what really happened to the simulated hospitalization costs between 1994 and 2010.
9
Those variations rates are obtained by subtracting 1 to each of the four terms
Manuel Varandas Fernandes & Masters in Management 12
Table 1 - Simulated hospitalization costs and number of episodes per year
Source: Own source; Data from the DRG database
The table above clearly reflects the previously mentioned incompatibility of analysis between the years of 1994 through 2006 and the ones from 2007 to 2010. Form 2006 to 2007, due to different administrative procedures, the number of episodes changed abruptly, and, therefore, a separate comparison was required.
From 1994 to 2006, there are two relevant aspects that should be taken into account. Firstly, the total simulated costs increased from year to year, without exception. Secondly, regardless of the increasing number of episodes, the average cost of one hospitalization episode also registered an increase. Since prices were fixed in this analysis, and the only parameter allowed to vary were quantities, there is evidence that hospitalization healthcare services got more expensive. In 1994, it would cost 2075€ to treat an average patient, while in 2006 that cost rose to 2484€. Although the reason for these occurrences may be related with an increase in the number of more complex DRGs, it is not possible to find what really happened by simply studying this table.
On the other hand, it is remarkable that between 2007 and 2009 the effect was the
Year Total Cost Avg Cost per Episode Nr. Episodes Variation to the base year 1994 (% ) 1994 1.553.456.785 € 2.075 € 748.591 0% 1995 1.575.801.166 € 2.115 € 745.068 1% 1996 1.654.362.937 € 2.135 € 774.798 6% 1997 1.658.093.500 € 2.152 € 770.422 7% 1998 1.756.238.272 € 2.187 € 803.214 13% 1999 1.827.776.401 € 2.206 € 828.391 18% 2000 1.923.142.802 € 2.251 € 854.506 24% 2001 2.011.967.101 € 2.277 € 883.637 30% 2002 2.073.921.126 € 2.287 € 906.689 34% 2003 2.155.161.343 € 2.289 € 941.628 39% 2004 2.212.272.200 € 2.316 € 955.213 42% 2005 2.422.442.553 € 2.505 € 967.010 56% 2006 2.482.406.919 € 2.484 € 999.375 60% 2007 2.815.345.066 € 1.734 € 1.623.904 81% 2008 2.947.547.823 € 1.662 € 1.773.370 90% 2009 3.015.672.718 € 1.649 € 1.829.052 94% 2010 2.835.498.937 € 1.782 € 1.591.294 83%
Manuel Varandas Fernandes & Masters in Management 13
exact opposite: total costs increased while the average cost per episode decreased. The increase in number of people may have been a reason for this effect but this table alone is not enough to test that conjectures.
Table 3 shows how the total hospitalization costs are distributed through the different age groups, and the comparison of this table with the results presented in table 2 improves the analysis. Here, since the results are presented in relative percentage terms, the years form 1994 to 2006 are comparable to the ones from 2007 to 2010.
Table 2 - The share of resident population in Portugal per age group and year
Source: Own source; Data from Instituto Nacional de Estatística, Portugal
Table 3 - The share of total simulated hospitalization costs per age group and year
Source: Own source; Data from the DRG database
Table 2 shows the demographic change that Portugal went through between 1994 and 2010. Since the total population remained fairly stable11, it is clear that, in 2010, Portugal had more elderly than it had in the past. While in 1994 the percentage of people over 64 years old was 14.6%, in 2010 that number rose to 18.5%. This increase tendency is also visible in the age groups of 50 to 64 and 35 to 49 years old. In contrast, the percentage of
11 Annex 8 1994 2000 2006 2007 2010 (0-14) 18,2% 16,1% 15,5% 15,4% 15,1% (15-24) 16,2% 14,5% 12,1% 11,8% 11,0% (25-34) 14,7% 15,2% 15,5% 15,4% 14,2% (35-49) 19,8% 21,0% 21,8% 22,0% 22,4% (50-64) 16,6% 17,0% 17,8% 18,1% 18,9% (>64) 14,6% 16,2% 17,2% 17,3% 18,5% 1994 2000 2006 2007 2010 (0-14) 9,1% 7,7% 5,2% 4,6% 3,9% (15-24) 9,2% 6,8% 4,5% 3,8% 3,4% (25-34) 11,7% 10,8% 8,9% 7,8% 7,0% (35-49) 15,1% 14,9% 14,9% 14,7% 14,2% (50-64) 21,1% 20,5% 21,4% 22,6% 22,5% (>64) 33,8% 39,3% 45,2% 46,6% 49,2%
Manuel Varandas Fernandes & Masters in Management 14
people under 15 years old went from 18.2% to 15.1%, and the share of people between 15 and 24 years old reduced from 16.2% to just 11%.
On the other hand, Table 3 shows that people over 64 years old had a huge increase in their share of total simulated hospitalization costs while people below 25 had a reduction on their share12. Moreover, for all the age groups below 50, there was a reduction in the relative share.
A comparison of both tables indicates that the increase in number of people over 64 years old could be one reason for the increase in the share of total simulated costs represented by that age group. However, the increase in the average complexity per episode as well as the increase in number of episodes per person would also be good explanations for the increase witnessed, and testing these arguments would require another type of analysis.
Still, despite their clear limitations, these tables are quite good tools to survey the evolution of the simulated hospitalization costs and how they were distributed through the age groups. Moreover, they are useful for identifying some potential reasons for the changes that occurred between 1994 and 2010.
4.2 – Graphical Analysis
This section is focused on the average simulated costs per age and year. Each year has its own curve and what really matters is to notice the curves’ downward or upward shifts from one year to another.
Manuel Varandas Fernandes & Masters in Management 15
Graph 1 - Simulated average cost curves per age, years: 1994 and 2000
Source: Own source; Data from the DRG database
It is noticeable that, despite the majority of ages having had an increase of the average simulated cost, a bigger upward shift occurred in ages from 45 to almost 85 years old.
Since prices were fixed (no new treatments considered) and simultaneously the number of elderly increased while the number of younger people decreased, the significant increase in average costs for people between 45 and 85 years old (when compared with other ages) implies that those ages were the ones responsible for the increase in the total simulated hospitalizations costs. However, considering the population’s pyramid change a main reason for the total simulated cost increase may be a rush since other factors, such as the increase in number of episodes per person or the change in complexity mix of the DRGs’ composition, may have had contributed as well. Even though the ageing effect magnitude is not clear in this graph, it is reasonable to say that it may have had some influence.
Graph 2 clearly shows the increase in number of episodes for the ages among 30 and 95 years old. While it is obvious that this increase had influence over total simulated costs, its influence in the increase of the average simulated costs is less evident as the number of people in those age groups changed between 1994 and 2000.
Manuel Varandas Fernandes & Masters in Management 16
Graph 2 - Number of episodes per age, years: 1994 and 2000
Source: Own source; Data from the DRG database
Graph 3 - Simulated average cost curve per age, years: 1994 and 2006
Source: Own source; Data from the DRG database
As seen in graph 3, through the comparison of a larger period of time, it is easier to perceive the increasing average cost gap when age increases. Although the average cost is higher in 2006 than in 1994 since the age of 15 years old, for ages above 50, the gap is even bigger. In this comparison there is even more evidence that people over 50 contributed to the increase in the total simulated hospitalization costs.
The next graph presents the same information as graph 1 and 3 but for the period from 2007 to 2010. As previously explained, here too the comparison between the years of 1994 through 2006 with the years from 2007 to 2010 is impracticable, but a comparison inside
Manuel Varandas Fernandes & Masters in Management 17
each group is still reasonable.
Graph 4 - Simulated average cost curve per age, years: 2007 and 2010
Source: Own source; Data from the DRG database
The effect witnessed between 1994 and 2006 did not happen from 2007 to 2010. In the later period, there is no evident pattern of evolution of the simulated average cost, and as such, through this graphical analysis it is not viable to conjecture. Nevertheless, for the ages of 45 through 69 years old, it is noticeable that the simulated average cost was almost always higher in 2010. Once again, this shows that people over 64 years old are not the only ones pushing the hospitalization expenses up. Still, for all the other age groups, the differences between 2007 and 2010 were not very revealing.
Graph 5 summarizes the simulated average costs gaps between the periods 1994-2000, 1994-2006, and 2007-2010. This visual representation of the data makes it easier to understand what was previously argued.
Although the gap is shorter and did not follow any particular pattern between 2007 and 2010, in the periods of 1994-2000 and 1994-2006 there are remarkable differences in the average simulated costs. The red line represents the increasing tendency that started at the age of 40 and as it progresses to elder ages the gap between the 1994 average costs and the
Manuel Varandas Fernandes & Masters in Management 18
2006 average costs gets bigger. On the other hand, it is evident that, from 1994 to 2000, the ages between 40 and 90 were the ones in which the average simulated cost increased the most.
Graph 5 - Simulated average cost gaps, per age, between 1994-2000, 1994-2006, and 2007-201013
Source: Own source; Data from the DRG database
Although the graphical analysis did not provide a complete view of the whole scenario, it actually brought an additional sign to the important role that ageing may have had on the increasing hospitalization costs in Portugal. However, it is reasonable to believe that the change in society’s age pyramid per se was not the sole cause. In the following section the total simulated hospitalization costs’ increase is numerically decomposed, making it possible to study the influence of each variable on its own.
4.3 – Total Simulated Hospitalization Cost Decomposition
For this study, the ageing effect was defined as the increase in hospitalization costs that would have occurred due to an increase in the number of people above 64 years old. As mentioned before, this section’s aim is to decompose the increase in total hospitalization costs and that will be done with the use of the formulas and the methods described in
Manuel Varandas Fernandes & Masters in Management 19
section 3.3.3. In order to simplify the notation, the terms in equation (1) were replaced by the letters Y, A, B, and C, as it shows below:
( ) ( ) ( ( ) ( ) ⁄ ( ) ( ) ⁄ ) ( ( ) ( ) ⁄ ( ) ( ) ⁄ ) ( ( ) ( ))
The following table shows the computed values of the equations (1) and (2). They were applied to the age groups defined below and the analysis period was t = 2006, and 0 = 1994.
Table 4 - Equation (1) and (2) per age group; t = 2006 and 0 = 1994
Source: Own source; Data from the DRG database
This decomposition reveals that the 113.79% increase in total simulated costs for the age group of people over 64 years old was generated by a 19.44% growth in the average simulated costs per episode, a 43.61% increase in number of episodes per person in the country, and by a 24.64% increase in number of people within this age group. Since technology and new treatments were fixed as a consequence of fixed prices, the increase in average cost per episode meant that the DRG-mix changed to a more complex one. In other words, the use of higher resource consumption DRGs (with higher relative weight, and therefore, higher prices) increased. On the other hand, for the age group of 0 to 24 years old, the total simulated hospitalization costs registered a decrease of 15.88%, and it is evident that the main reason for that decrease was the 14.96% reduction in number of
Y TC Variation
(% ) Ln(Y) A
Avg Cost per Episode Variation (% ) Ln(A) B Nr of Episodes per Person Variation (% ) Ln(B) C Population Variation (% ) Ln(C) (0-24) 0,841 -15,88% -0,173 0,986 -1,37% -0,014 1,003 0,29% 0,003 0,850 -14,96% -0,162 (25-49) 1,413 41,31% 0,346 1,142 14,15% 0,132 1,079 7,93% 0,076 1,147 14,70% 0,137 (50-64) 1,625 62,53% 0,486 1,154 15,38% 0,143 1,239 23,92% 0,214 1,137 13,68% 0,128 (>65) 2,138 113,79% 0,760 1,194 19,44% 0,178 1,436 43,61% 0,362 1,246 24,64% 0,220 All Ages 1,598 59,80% 0,469 1,197 19,70% 0,180 1,262 26,18% 0,233 1,058 5,80% 0,056 Y = A x B x C
Manuel Varandas Fernandes & Masters in Management 20
people in this group.
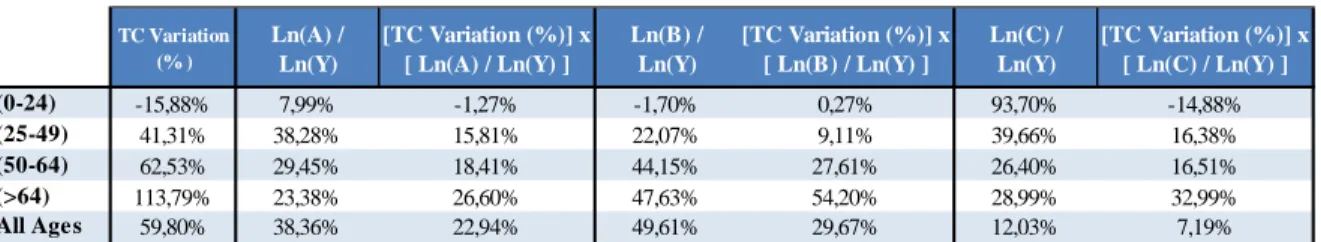
Through the product of the weight of each factor by the total simulated costs variation (as described in the methodology and in the following table), it was possible to analyze the effect of each variable as if the other two had remained unchanged.
Table 5 - Total simulated hospitalization cost decomposition, per age group, t = 2006 and 0 = 1994
Source: Own source; Data from the DRG database
If the average cost per episode had remained constant (A = 1 and Ln(A) = 0), as well as the number of episodes per person (B = 1 and Ln(B) = 0), the increase of 24.64% in number of people over 64, would have generated an increase of 32.99% in the total simulated hospitalization costs of that age group, between 1994 and 2006. Thus, the increase in number of people in that age cluster was clearly a significant factor to the rise of the total simulated cost of the group. However, in that age group, what pushed the total hospitalization cost the most, was the increase in number of episodes per person. If the number of people had stayed constant (C = 1 and Ln(C) = 0), as well as the average cost per episode (A = 1 and Ln(A) = 0), the 43.61% increase in number of episodes per person would have made the total simulated cost increase by 54.20%.
Since the total simulated costs increased 59.80%, it is obvious that the decrease in costs of younger people was not enough to compensate for the increase in costs of elder people and therefore to maintain the overall costs stable.
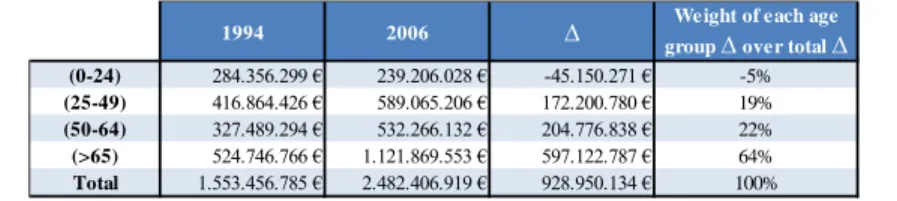
Table 6 shows how much each age group contributed to the total costs increase.
TC Variation (% ) Ln(A) / Ln(Y) [TC Variation (%)] x [ Ln(A) / Ln(Y) ] Ln(B) / Ln(Y) [TC Variation (%)] x [ Ln(B) / Ln(Y) ] Ln(C) / Ln(Y) [TC Variation (%)] x [ Ln(C) / Ln(Y) ] (0-24) -15,88% 7,99% -1,27% -1,70% 0,27% 93,70% -14,88% (25-49) 41,31% 38,28% 15,81% 22,07% 9,11% 39,66% 16,38% (50-64) 62,53% 29,45% 18,41% 44,15% 27,61% 26,40% 16,51% (>64) 113,79% 23,38% 26,60% 47,63% 54,20% 28,99% 32,99% All Ages 59,80% 38,36% 22,94% 49,61% 29,67% 12,03% 7,19%
Manuel Varandas Fernandes & Masters in Management 21
Table 6 - Total simulated hospitalization costs per age group; years: 1994 and 2006
Source: Own source; Data from the DRG database
The table above shows that the increase in costs in the age group of people over 64 years old was responsible for 64% of the increase in the total simulated hospitalization costs. Since the weights of each factor within each age group were already computed, it is now straightforward to make a conclusion about the role of ageing in the overall costs increase. If 28.99% of the increase in total simulated costs of the age group of people above 64 were due to the increase in the number of people within that age group, it would be fair to say that 18.55%14 of the total simulated hospitalization costs increase was due to ageing. This also means that if the other two variables had remained stable (A = 1 and Ln(A) = 0; B = 1 and Ln(B) = 0), the increase in the number of people over 64 years old would have generated an increase of 172M €15 in the total simulated hospitalization cost. These results led to the conclusion that ageing per se would have generated an increase of 11.09%16 in the total simulated hospitalization costs, proving that it actually played an important role in the increase of total costs that was registered between 1994 and 2006.
Table 7 - Equation (1) and (2) per age group; t = 2010 and 0 = 2007
Source: Own source; Data from the DRG database
14 (64% x 0.2899 = 18.55%) 15
(0.1855 x 928,950,134€ = 172,320,250€)
16 ( (172,320,250€ / 1,553,456,758€ ) - 1 = 0.1109 )
1994 2006 ∆ group ∆ over total ∆Weight of each age
(0-24) 284.356.299 € 239.206.028 € -45.150.271 € -5% (25-49) 416.864.426 € 589.065.206 € 172.200.780 € 19% (50-64) 327.489.294 € 532.266.132 € 204.776.838 € 22% (>65) 524.746.766 € 1.121.869.553 € 597.122.787 € 64% Total 1.553.456.785 € 2.482.406.919 € 928.950.134 € 100% Y TC Variation (% ) Ln(Y) A
Avg Cost per Episode Variation (% ) Ln(A) B Nr of Episodes per Person Variation (% ) Ln(B) C Population Variation (% ) Ln(C) (0-24) 0,867 -13,34% -0,143 1,014 1,38% 0,014 0,893 -10,73% -0,113 0,957 -4,25% -0,043 (25-49) 0,949 -5,07% -0,052 1,014 1,38% 0,014 0,957 -4,31% -0,044 0,979 -2,15% -0,022 (50-64) 1,003 0,27% 0,003 1,038 3,83% 0,038 0,924 -7,56% -0,079 1,045 4,47% 0,044 (>65) 1,063 6,26% 0,061 1,021 2,10% 0,021 0,978 -2,24% -0,023 1,065 6,46% 0,063 All ages 1,007 0,72% 0,007 1,028 2,78% 0,027 0,980 -1,98% -0,020 1,000 -0,03% 0,000
Manuel Varandas Fernandes & Masters in Management 22
Table 8 - Total simulated hospitalization cost decomposition, per age group; t = 2010 and 0 = 2007
Source: Own source; Data from the DRG database
Table 9 - Total simulated hospitalization costs per age group; years: 2007 and 2010
Source: Own source; Data from de DRG database
Following the same logic as above, it becomes clear that, from 2007 to 2010, the 6.46% increase in number of people above 64 years old would have generated an increase of 6.45% in total simulated cost, if the other two variables had remained constant (A = 1 and Ln(A) = 0; B = 1 and Ln(B) = 0). Table 9 shows that people above 64 were the ones who pushed the simulated hospitalization costs. Since the increase in costs of that age group weighted 407% of the total cost increase, and 103.13% of the increase in the total costs of people over 64 was due to the increase in number of people also in that age group, 419.74%17of the total simulated costs increased was due to the increase of the number of people over 64 years old. However, what seems to be a huge percentage corresponds in fact to a small absolute increase. To conclude, it is reasonable to say that ageing per se (when A = 1 and Ln(A) = 0; B = 1 and Ln(B) = 0) would have generated an increase of 85M €18, which would have been only a 3%19 increase of the total simulated hospitalization costs.
17 (1.0313 x 407% = 419.74%) 18 (4.1974 x 20,153,871€ = 84,593,858€) 19 ( (84,593,858€ / 2,815,345,066€) - 1 = 0.03) TC Variation (% ) Ln(A) / Ln(Y) [TC Variation (%)] x [ Ln(A) / Ln(Y) ] Ln(B) / Ln(Y) [TC Variation (%)] x [ Ln(B) / Ln(Y) ] Ln(C) / Ln(Y) [TC Variation (%)] x [ Ln(C) / Ln(Y) ] (0-24) -13,34% -9,60% 1,28% 79,24% -10,57% 30,36% -4,05% (25-49) -5,07% -26,29% 1,33% 84,58% -4,29% 41,71% -2,12% (50-64) 0,27% 1376,68% 3,76% -2880,49% -7,87% 1603,80% 4,38% (>64) 6,26% 34,22% 2,14% -37,35% -2,34% 103,13% 6,45% All Ages 0,72% 384,39% 2,75% -279,89% -2,00% -4,49% -0,03%
2007 2010 ∆ group ∆ over total ∆Weight of each age
(0-24) 237.106.608 € 205.470.242 € -31.636.366 € -157%
(25-49) 631.316.807 € 599.297.864 € -32.018.943 € -159%
(50-64) 635.038.465 € 636.773.081 € 1.734.616 € 9%
(>65) 1.311.883.186 € 1.393.957.750 € 82.074.564 € 407%
Manuel Varandas Fernandes & Masters in Management 23
5. Conclusion
The Portuguese simulated hospitalization costs have been growing since 1994, and from then to 2010, whilst the number of people over 64 year’s old grew 34.14%, the Portuguese population only increased 6.01% as a whole.
In this work project it is proven that from 1994 to 2006, ageing per se would have increased the total simulated hospitalization costs by 11.09%, while between 2007 and 2010, it would only have had generated an increase of 3%. However, it also became clear that in the periods of 1994-2006 and 2007-2010, the increase in the total simulated costs was of 59.86% and 0.72%, respectively. Therefore, it is reasonable to conclude that between 1994 and 2006, despite its moderated influence, ageing did not play a significant main role in the overall increase. On the other hand, from 2007 to 2010, even though the costs only increased by less than 1%, ageing was one of the main factors that pushed up the total costs, whilst other factors contributed to reduce the total simulated costs.
The Portuguese National Healthcare Service (Serviço Nacional de Saúde - SNS) numbers showed that between 1994 and 2006 the costs increased 123%, while from 2007 to 2010 they only increased 13%20. Since hospitalization episodes only represent a share of the total SNS costs, it is reasonable to say that the ageing effect that contributed to increase the total hospitalization costs between 1994 and 2010 was even less significant to the increase in the overall SNS costs. However, this work project clearly proved that the ageing effect was not null and actually influenced the increase of the hospitalization costs in Portugal.
Manuel Varandas Fernandes & Masters in Management 24
6. References
- European Commission (2012). The 2012 Ageing Report: Economic and budgetary projections for the 27 EU Member States (2010-2060);
- Getzen, Thomas. 1992. “Population Aging and the Growth of Health Expenditures.” Journal of Gerontology: Social Sciences, 42: 98 - 104;
- Longman, Phillip. 1987. Born to pay: the new politics of aging in America. Boston: Houghton Mifflin;
- Millan, E., Agustin Molina Morales, and Ignacio Amate Fortes. 2006. “Hospital Utilization and Aging in Spain”. Current Aging Science, 3 (2): 151 - 157;
- Newbold, Paul, William L. Carlson, and Betty Thorne. 2007 - Sixth Edition. Statistics for Business and Economics. Pearson Prentice Hall
- Seshamani, Meena, and Alastair Gray. 2004. “Ageing and health-care expenditure: the red herring argument revisited.”. Health Economics, 13 (4): 303 - 314;
- Zweifel, Peter, Stefan Felder, and Markus Meiers. 1999. “Ageing of Population and Health Care Expenditure: A Red Herring?” Health Economics, 8: 485 - 496;
7. Data Sources
[i] - http://portalcodgdh.min-saude.pt; [ii] - http://www.acss.min-saude.pt - http://www.pordata.pt;
in Management from NOVA – School of Business and Economics
Was Ageing a Cause for the Increase in Hospitalization Costs, in the
Portuguese Public Hospitals, between 1994 and 2010?
ANNEXES
MANUEL BARBOSA VARANDAS FERNANDES 937
A Project carried out on the Health Economics course, under the supervision of: Professor Pedro Pita Barros
Manuel Varandas Fernandes & Masters in Management 1
Annex 1
Share of each age group, over total population, per year
Source: Own source; Data from Instituto Nacional de Estatística, Portugal
Annex 2
Mapping from the old DRGs to the correspondent new DRGs from Portaria 132/2009
Source: Own source
1994 2002 2010
(0-24) 34,3% 29,4% 26,0%
(25-49) 34,5% 36,8% 36,6%
(>49) 31,2% 33,8% 37,3%
Old DRG New DRG DRG with more
than one option Old DRG New DRG
DRG with more than one option
3 738 * 438 750 * 4 836 * 460 828 5 838 * 473 782 * 26 768 * 481 803 27 761 484 730 28 766 485 731 29 767 486 732 30 763 487 734 31 764 488 703 32 765 489 714 33 762 490 715 * 81 770 * 492 876 91 772 * 495 795 98 774 * 496 806 * 184 776 * 497 755 190 778 * 498 756 214 757 499 757 215 758 500 758 231 866 * 501 221 396 785 502 222 400 874 * 503 221 * 405 782 * 504 821 411 467 505 822 412 467 506 823 433 750 * 507 824 434 750 * 508 825 435 750 * 509 826 436 750 * 510 827 * 437 750 * 511 828
Manuel Varandas Fernandes & Masters in Management 2
Annex 3
Weight of the DRGs with more than one new option (in the mapping) over total hospitalization costs, per year
Source: Own source
Annex 4
Dropped childbirth DRGs
Source: Own source
year % 1994 4,88% 1995 4,82% 1996 4,84% 1997 5,19% 1998 5,02% 1999 4,88% 2000 4,84% 2001 4,84% 2002 4,70% 2003 4,77% 2004 4,81% DRG before 2005 385 602 619 386 603 620 387 604 621 388 605 622 389 606 623 390 607 624 391 608 626 609 627 610 628 611 629 612 630 613 635 614 637 615 638 616 639 617 640 618 641 DRG afte r 2004
Manuel Varandas Fernandes & Masters in Management 3
Annex 5
Valorization rules for the hospitalization episodes, from Portaria 132/20009, that were followed in this work project
- Artigo 4.º - Artigo 5.º - Artigo 6.º
- Artigo 9.º (however, sections 3, 5, 7, 8, 9 and 15, were not followed because of some information availability issues)
Note: more detailed information is available in the stata12 do-file
Annex 6
Number of Hospitals and Beds of Portuguese Public Hospitals
Source: Data from Instituto Nacional de Estatística, Portugal
Year Nr. Hospitals Nr. of Beds
1994 202 38450 1995 200 38471 1996 211 39212 1997 215 38818 1998 215 38221 1999 218 38262 2000 219 38165 2001 217 37809 2002 213 37162 2003 204 37459 2004 209 37855 2005 204 37372 2006 200 36605 2007 198 36220 2008 189 35803 2009 186 35635 2010 229 35625
Manuel Varandas Fernandes & Masters in Management 4
Annex 7
Example: Before 2007, a patient who had received some chemotherapy treatments would count as only one episode, while after 2007, the same patient with the some treatments would count one episode for each treatment.
Annex 8
Portuguese resident population per year and per age group
Source: Own source; Data from Instituto Nacional de Estatística, Portugal
Annex 9
Total simulated hospitalization costs per year and per age group
Source: Own source, data from DRG database
1994 2000 2006 2007 2010 (0-14) 1.815.902 1.647.677 1.640.934 1.633.245 1.596.259 (15-24) 1.617.911 1.483.905 1.279.281 1.250.768 1.165.063 (25-34) 1.472.618 1.551.737 1.643.185 1.634.434 1.508.771 (35-49) 1.976.173 2.148.306 2.312.454 2.333.692 2.374.136 (50-64) 1.661.796 1.738.131 1.889.131 1.916.974 2.002.700 (>64) 1.459.682 1.656.082 1.819.359 1.839.224 1.958.008 Total 10.004.081 10.225.836 10.584.344 10.608.335 10.604.935 1994 2000 2006 2007 2010 (0-14) 140.699.171 € 148.640.789 € 127.926.179 € 130.685.261 € 109.539.356 € (15-24) 143.657.128 € 131.682.220 € 111.279.849 € 106.421.347 € 95.930.886 € (25-34) 182.363.803 € 207.395.854 € 220.290.494 € 218.321.356 € 197.262.212 € (35-49) 234.500.623 € 286.730.112 € 368.774.712 € 412.995.451 € 402.035.652 € (50-64) 327.489.294 € 393.461.863 € 532.266.132 € 635.038.465 € 636.773.081 € (>64) 524.746.766 € 755.231.964 € 1.121.869.553 € 1.311.883.186 € 1.393.957.750 € Total 1.553.456.785 € 1.923.142.802 € 2.482.406.919 € 2.815.345.066 € 2.835.498.937 €
Manuel Varandas Fernandes & Masters in Management 5
Annex 10
SNS costs in Million € (base year: 2006)
Source: Pordata; Data source: ACSS/MS
Annex 11
The Sata12 do-files that were constructed to work the information in the DRG database
https://www.dropbox.com/s/qv77s5v0ppg1ni6/stata12%20do_files%20Manuel%20Varand as%20Fernandes%20937.do?m Year Total costs Personnel expenses SNS costs without Personnel cost Variation (% ) to the base year
Base year (for the variation(% )) 1994 4605,8 2181,4 2424,4 0% 1994 1995 4781,5 2206,4 2575,1 6% 1994 1996 5193,8 2314,5 2879,3 19% 1994 1997 5568 2451,3 3116,7 29% 1994 1998 5996,5 2638,5 3358 39% 1994 1999 6590 2890,1 3699,9 53% 1994 2000 7143,9 3102,6 4041,3 67% 1994 2001 7598,7 3300,2 4298,5 77% 1994 2002 7860,6 3327,2 4533,4 87% 1994 2003 8319,7 3422,1 4897,6 102% 1994 2004 9014,2 3486,7 5527,5 128% 1994 2005 9525,2 3600,9 5924,3 144% 1994 2006 9018,8 3600,3 5418,5 123% 1994 2007 8861,1 3578 5283,1 0% 2007 2008 8900,1 3536,2 5363,9 2% 2007 2009 9346,9 3778,7 5568,2 5% 2007 2010 9684 3710,1 5973,9 13% 2007