_______________________________
EDITORIAL COMMENT
Responsible Editors:
Prof. Dr. Fernando Antonio Ribeiro Serra Prof. Dr. Manuel Portugal Ferreira Guest Professors:
Luiz Antonio Camargo Guerrazzi Vanessa Vasconcelos Scaciotta DOING BIBLIOMETRIC REVIEWS FOR THE
IBEROAMERICAN JOURNAL OF STRATEGIC MANAGEMENT
The editorial comments published in the Iberoamerican Journal of Strategic Management are intended to help researchers and students to improve their articles. These editorial comments include content and suggestions about writing, publishing and reviewing articles, as well as methodological issues. In this new editorial comment, we will present our views on bibliometric studies. Bibliometric studies are sometimes marginalized, but in our view, as in any other study, the problems are equivalent to a study that is not done properly.
We believe that bibliometric studies are valuable in many ways, not only for publishing, but also to help students search for references to their theme, enable professors to build their graduate discipline programs and understand the mainstream of the theme. There are many other possibilities, but in the IJSM, we appreciate good bibliometric studies, not only in the perspective section, but also in the book review sections. However, we receive many bibliometric studies that are not good enough for publication and do not follow a rigorous methodological procedure.
In this editorial comment, I have the support of Professors Luiz Guerrazzi and Vanessa Scacciota, who are experts on this method. We will specifically concentrate on bibliometric cocitation and bibliographic coupling studies. We will also provide a basic script for conducting a cocitation and bibliographic coupling study. This script has been in development since 2007. It was constructed by Rodrigo Martins, Bernardo Serra and Luiz Guerrazzi during their graduate courses, and supervised by the current editors of IJSM. The initial work with Bibexcel software was supported by Prof. Samile Vanz from UFRGS. This script was last updated in 2018.
Received on: April 05, 2018 Approved on: June 27, 2018
How to Cite
(APA)______________________________________ Serra, F., Ferreira, M., Guerrazzi, L., & Scaciotta, V. (2018).
Doing Bibliometric Reviews for the Iberoamerican Journal of Strategic Management. Iberoamerican Journal Of Strategic Management (IJSM), 17(3), 01-16. doi:10.5585/ijsm.v17i3.2713
(ABNT)______________________________________ SERRA, F., FERREIRA, M., GUERRAZZI, L., SCACIOTTA, V.. Doing
Bibliometric Reviews for the Iberoamerican Journal of Strategic Management. Iberoamerican Journal of Strategic Management (IJSM). 17, sep. 2018. Available at: <http://revistaiberoamericana.org/ojs/index.php/ibero/ar ticle/view/2713>
_______________________________
The editorial comments published in the Iberoamerican Journal of Strategic Management are intended to help researchers and students to improve their articles. These editorial comments include content and suggestions about writing, publishing and reviewing articles, as well as methodological issues. In this new editorial comment, we will present our views on bibliometric studies. Bibliometric studies are sometimes marginalized, but in our view, as in any other study, the problems are equivalent to a study that is not done properly.
We believe that bibliometric studies are valuable in many ways, not only for publishing, but also to help students search for references to their theme, enable professors to build their graduate discipline programs and understand the mainstream of the theme. There are many other possibilities, but in the IJSM, we appreciate good bibliometric studies, not only in the perspective section, but also in the book review sections. However, we receive many bibliometric studies that are not good enough for publication and do not follow a rigorous methodological procedure.
In this editorial comment, I have the support of Professors Luiz Guerrazzi and Vanessa Scacciota, who are experts on this method. We will specifically concentrate on bibliometric cocitation and bibliographic coupling studies. We will also provide a basic script for conducting a cocitation and bibliographic coupling study. This script has been in development since 2007. It was constructed by Rodrigo Martins, Bernardo Serra and Luiz Guerrazzi during their graduate courses, and supervised by the current editors of IJSM. The initial work with Bibexcel software was supported by Prof. Samile Vanz from UFRGS. This script was last updated in 2018.
BIBLIOMETRIC STUDIES - COCITATION AND BIBLIOGRAPHIC COUPLING
Scholars seek to understand and make logical sense of knowledge produced through the evolution of disciplines and research themes (Ferreira, Pinto & Serra, 2014). There are many ways to prepare reviews (Paré et al., 2011). In
addition to other possibilities, extant research works can be measured using objective methods, such as bibliometric methods (Ferreira, Pinto & Serra, 2014). Bibliometrics can be used as an indicator of scientific research performance (e.g., Phelan, Ferreira & Salvador, 2002). It can also be used, in less descriptive works, to trace the intellectual structure and mainstream of current research trends (Vogel, & Güttel, 2013). In the latter case, bibliometrics can be used to conduct a more structured literature review, including information and identifying patterns in a field, theme or phenomenon (Zupic, & Čater, 2015).
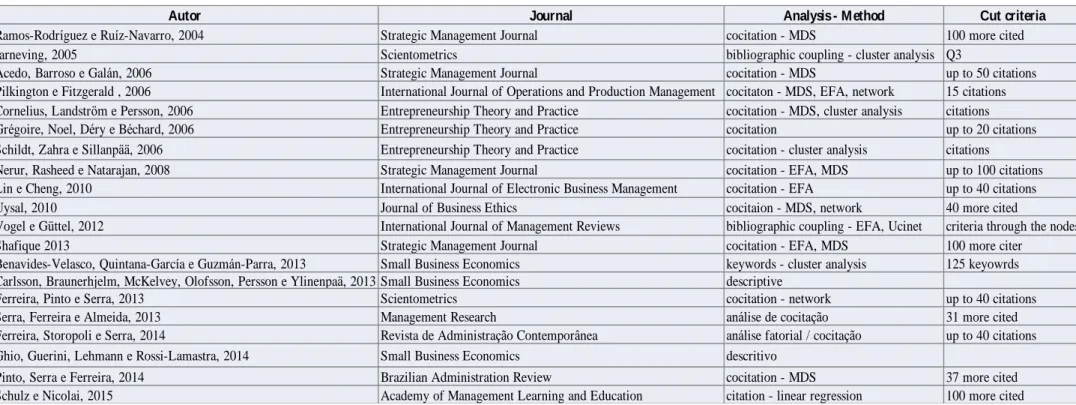
Bibliometric analyses are used to investigate several fields of research, including strategic management (Table 1). Ramos-Rodriguez and Ruiz-Navarro (2004) and Nerur, Rasheed and Natarajan (2008) investigated the intellectual structure of strategic management research. Shafique (2013) investigated the intellectual structure of innovation in a strategic perspective.
As shown in Table 1, most studies published in renowned journals predominantly use the cocitation method supported by multivariate quantitative methods. Bibliographic coupling works are also growing in number.
Figure 1 illustrates the difference between cocitation and bibliographic coupling (Vogel, & Güttel, 2013). Cocitation allows a measurement of how frequently a pair of articles are cited together (McCain, 1990). Cocitation analysis is a measurement that changes over time as a field evolves. It is useful for detecting paradigmatic changes and schools of thought (Zupic, & Čater, 2015). Cocitation analysis is a method that reflects the past influence of the research field. It is related to the impact of publications. Cocitation represents the knowledge basis of the field (Gregoire et al., 2016), and citation analysis is usually used together with cocitation analysis, as both use the references of a work. It identifies the most influential works on the assumption that the more contributions a work makes to a theme, the more it will be cited (McCain, 1990).
Figure 1 - Cocitation and bibliographic coupling
_______________________________
Table 1 - Example of bibliometric studies - methods, analysis and sample cut criteria
Note: Complete references available on request.
Autor Journal Analysis - Method Cut criteria
Ramos-Rodríguez e Ruíz-Navarro, 2004 Strategic Management Journal cocitation - MDS 100 more cited
Jarneving, 2005 Scientometrics bibliographic coupling - cluster analysis Q3
Acedo, Barroso e Galán, 2006 Strategic Management Journal cocitation - MDS up to 50 citations
Pilkington e Fitzgerald , 2006 International Journal of Operations and Production Management cocitaton - MDS, EFA, network 15 citations Cornelius, Landström e Persson, 2006 Entrepreneurship Theory and Practice cocitation - MDS, cluster analysis citations
Grégoire, Noel, Déry e Béchard, 2006 Entrepreneurship Theory and Practice cocitation up to 20 citations
Schildt, Zahra e Sillanpää, 2006 Entrepreneurship Theory and Practice cocitation - cluster analysis citations
Nerur, Rasheed e Natarajan, 2008 Strategic Management Journal cocitation - EFA, MDS up to 100 citations
Lin e Cheng, 2010 International Journal of Electronic Business Management cocitation - EFA up to 40 citations
Uysal, 2010 Journal of Business Ethics cocitaion - MDS, network 40 more cited
Vogel e Güttel, 2012 International Journal of Management Reviews bibliographic coupling - EFA, Ucinet criteria through the nodes
Shafique 2013 Strategic Management Journal cocitation - EFA, MDS 100 more citer
Benavides-Velasco, Quintana-García e Guzmán-Parra, 2013 Small Business Economics keywords - cluster analysis 125 keyowrds Carlsson, Braunerhjelm, McKelvey, Olofsson, Persson e Ylinenpaä, 2013 Small Business Economics descriptive
Ferreira, Pinto e Serra, 2013 Scientometrics cocitation - network up to 40 citations
Serra, Ferreira e Almeida, 2013 Management Research análise de cocitação 31 more cited
Ferreira, Storopoli e Serra, 2014 Revista de Administração Contemporânea análise fatorial / cocitação up to 40 citations
Ghio, Guerini, Lehmann e Rossi-Lamastra, 2014 Small Business Economics descritivo
Pinto, Serra e Ferreira, 2014 Brazilian Administration Review cocitation - MDS 37 more cited
_______________________________
Bibliometric coupling is also a measure of similarity, but is based on the frequency that two documents from the sample share at least one common reference, i.e., the documents of a sample are grouped in accordance with the overlapping of its bibliographies (Vogel, & Güttel, 2013; Zupic, & Čater, 2015). The higher the number of references shared by two documents in a sample, the greater the similarity between them (White, & McCain, 1998; Vogel, & Güttel, 2013). Bibliographic
coupling results change slightly over time and reflect the evolution of research, rather than its impact (Vogel, & Güttel, 2013). Bibliographic coupling is useful for detecting tendencies and possible paths to a field, and is related to publication. Bibliographic coupling indicates the research front in a field (Zupic, & Čater, 2015). Zupic, & Čater (2015) and suggests some research questions to guide bibliometric studies (Table 2).
Table 2 - Example of research questions considering different bibliometric studies Citation analysis
Which authors most influenced the research in a journal?
Which journals and disciplines had the most impact on a research stream? What is the “balance of trade” between journals/disciplines?
Who are the experts in a given research field?
What is the recommended “reading list” for a specific area? Cocitation analysis
What is the intellectual structure of literature X?
Who are the central, peripheral or bridging researchers in this field?
How has the diffusion of the concept through research literature taken place? What is the structure of the scientific community in a particular field? How has the structure of this field developed over time?
Bibliographic coupling
What is the intellectual structure of recent/emerging literature?
How does the intellectual structure of the research stream reflect the richness of the theoretical approaches? How has the intellectual structure of small niche X developed through time?
Source: Zupic, & Čater (2015) The aforementioned methods produce
different results using empirical evidence, but are complementary (Janerving, 2005). Vogel and Güttel (2013) suggest that researchers dedicated to a research field should not focus only to the mainstream of their field, but also to the “newstream”. These works can be identified using bibliographic coupling. The “newstream” may reveal “tomorrow’s classics”. In spite of the traditional use of cocitation techniques in bibliometric studies (Zupic, & Čater, 2015), bibliographic coupling is interesting when it comes to understanding growing fields of publication (Vogel & Güttel, 2013).
The use of cocitation and bibliographic techniques supported by multivariate methods does not replace the need for extensive reading of works (Zupic & Čater, 2015). The bibliometric method used as a review may be considered a mixed method (see Creswell, 2014).
Bibliometric methods will often reveal the structure of a field differently from
the classification of traditional literature reviews, so these differences need to be reconciled. Science maps provide a starting point for analytical examination but are not an end in itself. Interpretation strategies in bibliometric analysis are dependent on the focus of the paper authors are writing.
(Zupic, & Čater, 2015 p. 31).
METHODOLOGICAL SEQUENCE SUGGESTED
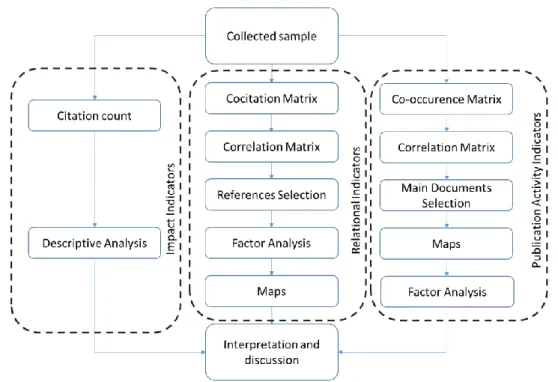
Figure 2 summarizes the methodological sequence suggested for bibliometric studies of cocitation and bibliographic coupling. It is an adaption of the method used by Ramos-Rodriguez and Ruiz-Navarro (2004), with the inclusion of the bibliographic coupling proposed by Vogel and Güttel (2013).
_______________________________
Figure 2 - Citation, cocitation and bibliographic coupling methods.
Source: Adapted from Ramos-Rodriguez and Ruiz-Navarro (2004) and Vogel and Güttel (2013).
Data collection and sample
Two databases are normally used to collect information for bibliometric studies: Web of Science and Scopus. Both are important because of their wide coverage of social science publications, as they index the main international periodicals in the field. Despite the existence of works that examine a field through specialized journals, e.g. the article of Ramos-Rodriguez and Ruiz-Navarro (2004), which examined the articles published in the Strategic Management Journal using cocitation, we usually conduct a search using words or terms related to the subject we wish to investigate. This is a sensitive step, as the words must cover the topic but avoid being too broad in scope, making it difficult to filter the articles for the final sample. We also suggest using “*” after incomplete words to search for variations of the word. For example, Vogel and Güttel, 2012 (p. 5) used the term “dynamic capabilit*” to search the titles, abstracts and keywords of the Social Science Citation Index of Web Science in their work.
Even with carefully selected terms for searching and refining by field in the database (e.g., Business and Management), there is the possibility that articles not related to the research topic will be automatically selected. To reduce the sample bias, and guarantee the validity and reliability of the selected studies, the authors must define the criteria for the inclusion of articles in their sample (Zupic,
& Čater, 2015), as the filtering of the sample is not automatic. We suggest that this filtering should be done by at least two of the authors independently through the reading of the title, abstract and introduction of the works. Whenever the authors do not agree, we suggest that they should read the article together.
Analysis procedures
In our procedure, we suggest the use of the Bibexcel software for information extraction and organization (Persson, Danell, & Schneider, 2009). The software extracts and organizes information from the databases to enable different possibilities of bibliometric study objects (authors, keywords, references, year of publication, journal, etc.) in excel sheets. This primary information must also be reviewed by the researchers, as the references may not be uniform. We use the year of publication to evaluate the growth of the theme (see Figure 3 for an example) and the frequency of publication to research citation. The software also generates the co-specific occurrence matrix to investigate cocitation and bibliographic coupling. These matrices have the same references in both rows and columns, with frequency of co-occurrence in the cells, which can be considered a measure of similarity (e.g., Bernard & Ryan, 2010). The matrices can be used as input for exploratory multivariate analysis (Bazeley, 2010), in this case,
_______________________________
either for the EFA or the network analysis. Through statistical analyses, large quantities of bibliographic data can be gathered, which are more complex in uniquely qualitative reviews (Vogel, & Güttel, 2013; Zupic, & Čater, 2015).
The citation analysis is the first procedure we suggest should be conducted. With this procedure, the authors can identify the most cited, i.e., the most representative, works in the field. The citation analysis shown reflects how frequently works are referenced in other works (Vogel, & Güttel, 2013). The sample cut regarding the quantity of references is done regarding Lotka’s law of bibliometrics, that very few articles (around 5%) would be representative of the field (Nath, & Jackson, 1991). It should be highlighted that Bibexcel software is used to extract the references (Pilkington, 2006). Usually, in established fields no more than 50 cited references would represent between 5 and 10% of the total citations.
The cocitation co-occurrence matrix using the selected references is extracted using Bibexcel software (Persson, et al., 2009). To continue with the analysis, we suggest the use of EFA, since it is the most common clustering method in bibliometrics (McCain, 1990; Zupic, & Čater, 2015), as shown, for example, in Table 1. The matrix should be converted into a Pearson correlation matrix used as factor analysis input. The factor analysis can be run with statistical packages such as SPSS or R. We also suggest considering the diagonal of the matrix as null, a simplification that will not change the results (White, & Griffith, 1981; Charvet et al., 2008). We propose that the extraction of factors using the principal components method, with Varimax rotation (Lin, & Cheng, 2010) and Kaiser normalization, retaining factor loading greater than or equal to 0.40, be maintained. We attribute the documents with cross-loadings1 to
the factor in which their loading was greater (Vogel, & Güttel, 2013). As we used an exploratory factor analysis, we suggest the use of an alternative method to increase the robustness of the results (Zupic, & Čater, 2015), in this case the network analysis obtained using Ucinet (Borgatti et al., 2013).
Bibliographic coupling uses a similar co-occurrence matrix, in this case with the articles that shared references. The procedure is equivalent to that presented for cocitation, but in this case, to cut the sample we restrict the articles using the number of ties with the help of Ucinet network software. As a hypothetic example, suppose you have a sample of 160 documents. Examining them using the
1 It is important to note that the cross-loadings of the EFA
are important to the interpretation of the results regarding the influence of one factor on another.
network software, you maintain the documents with at least seven couplings (ties 7). If this results in a matrix of 70 documents, it would represent a high percentage of the total sample, and would be well represented graphically, enabling reading and content analysis together with the EFA.
For both co-citation and bibliographic coupling, we must name and present the factors through a detailed analysis of the works’ content. The argument for each factor must present the central idea that the group of references is representing. We suggest following the recommendations of Denyer and Tranfield (2009) for systematic literature reviews.
SCRIPT FOR COCITATION AND
BIBLIOGRAPHIC COUPLING
BIBLIOMETRIC STUDIES2
Through this script, we now present the suggested procedures for preparing cocitation and bibliographic bibliometric studies. This script is reproduced in Portuguese in Appendix 1 of this editorial comment.
To begin, it is necessary to download the Bibexcel software from the following link:
http://homepage.univie.ac.at/juan.gorraiz/bibexcel/i ndex.html
Bibexcel is an extractor software. It extracts from your sample the desired information using SSCI abbreviation (check Table 3 in Step 3). The software only runs in MS Windows. It will only extract the first author of the works.
Step 1 – WEB OF SCIENCE (WoS) or Scopus Access, considering Brazil, through the CAPES portal or other option available in your school’s digital library.
o Select data base / WoS or Scopus Search
o Select the field you are going to search:
Options: topic, author; group of authors, editor, name of the publication, DOI, year of publication, address.
“topic”: search for the keyword in the title, abstract and KW.
o Insert words for search.
2 This script was prepared by Luiz Guerrazzi and
_______________________________
Boleans (And, Or, Not). “*” in the keyword:
enables a search for all variations of the word using the asterisk. o Select the limits of the search.
Time frame; Data bases; Field of study; Type of document. Step 2 – Options for refining results
Options: research areas, types of documents, authors, editors, source title, conference title, year of publication, idioms, countries/regions, impact factor (WoS - JCR).
Step 3 – Save the search
Identifying the selected articles. Click on “Add to the marked list”, then follow one of the options:
a. Mark individually (frame in front of each article) or
b. “All pages” (frame in the top, the left of the page), or
c. Specify the register to be sent.
Observe the field “marked list” to the quantity of the register selected.
d. Registers with already in the list.
e. There are no duplications of loading for specific load of “marked list”.
Click on “marked list”:
f. Select “Main collection of WoS”; g. Verify if the fields are marked:
i. Abstract; ii. References cited; iii. Keywords;
iv. Allow the remaining marked.
Export the registers:
h. Select “send by e-mail”;
i. Inform the address in the field “Up to”.
j. Describe the search in “notes”. k. It is only possible to send 500
articles at a time.
Table 3 - Legend of the generated file (SSCI pattern – Social Science Citation Index)
FN File Name NR Cited Reference Count
VR Version Number TC Web of Science Core Collection Times
Cited Count PT Publication Type (J=Journal; B=Book;
S=Series; P=Patent) Z9
Total Times Cited Count (WoS Core, BCI, and CSCD)
AU Authors PU Publisher
AF Author Full Name PI Publisher City
BA Book Authors PA Publisher Address
BF Book Authors Full Name SN International Standard Serial Number
(ISSN)
CA Group Authors EI Electronic International Standard Serial
Number (eISSN)
GP Book Group Authors BN International Standard Book Number
(ISBN)
BE Editors J9 29-Character Source Abbreviation
TI Document Title JI ISO Source Abbreviation
SO Publication Name PD Publication Date
SE Book Series Title PY Year Published
BS Book Series Subtitle VL Volume
LA Language IS Issue
_______________________________
CT Conference Title PN Part Number
CY Conference Date SU Supplement
CL Conference Location MA Meeting Abstract
SP Conference Sponsors BP Beginning Page
HO Conference Host EP Ending Page
DE Author Keywords AR Article Number
ID Keywords Plus® DI Digital Object Identifier (DOI)
AB Abstract D2 Book Digital Object Identifier (DOI)
C1 Author Address PG Page Count
RP Reprint Address P2 Chapter Count (Book Citation Index)
EM E-mail Address WC Web of Science Categories
RI Researcher ID Number SC Research Areas
OI ORCID Identifier (Open Researcher and
Contributor ID) GA Document Delivery Number
FU Funding Agency and Grant Number UT Accession Number
FX Funding Text ER End of Record
CR Cited References EF End of File
Source: Web of Science Core Collection Field Tags
4. Procedure – Bibexcel
Copy the generated file from the e-mail, selecting from PT J up to EF and paste into the software notepad;
i. Always begin with PT J and finish with ER. The selection ends with EF.
ii. There is no space at the end between ER and EF (remove the blank line).
Save with name up to 15 letters (.txt); Pattern ANSI;
Create a file .xlsx for future enquiry; In searches with more than 500
articles, the resulting files must be integrated as follows, example for a search with 1,500 articles:
i. Archive 1 (from article 1 to 500) the letter EF to the end of the file must be erased; ii. Archive 2 (from 501 to 1000)
the content must be pasted at the end of Archive 1. Erase the letters EF at the end; iii. Archive 3 (1001 to 1500)
paste the content at the end of Archive 1;
5. Bibexcel (to Scopus see Note 3)
All the files generated by Bibexcel are compatible with Excel.
Open Bibexcel;
In the box “Select file here” click on the .txt file (step 4) and then on “View file”;
Visualize the content in the box “The list”;
Go to “Misc” on the upper side command bar:
i. “Convert to dialog...”; ii. Click on “Convert from Web
of Science”;
iii. Click on “Plain text”, OK, YES;
iv. A .doc file is generated, as shown in the box “The box”; Select the generated .doc file and click
on “View file”;
Insert in “Old tag” the legend referring to the field to be selected (for the searches in citation and cocitation, CD (usual) or CR, depending of the field in .doc);
Any other tag may be inserted at “Old tag”, depending on what we wish to extract from the sample. So: AU to
_______________________________
authors, SO to journals and PY year of publication, etc.
In “Select field to be analyzed...”, opt for “Any; separate field”, then click on “Prep”, then on OK and Yes.
i. The .out file will be generated (list of references by article for all the sample)
ii. .out to .1st – edit out files > keep only authors first initial iii. .1st to .low – edit out files >
convert upper lower case > good for cited references strings
At the field “Frequency distribution” mark “Sort descending”.
i. At the white bar select the option “Whole string”; ii. Click on “Start” and OK; iii. The .cit file will be generated; iv. The .cit file must be used for
citation analysis.
Select the .cit file and click on “View file”.
i. In “The list” will appear the content of the archive with the frequency of occurrence of the information required in descending order;
ii. .cit correction – see Note 1. This correction must be made. iii. Cocitation and bibliographic
coupling? a. Cocitation: go to 6.1; b. Bibliographi c coupling: go to 6.2 6. Cocitation and bibliographic coupling
analysis.
6.1 Generation of the cocitation matrix
In the box “The list”, select the .cit file (already corrected), the sample that will be used in the matrix – the amount of lines and columns of the square matrix.
i. Go to “Analyze” on the upper side bar;
ii. Then in “Co-ocurrence”, click on “Select units via listbox”; Select the .low file, but do not click on
“View file”.
i. Go to “Analyze” on the upper side bar;
ii. Then in “Co-ocurrence”, click on “Make pairs via listbox”;
iii. A dialog box will appear, click on NO and on OK. iv. A .coc file will be created; “View file” of .coc file
i. In “Analyze” on the upper side bar, click on “List units in pairs”;
ii. In the dialog box, select OK; iii. A .ccc will be created; “View file” of .ccc file;
Select the .coc file, but do not click on “View file”;
i. In “Analyze” on the upper side bar, click on “Make a matrix for MDS etc”;
ii. In the dialog boxes, click sequentially on: 1. OK 2. NO 3. YES 4. YES 5. NO 6. Finally, on OK iii. The .ma2 is generated. This is
the cocitation matrix that will be used in Excel. Sums of lines and columns: individual frequency of cocitation. iv. The crossing of line and
column represents the counting of co-occurrences. v. This file is a symmetric
matrix with a null diagonal. vi. The value represents the
frequency of co-citation between the woks in a determined line and column. vii. The .ma2 file, in .xlsx format
(item 7) is the input for SPSS and Ucinet/Pajek.
6.2 Bibliographic coupling analysis
Select the .low file, but do not click on “View file”.
i. Go to “Analyze” on the upper side bar;
ii. In “Shared units/coupling”, click on “Shared units”; iii. A dialog box will appear,
click on NO and then on OK. iv. A .cou file will be created; “View file” of the .cou file
i. In “Analyze”, on the upper side bar, click on “List units in pairs”;
ii. In the dialog box, select OK; iii. A .ccc file will be generated; “View file” of the .ccc file;
_______________________________
Select the .cou file, but do not click on “View file”;
i. In “Analyze”, on the upper side bar, click on “Make a matrix for MDS etc”;
ii. In the dialog boxes, click sequentially on: 1. OK 2. NO 3. YES 4. YES 5. NO 6. Finally, on OK iii. The .ma2 file is generated, the
bibliographic coupling matrix, and will be used in the Excel. Sum of lines or columns: individual frequency of bibliographic coupling. iv. This file is a symmetric
matrix with a null diagonal. v. The values represent the
frequency of bibliographic coupling between the works of a determined line and column.
vi. The .ma2 file, in .xlsx format (item 7) is the input for SPSS and Ucinet/Pajek.
7. Preparation of the bibliographic coupling matrix:
Open the .ma2 file in Excel;
Insert the column before column “A”; It is necessary to edit the labels of line
“1”, inserting the authors of the work once in the collection, the WoS only informs the first author. Only authors and year must be kept as the label for the bibliographic coupling matrix, erasing the remaining information; Select and copy line “1”;
Paste special in columns “A”, from line “1”, mark option “Transpose”;
The bibliographic coupling matrix indicates the reference sharing between articles;
Attention: the labels of the columns must be equal to the labels of the lines. The spreadsheet generated here will be
used for the procedures of multivariate statistics and to prepare the networks. Notes
1 – Correcting the .cit file (necessary)
We suggest the following process for the correction: Open the .cit file and .out in Excel; In the .cit file: select the lines
(number of citation and authors) that will be used in the research; Change the color of the cells of the
selected references (.cit file). Insert a line before Line 1 and put
Excel filter;
Classify the .cit file in alphabetical order by author (by inserting the filter or by “Data/classify/A-Z”). Analyze whether there are
occurrences not colored that should be included.
Correct the .out (or .low) file, previously ordered in alphabetical order, the same way as for the .cit file. The correction of both files must be identical. It must begin with .cit to direct the corrections to the more important references. The main motives for these occurrences are the different abbreviations for the same observations
(author/article/journal).
Return the .out and .cit to their original format – without filter and ordered by author.
Return to procedure 5 (Bibexcel). Proceed to the generation of the
new .cit, which will be created with a corrected grouping of citations/authors.
2 – General sequence
Search WoS .txt .doc .out .1st .low .cit .coc / cou .ccc .ma2 xlsx SPSS Ucinet/Pajek. Pesquisa WOS ·. Txt ···.
3 – For Scopus files, use in MISC: Convert from Scopus RIS format. Sometimes a “carriage return” is requested. It is only necessary to follow the steps indicated by Bibexcel.
4 – When the research is conducted in WoS and Scopus, the bases may be unified in the .out file. Care shout be taken with the duplication of articles and using the first column, number of order of the article to eliminate this duplicity.
5 – To use in other database, the articles should be inserted manually.
6 - Bibliometric coupling is executed without sample cutting criteria, regarding cocitation. It is necessary to pre-establish a criterion to cut the articles. This may be done using the co-occurrence matrix. We suggest the use of nodes from the
_______________________________
network, as was the case in Vogel and Güttel, 2013.
FINAL COMMENTS
In this editorial comment, we set out to share our accumulated experience in bibliometric studies. We are suggesting and presenting a script to help researchers with their bibliometric studies of
cocitation and bibliographic coupling supported by multivariate analysis, using EFA and network analysis (MDS is also included in the script). We presented fundamental information regarding the method. Despite the possibility of preparing the data for bibliometric analysis, it is important to reinforce the need to read and interpret the content. Review articles using bibliometric analysis, like any other, should be supported by strong arguments and make a contribution to the field.
_______________________________
APPENDIX 1Script for cocitation and bibliographic coupling bibliometric studies Portuguese Version
Roteiro para estudos de cocitação e pareamento bibliográfico em estudos bibliométricos
É preciso fazer o download do Bibexcel em:
http://homepage.univie.ac.at/juan.gorraiz/bibexcel/in dex.html
É um software extrator. Extrai de sua amostra os campos solicitados por meio de siglas SSCI (ver tabela abaixo).
Só roda no Windows;
Só extrai o primeiro autor de cada artigo. 1 – WEB OF SCIENCE (WoS) ou Scopus
Acessar pelo portal CAPES (biblioteca digital da Escola).
o Selecionar base de dados / WoS ou Scopus
Busca
o Selecionar em que campo realizar a pesquisa:
Opções: tópico, autor; grupo de autores, editor, nome da publicação, DOI, ano de publicação, endereço.
“topic”: busca a palavra-chave no título, abstract e KW.
o Inserir palavras para a busca.
Podem ser usados condicionantes booleanos (And, Or, Not).
“*” na palavra-chave: busca serve para todas as variações da palavra a partir do asterisco. o Selecionar limites da pesquisa.
Período;
Base de dados; Campo de estudo;
Tipo de documento. 2 – Opções para refinar resultados
Opções: áreas de pesquisa, tipos de documentos, autores, editores, títulos da fonte, título da conferência, ano de publicação, idiomas, países/territórios, fator de impacto (WoS - JCR). 3 – Salvar a pesquisa
Identificar os artigos que serão
selecionados. Clicar em “Adicionar à lista marcada”, depois seguir uma das opções:
a. Marcar individualmente (quadro à frente de cada artigo) ou
b. “Todos da página” (quadro no alto, à esquerda da página), ou
c. Especificar os registros a serem enviados. Observar campo “lista marcada” para quantidade de registros adicionados.
a. Registros com já estão na lista. b. Não há duplicação de carregamento para uma mesma carga de “lista marcada”.
Clicar em “lista marcada”:
a. Selecionar “Principal Coleção do WoS”; b. Verificar se estão marcados os campos: i.Resumo;
ii.Referências citadas; iii.Palavras chave;
iv.Deixar os demais já marcados. Exportar os registros:
a. Selecionar “enviar por email” ; b. Informar endereço no campo “Até”. c. Descrever a pesquisa em “notas”. d. Só é possível enviar 500 artigos por vez. Legenda do arquivo gerado (padrão SSCI – Social Science Citation Index)
FN File Name NR Cited Reference Count
VR Version Number TC Web of Science Core Collection Times Cited
Count PT Publication Type (J=Journal; B=Book;
S=Series; P=Patent) Z9
Total Times Cited Count (WoS Core, BCI, and CSCD)
AU Authors PU Publisher
AF Author Full Name PI Publisher City
BA Book Authors PA Publisher Address
BF Book Authors Full Name SN International Standard Serial Number (ISSN)
CA Group Authors EI Electronic International Standard Serial
Number (eISSN)
_______________________________
BE Editors J9 29-Character Source Abbreviation
TI Document Title JI ISO Source Abbreviation
SO Publication Name PD Publication Date
SE Book Series Title PY Year Published
BS Book Series Subtitle VL Volume
LA Language IS Issue
DT Document Type SI Special Issue
CT Conference Title PN Part Number
CY Conference Date SU Supplement
CL Conference Location MA Meeting Abstract
SP Conference Sponsors BP Beginning Page
HO Conference Host EP Ending Page
DE Author Keywords AR Article Number
ID Keywords Plus® DI Digital Object Identifier (DOI)
AB Abstract D2 Book Digital Object Identifier (DOI)
C1 Author Address PG Page Count
RP Reprint Address P2 Chapter Count (Book Citation Index)
EM E-mail Address WC Web of Science Categories
RI ResearcherID Number SC Research Areas
OI ORCID Identifier (Open Researcher and
Contributor ID) GA Document Delivery Number
FU Funding Agency and Grant Number UT Accession Number
FX Funding Text ER End of Record
CR Cited References EF End of File
Fonte: Web of Science Core Collection Field Tags
8. Procedimentos – Bibexcel
Copiar arquivo gerado do email, selecionando de PT J até EF e colar no programa bloco de notas;
i.Sempre deve iniciar com PT J e terminar com ER. A seleção toda termina com EF.
ii.Não há espaço no final entre ER e EF (remover a linha em branco).
Salvar com nome de até 15 letras (.txt);
Formato ANSI;
Criar um arquivo .xlsx para futuras consultas (ver meu modelo);
Em pesquisas com mais de 500 artigos os arquivos resultantes devem ser integrados do seguinte modo, exemplo para pesquisa com 1500 artigos:
i.No arquivo 1 (do artigo 1 ao 500) as letras EF ao fim do arquivo devem ser apagadas;
ii.No arquivo 2 (do 501 ao 1000) o conteúdo deve ser colado ao final do arquivo 1. Apagar as letras EF do final;
iii.No arquivo 3 (1001 a 1500) colar conteúdo no final do arquivo 1;
9. Bibexcel (para Scopus ver nota 5)
Todos os arquivos gerados pelo Bibexcel são compatíveis com o excel.
Abrir Bibexcel;
Selecionar pasta e clicar no arquivo .txt da pesquisa (passo anterior), em seguida em “View file”;
Visualizar o conteúdo na caixa “The list”; Ir em “Misc” na barra superior de comando: i.“Convert to dialog...”;
ii.Clicar em “Convert from Web of Science”; iii.Clicar em “Plain text”, OK, SIM;
iv.Foi gerado um arquivo .doc, como mostrado na caixa “The box”;
_______________________________
Selecione o arquivo .doc gerado e clique em “View file”;
Inserir em “Old tag” a legenda referente ao campo a ser selecionado (para pesquisas em citação e co-citação, CD (mais comum) ou CR, dependendo do campo constante no .doc);
Qualquer outra sigla pode ser inserida em
“Old tag”, dependendo do que se deseje extrair da
amostra. Assim: AU para autores, SO para periódicos e PY para ano de publicação, etc.
Em “Select field to be analysed...”, optar por “Any ; separated field”, a seguir clicar em “Prep”, depois em OK e Sim.
i.Será gerado arquivo .out (relação das referências por artigo, para toda a amostra)
ii..out para .1st – edit out files > keep only authors first initial
iii..1st para .low – edit out files > convert upper lower case > good for cited references strings
No campo “Frequency distribution” marcar “Sort descending”.
i.Na barra branca selecionar a opção “Whole string”; ii.Clicar em “Start” e OK;
iii.Será gerado arquivo .cit;
iv.O arquivo .cit deve ser usado para análises de citação.
Selecionar o arquivo .cit e clicar em “View file”.
i.Em “The list” aparecerá conteúdo do arquivo com a frequência de ocorrência da informação solicitada em ordem decrescente;
ii.Correção do .cit – ver nota 1. Esta correção deve ser feita.
iii.Cocitação ou pareamento? a. Cocitação: ir para 6.1; b. Pareamento: ir para 6.2
10. Análise de cocitação e de pareamento bibliográfico (bibliographic coupling)
6.1Geração da Matriz de cocitação
Na caixa “The list”, selecionar, no arquivo .cit (já corrigido), a amostragem que fará parte da matriz – a quantidade de linhas selecionadas equivalerá às linhas e colunas da matriz quadrada. i.Ir para “Analyze” na barra superior;
ii.Depois em “Co-ocurrence”, clicar em “Select units via listbox”;
Selecionar o arquivo. low mas não clicar em “View file”.
i.Ir para “Analyze” na barra superior;
ii.Depois em “Co-ocurrence”, clicar em “Make pairs via listbox”;
iii.Aparecerá uma caixa de diálogo, clicar em NÃO e, em seguida, em OK.
iv.Será criado um arquivo. coc;
“View file” do arquivo .coc
i.Em “Analyze” na barra superior, clicar em “List units in pairs”;
ii.Na caixa de diálogo, selecione OK; iii.Será gerado um arquivo .ccc;
“View file” do arquivo .ccc;
Selecionar o arquivo .coc mas não clicar em “View file”;
i.Em “Analyze” na barra superior, clicar em “Make a matrix for MDS etc”;
ii.Nas caixas de diálogo, clicar sucessivamente em:
1. OK 2. NÃO 3. SIM 4. SIM 5. NÃO 6. Finalmente em OK
iii.Gerado arquivo .ma2, matriz de cocitação e será utilizada no Excel. Somatória das linhas ou colunas: frequência individual de cocitação.
iv.Cruzamento linha e coluna representa a contagem de coocorrências.
v.Este arquivo é uma matriz simétrica com diagonal nula.
vi.Valores representam a frequência de cocitação entre os trabalhos de determinada linha e coluna.
vii.O arquivo .ma2, em formato .xlsx (item 7) é o input para o SPSS e Ucinet/Pajek.
6.2 Análise de pareamento bibliográfico
Selecionar o arquivo. low mas não clicar em “View file”.
i.Ir para “Analyze” na barra superior;
ii.Depois em “Shared units / coupling”, clicar em “Shared units”;
iii.Aparecerá uma caixa de diálogo, clicar em NÃO e, em seguida, em OK.
iv.Será criado um arquivo. cou; “View file” do arquivo .cou
i.Em “Analyze” na barra superior, clicar em “List units in pairs”;
ii.Na caixa de diálogo, selecione OK; iii.Será gerado um arquivo .ccc;
“View file” do arquivo .ccc;
Selecionar o arquivo .cou mas não clicar em “View file”;
i.Em “Analyze” na barra superior, clicar em “Make a matrix for MDS etc”;
ii.Nas caixas de diálogo, clicar sucessivamente em:
1. OK 2. NÃO 3. SIM 4. SIM 5. NÃO 6. Finalmente em OK
_______________________________
iii.Gerado arquivo .ma2, matriz de pareamento e será utilizada no Excel. Somatória das linhas ou colunas: frequência individual de co-ocorrência.
iv.Este arquivo é uma matriz simétrica com diagonal nula.
v.Valores representam a frequência de pareamentos entre os trabalhos de determinada linha e coluna. vi.O arquivo .ma2, em formato .xlsx (item 7) é o input
para o SPSS e Ucinet/Pajek.
11. Preparo da matriz de co-ocorrência (cocitação ou pareamento)
Abrir o arquivo .ma2 no Excel; Inserir coluna antes da coluna “A”;
Necessário editar os rótulos da linha “1”, inserindo autores do trabalho uma vez que, na coleta, o WoS apenas informa o primeiro autor. Deve ser mantido apenas autores e ano como rótulo para a matriz de cocitação, apagando demais informações;
Selecionar e copiar toda a linha “1”; Colar especial na coluna “A”, a partir da linha “1”, marcar a opção “Transpor”;
Numa pesquisa de cocitação, a matriz indica quantidade de citações por par de autores; Atenção: rótulos das colunas devem ser iguais aos das linhas.
A planilha gerada aqui deve ser usada para os procedimentos de estatística multivariada e para a elaboração de redes relacionais.
Notas
1 – Correção do arquivo .cit (necessária) Abaixo, o modo que recomendo para a correção. Abrir arquivo .cit e .out no Excel;
No .cit: selecionar linhas (número de citações e autores) com que a pesquisa seguirá; Mudar cor das células que foram as referências selecionadas (no arquivo .cit).
Inserir linha antes da linha 1 e colocar filtro do excel;
Classificar o arquivo .cit em ordem alfabética por autor (por meio da inserção de filtro ou por “Dados/classificar/A-Z”).
Analisar se há ocorrências não coloridas que deveriam estar contidas nas observações coloridas.
Corrigir o arquivo .out (ou .low), já previamente ordenado em ordem alfabética, da mesma forma que feito no .cit. As correções em ambos os arquivos devem ser idênticas. Inicia-se com o .cit para direcionar as correções para as referências mais importantes. Principais motivos dessas ocorrências são abreviaturas diferentes para mesmas observações (autor/artigo/journal).
Voltar o .out e o .cit para seu formato original – sem filtro e ordenado por artigo.
Voltar para o procedimento 5 (Bibexcel). Prosseguir para geração de novo .cit, que será criado com agrupamento corrigido de citações/autores.
2 – Sequência geral
Pesquisa WoS .txt .doc .out .1st .low .cit .coc / cou .ccc .ma2 xlsx SPSS Ucinet/Pajek. Pesquisa WOS ·. Txt ···.
3 – Para arquivos do Scopus, usar em MISC: Convert from scopus RIS format. Em algumas vezes é solicitado para incluir “carriadge return”, basta seguir os passos que o Bibexcel indica.
4 – Caso a pesquisa seja feita no WoS e Scopus, as bases podem ser unificadas no arquivo .out, tomando cuidado com a duplicidade de artigos e usando a primeira coluna, número de ordem do artigo para a eliminação dos duplicados.
5 – Desconheço a viabilidade para outras bases de dados.
6 - O pareamento é executado sem o critério de corte nas citações como na cocitação. Portanto, é necessário estabelecer um critério para corte das referências (artigos). Pode ser feito usando a matriz de coocorrência. Sugerimos a utilização uso número de laços e de nós, como Vogel e Güttel, 2013.
_______________________________
REFERENCESCharvet, F., Cooper, M., & Gardner, J. (2008). The intellectual structure of supply chain management: A bibliometric approach. Journal
of Business Logistics, 29(1), 47-73.
Denyer, D., & Tranfield, D. (2009). Producing a systematic review. In D. A. Buchanan & A. Bryman (Eds.), The Sage Handbook of
Organizational Research Methods (pp.671-689).
Thousand Oaks, CA: Sage Publications Ltd. Ferreira, M., Pinto, C. & Serra, F. (2014). The transaction costs theory in international business research: a bibliometric study over three decades.
Scientometrics 98(3), 1899-1922. doi:
10.1007/s11192-013-1172-8
Grégoire, D. A., Noel, M. X., Déry, R., & Béchard, J. P. (2006). Is there conceptual convergence in entrepreneurship research? A co‐citation analysis of frontiers of
entrepreneurship research, 1981–2004.
Entrepreneurship Theory and Practice, 30(3),
333-373.
Lin, T. Y., & Cheng, Y. Y. (2010). Exploring the knowledge network of strategic alliance
research: A co-citation analysis. International
Journal of Electronic Business Management, 8(2), 152-160.
McCain, K. W. (1990). Mapping authors in intellectual space: A technical overview. Journal
of the American Society for Information Science, 41(6), 433.
Nath, R., & Jackson, W. M. (1991). Productivity of management information systems researchers: does Lotka's law apply? Information Processing
& Management, 27(2-3), 203-209.
Nerur, S., Rasheed, A., & Natarajan, V. (2008). The intellectual structure of the strategic management field: An author co-citation analysis. Strategic Management Journal, 29(3), 319–336.
Paré, G.; Trudel, M.; Jaana, M. & Kitsiou, S. (2015). Synthesizing information systems knowledge: A typology of literature reviews.
Information & Management, 52(2), 183–199.
Persson, O., Danell, R., & Schneider, J. 2009. How to use Bibexcel for various types of bibliometric analysis. In Celebrating scholarly communication studies: A Festschrift for Olle Persson at his 60th Birthday, ed. F. Åström, R. Danell, B. Larsen, J. Schneider, p 9–24. Leuven, Belgium: International Society for
Scientometrics and Informetrics.
Phelan, S., Ferreira, M., & Salvador, R. (2002). The first twenty years of the Strategic
Management Journal. Strategic Management
Journal, 23(12), 1161-1168. doi:
10.1002/smj.268.
Pilkington, A. (2006). Bibexcel–Quick Start Guide to Bibliometrics and Citation Analysis. Ramos‐Rodríguez, A. R., & Ruíz‐Navarro, J. (2004). Changes in the intellectual structure of strategic management research: A bibliometric study of the Strategic Management Journal, 1980–2000. Strategic Management
Journal, 25(10), 981-1004.
Shafique, M. (2013). Thinking inside the box? Intellectual structure of the knowledge base of innovation research (1988–2008). Strategic
Management Journal, 34, 62–93.
Vogel, R., & Güttel, W. H. (2013). The dynamic capability view in strategic management: a bibliometric review. International Journal of
Management Reviews, 15(4), 426-446.
White, H. D., & Griffith, B. C. (1981). Author co-citation: A literature measure of intellectual structure. Journal of the Association for
Information Science and Technology, 32(3),
163-171.
White, H. D., & McCain, K. W. (1998). Visualizing a discipline: An author co-citation analysis of information science,
1972-1995. Journal of the American Society for
Information Science, 49(4), 327-355.
Zupic, I., & Čater, T. (2015). Bibliometric methods in management and organization. Organizational Research