Evaluation of photoperiod effect on the growth and protein
content of microalgae
Inês Soraia Hipólito Pedro
Evaluation of photoperiod effect on the growth and protein
content of microalgae
Inês Soraia Hipólito Pedro
Dissertação para obtenção do Grau de Mestre em Biotecnologia dos Recursos Marinhos
Dissertação realizada sob a coorientação do Doutor Sérgio Leandro e orientação da Doutora Alexandra Cruz
i Título: Evaluation of photoperiod effect on the growth and protein content of microalgae Copyright© Inês Soraia Hipólito Pedro
Escola Superior de Turismo e Tecnologia do Mar – Peniche Instituto Politécnico de Leiria 2015
A Escola Superior de Turismo e Tecnologia do Mar e o Instituto Politécnico de Leiria têm o direito, perpétuo e sem limites geográficos, de arquivar e publicar este trabalho de projeto através de exemplares impressos reproduzidos em papel ou de forma digital, ou por qualquer outro meio conhecido ou que venha a ser inventado, e de a divulgar através de repositórios científicos e de admitir a sua cópia e distribuição com objetivos educacionais ou de investigação, não comerciais, desde que seja dado crédito ao autor e editor.
iii
Agradecimentos
Quero agradecer a todas as pessoas que permitiram a concretização deste trabalho ao longo deste ano, no âmbito do Mestrado em Biotecnologia dos Recursos Marinhos. A todos, deixo aqui o meu sincero agradecimento.
Mais especialmente:
À Professora Doutora Alexandra Cruz, orientadora e amiga, um sincero obrigado.
Ao Professor Doutor Sérgio Leandro, coorientador, por todo o apoio ao longo do trabalho.
À Susete Pinteus, Joana Silva e Celso Alves pela ajuda e apoio em momentos chave do trabalho.
À Kelly Veiga, o meu muito obrigado pelo apoio e preocupação constantes ao longo deste ano.
À Mestre Catarina Rosado Correia por todo o apoio, ajuda, disponibilidade, amizade e conhecimentos transmitidos. O meu profundo agradecimento!
A todas as pessoas que diretamente ou indiretamente me apoiaram neste percurso.
Ao Fábio, por todo o apoio e paciência ao longo destes dois anos de mestrado.
Aos meus pais, Vitor e Raquel Pedro, que estiveram comigo ao longo de todo o meu percurso académico, apoiando-me sempre incondicionalmente em todas as etapas.
v
Resumo:
Os recursos renováveis têm recebido um especial interesse nos últimos anos e as microalgas são uma excelente fonte renovável e natural. Estes organismos são fonte de proteínas e lípidos e são aplicadas em aquacultura e na produção de biodiesel.
Neste estudo, foi avaliado o efeito do fotoperíodo (Luz: Escuro) 12:12; 18:6; 24:0) e fase de crescimento (logarítmica e estacionária) no conteúdo de proteína em três sistemas modelo biológico: Arthrospira maxima (Cyanobacteria) foi selecionada como espécie de água doce a estudar e para explorar microalgas marinhas foram escolhidas Isochrysis
galbana (Haptophyta) e Tetraselmis chuii (Chlorophyta) devido às suas aplicações em
aquacultura marinha. Diferentes métodos de rutura celular foram também testados na extração de proteína em fase aquosa.
Arthrospira maxima exibiu melhor produção de biomassa e conteúdo de proteína no
fotoperíodo de 18L:6D. O mesmo fotoperíodo também atingiu melhor produção de biomassa e conteúdo de proteína em Isochrysis galbana quando comparado com os outros fotoperíodos em estudo. Tetraselmis chuii exibiu melhor produção de biomass no fotoperíodo de 24L:0D, enquanto que o fotoperíodo 18L:6D atingiu melhor conteúdo de proteína.
Palavras-chave:
Arthrospira maxima; Isochrysis galbana; Tetraselmis chuii; Fotoperíodo; Proteína; Métodos de rutura.vi
Abstract:
Renewal resources have received special interest in the last years and microalgae are an excellent natural source of it. This organisms contain protein and lipid, becoming a great resource of it and can be applied in aquaculture and biodiesel production.
In this study, the effect of photoperiod regime and growth phase (logarithmic and stationary) was evaluated (Light:Dark 12:12; 18:6; 24:0) on the protein content of three biological model systems: Arthrospira maxima (Cyanobacteria) selected as freshwater specie to study and Isochrysis galbana (Haptophyta) and Tetraselmis chuii (Chlorophyta) – chosen to explore marine microalgae due to their application on marine aquaculture. Different cell disruptor methods were also tested on protein extractability in water.
Arthrospira maxima exhibits higher biomass production and protein content at
18L:6D photoperiod regime. The same photoperiod also achieved better production and protein content in Isochrysis galbana when compared with the others photoperiods in study.
Tetraselmis chuii exhibits better biomass production at 24L:0D photoperiod, while 18L:6D
photoperiod achieved better protein content.
Key-words:
Arthrospira maxima; Isochrysis galbana; Tetraselmis chuii; Photoperiod; Protein; Disruption methods.vii
Índex
Chapter 1: Introduction... 1
1.1 Microalgae ... 1
1.2 Growth conditions and production systems ... 2
1.2.1 Culture Parameters ... 3
1.2.2 Outdoor Ponds ... 4
1.2.3 Closed Systems... 5
1.3 Harvesting of microalgae biomass ... 6
1.4 Cell disruption methods ... 6
1.5 Microalgae metabolites with high biotechnological potential ... 8
1.5.1 Pigments ... 11
1.5.2 Lipids ... 13
1.5.3 Polysaccharides... 16
1.5.4 Bioplastics ... 17
1.5.5 Proteins ... 17
1.5.6 The market of microalgae metabolites ... 18
1.6 Microalgae species with biotechnological potential... 21
1.6.1 Arthrospira maxima ... 21
1.6.2 Isochrysis galbana ... 23
1.6.3 Tetraselmis chuii ... 25
Chapter 2: Objectives ... 27
2.1 Objectives ... 27
Chapter 3: Materials and Methods ... 29
3.1 Growth and biomass production ... 29
3.1.1 Growth measurement ... 29
3.1.2 Biomass quantification ... 32
3.1.3 Sample collection and storage ... 32
3.2 Cell disruption methods ... 33
3.3 Protein content analysis ... 33
3.3.1 Protein Precipitation ... 33
3.3.2 Lowry Method (Lowry et al. 1951) ... 34
3.4 Statistical analysis ... 34
Chapter 4: Results ... 35
viii
4.1.1 Arthrospira maxima ... 35
4.1.2 Isochrysis galbana ... 38
4.1.3 Tetraselmis chuii ... 42
4.2 Cell disruption methods ... 47
4.3 Protein content... 48
Chapter 5: Discussion ... 51
Chapter 6: General conclusions and final remarks ... 55
Chapter 7: References ... 57
Appendix ... 67
Appendix 1 - Zarrouk’s Medium Composition (Zarrouk, 1966) ... 67
Appendix 2 - f/2 Medium Composition (Gillard, 1975) ... 67
Appendix 3 – Bovine serum albumin standard curve ... 68
Appendix 4 - Cell disruption method. One Way Analysis of Variance. All Pairwise Multiple Comparison Procedures (Holm-Sidak method): Overall significance level = 0.05 ... 68
Appendix 5 - Protein content Two Way Analysis of Variance. All Pairwise Multiple Comparison Procedures (Holm-Sidak method): Overall significance level = 0.05 ... 69
ix
Figure Index
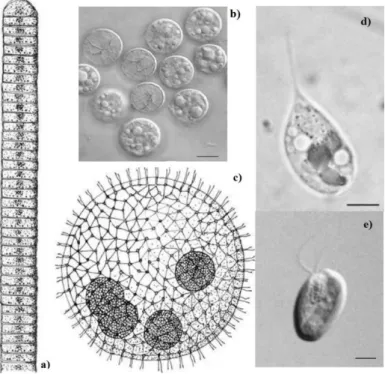
Figure 1 Examples of microalgae diversity: a) Simple filament of Oscillatoria sp.; b) Cells of Prochloron sp. (Bar: 10 µm.); c) Motile coenobium of Volvox aureus; d) Ochromonas sp., motile
unicell. (Bar: 4 µm.); e) Unicell of Cryptomonas sp. (Bar: 6 µm.) (Barsanti and Gualtieri, 2006). .. 1
Figure 2 Different types of photobioreactors (Barsanti and Gualtieri, 2014). ... 5
Figure 3 Chemical structure of β-carotene (Dewapriya and Kim, 2014). ... 11
Figure 4 Chemical structure of Asthaxanthin (Koller et al., 2014). ... 12
Figure 5 Chemical structure of fucoxanthin (Dewapriya and Kim, 2014). ... 12
Figure 6 Chemical structure of Eicosapentaenoic acid (EPA) [(5Z,8Z,11Z,14Z,17Z)-5,8,11,14,17-icosapentaenoic acid] (Koller et al., 2014)... 14
Figure 7 Chemical structure of Docosahexaenoic acid (DHA) [(4Z,7Z,10Z,13Z,16Z,19Z)-docosa-4,7,10,13,6,19-hexaenoic acid] (Koller et al., 2014). ... 14
Figure 8 Chemical structure of Arachidonic acid (ARA) [(5Z,8Z,11Z,14Z)-5,8,11,14-Eicosatetraenoic acid] (Koller et al., 2014). ... 14
Figure 9 Chemical structure of γ-Linolenic acid (GLA) [all-cis-6,9,12-octadecatrienoic acid] (Koller et al., 2014). ... 15
Figure 10 Arthrospira maxima (Adapted from Setchell and Gardner, 1917) ... 22
Figure 11 Isochrysis galbana (x 5000.): a) chromatophore; b) leucosin; c) nucleus; d) oil globule; e) stigma (Adapted from Parke, 1949). ... 24
Figure 12 Tetraselmis chuii (x 1000) (Adapted from UTEX – University of Texas at Austin). ... 25
Figure 13 Dry weight (mg.L-1) variation of Arthrospira maxima along the culture period (symbols and bars represents average value ± standard deviation). ... 35
Figure 14 Calibration curve for Arthrospira maxima obtained from the linear regression between biomass dry weight and optical density (λ=441nm). ... 36
Figure 15 Arthrospira maxima biomass dry weight (mg.L-1) evolution along the cultivation period (symbols and bars represents average value ± standard deviation): A) 12L:12D photoperiod; B) 18L:6D photoperiod; C) 24L:0D photoperiod. ... 37
Figure 16 Cell density (cell.mL-1) variation of Isochrysis galbana along the culture period (symbols and bars represents average value ± standard deviation). ... 38
Figure 17 A) Calibration curve for Isochrysis galbana given by the linear regression between cell density and optical density (λ=440nm). B) Calibration curve for Isochrysis galbana given by the linear regression between biomass dry weight and optical density (λ=440nm). ... 39
Figure 18 Cell density (cell.mL-1) variation of Isochrysis galbana along the cultivation period (symbols and bars represents average value ± standard deviation): A) 12L:12D photoperiod; B) 18L:6D photoperiod; C) 24L:0D photoperiod. ... 40
Figure 19 Isochrysis galbana biomass dry weight (mg.L-1) evolution along the culture period (symbols and bars represents average value ± standard deviation): A) 12L:12D photoperiod; B) 18L:6D photoperiod; C) 24L:0D photoperiod. ... 41
Figure 21 A) Calibration curve for Tetraselmis chuii given by the linear regression between cell density and optical density (λ=433nm). B) Calibration curve for Tetraselmis chuii given by the linear regression between biomass dry weight and optical density (λ=433nm). ... 43
Figure 23 Biomass dry weight (mg.L-1) variation of Tetraselmis chuii along the culture period (symbols and bars represents average value ± standard deviation): A) 12L:12D photoperiod; B) 18L:6D photoperiod; C) 24L:0D photoperiod. ... 45 Figure 24 Protein content (µg (protein)-1 g (wet biomass). L) in each rupture method: 1) Control
x
maxima B) Isochrysis galbana C) Tetraselmis chuii. Values represent an average value ± standard deviation through time in culture. ... 47 Figure 25 Protein content [µg(protein)-1 g (wet biomass)] for each photoperiod and growth phase in
A) Arthrospira maxima; B) Isochrysis galbana; C) Tetraselmis chuii. Values represent an average
xi
Table Index
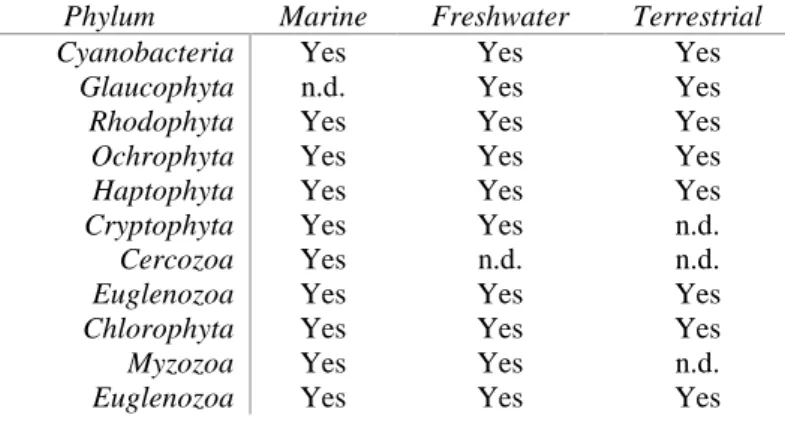
Table 1 Distribution of microalgae divisions. n.d., not detected. (Adapted from Barsanti and
Gualtieri, 2014) ... 2
Table 2 Microalgae cell disruption methods: advantages and disadvantages. ... 7
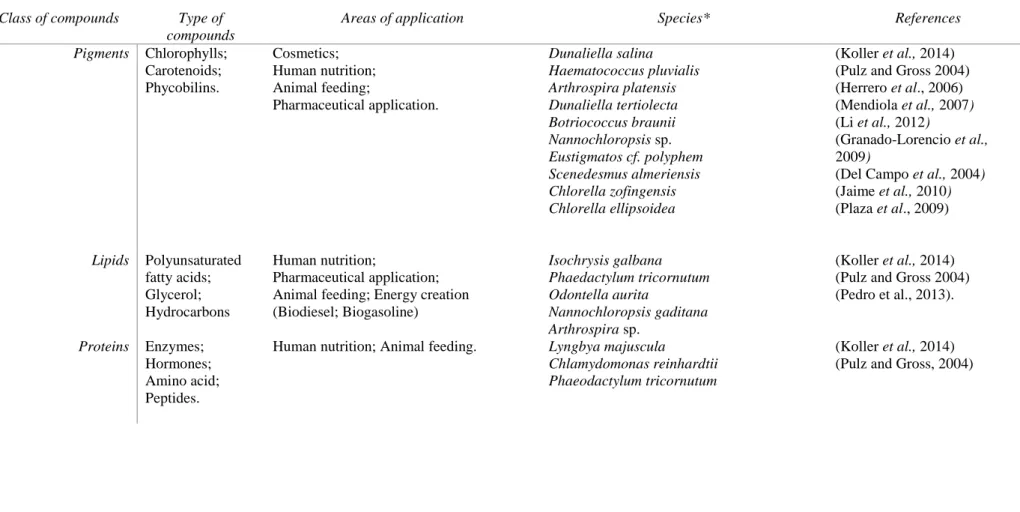
Table 3 Products synthesized by microalgae and areas of application. * Microalgae species with high relevance for biotechnological applications. ... 9
Table 4 Microalgae as healthy ingredients and companies that produces them. Adapted from Pulz and Gross, 2004. ... 19
Table 5 Global market of added value compounds from microalgae ( 1 Pulz and Gross, 2004; 2 -Markou and Nerantzis, 2013 ... 20
Table 6 Taxonomy of Arthrospira maxima (Guiry and Guiry, 2015). ... 21
Table 7 Taxonomy of Isochrysis galbana (Guiry and Guiry, 2015). ... 23
Table 8 Taxonomy of Tetraselmis chuii (Guiry and Guiry, 2015). ... 25
Table 9 Days in culture of logarithmic phase for Isochryisis galbana and Tetraselmis chuii. ... 30
Table 10 Wavelenght (nm) in which each microalgae presented higher absorbance. ... 31
Table 11 Growth parameter P daily biomass productivity of Arthrospira maxima when exposed to different photoperiods (12L:12D, 18L:6D and 24L:0D). Letters represent statistical differences between treatments: a statistically significant difference [(p<0,050) (Holm-Sidak)]. ... 36
Table 12 Wet biomass production of Arthrospira maxima when exposed to different photoperiods (12L:12D, 18L:6D and 24L:0D). Letters represent statistical differences between treatments: a statistically significant difference [(p<0,050) (Dunn’s method)]. ... 38
Table 13 Growth parameters (specific growth rate, µ; doubling time, td; P daily biomass productivity) of Isochrysis galbana when exposed to different photoperiods (12L:12D, 18L:6D and 24L:0D). Letters represent statistical differences between treatments: a statistically significant difference [(p<0,050) (Tukey)]; b statistically significant difference [(p<0,050) (Holm-Sidak)]. ... 40
Table 14 Fresh wet production of Isochrysis galbana when exposed to different photoperiods (12L:12D, 18L:6D and 24L:0D). Letters represent statistical differences between treatments: a;b statistically significant difference [(p<0,050) (Holm-Sidak)]; c;d statistically significant difference [(p<0,050) (Tukey)]. ... 42
Table 15 Average growth parameters (specific growth rate, µ; doubling time, td; P daily biomass productivity) of Tetraselmis chuii when exposed to different photoperiods (12L:12D, 18L:6D and 24L:0D). Letters represent statistical differences between treatments: a statistically significant difference [(p<0,050) ((Holm-Sidak))]; b statistically significant difference [(p<0,050) (Tukey)]. 44 Table 16 Wet biomass extraction of Tetraselmis chuii when exposed to different photoperiods (12L:12D, 18L:6D and 24L:0D). Letters represent statistical differences between treatments: a;b statistically significant difference [(p<0,050) (Holm-Sidak)]. ... 46
Table 17 Protein content [µg(protein)-1 g (wet biomass)] in each cell disruption method. ... 48
xiii
Equation índex
Equation 1 Specific growth rate equation, where x refers to the cell density (cell.ml-1), x
0 initial cell density (cell.ml-1), μ the specific growth rate (day-1) and t the time (days). ... 30
Equation 2 Cultures doubling time (td), where μ represents the specific growth rate. ... 31 Equation 3 Dry weight (g.L-1) estimate, where Xf is dry weight after a 72h drying (g), Xi is filter
weight prior filtration (g) and VF refers to volume filtered (mL). ... 32 Equation 4 Volumetric biomass productivity (g.L-1.day-1), where Xi refers to initial dry biomass
xv
Abbreviations list
ARA Arachidonic acid
BCAA Branched chain amino acid BHA Butylated hydroxyanisole BHT Butylatedhydroxytoluene DHA Docosahexaenoic acid DNA Deoxyribonucleic acid
EFSA European Food Safety Authority EPA Eicosapentaenoic acid
EPS Extracellular polysaccharide f/2 Guillard’s medium
GC Gas chromatography
GLA γ-Linolenic acid
IgG Immunoglobulin G
O.D. Optical density
OP Open system
P Volumetric biomass productivity PBR Photobioreactor
PG Propyl gallate
PHAs Polyhydroxyalkanoates PHB Poly-β-hydroxybutyrate PHR Pulse height resolution PUFAs Polyunsaturated fatty acids r2 coefficient of determination
rpm Rotations per minute
SFC Supercritical fluid chromatography sPS Sulphate containing exopolysaccharide
t Time
TBHQ tert-Butylhydroquinone TCA Trichloroacetic acid
td Doubling time
UV/Vis Ultraviolet-visible spectral region Δt Time variation
1
Chapter 1: Introduction
1.1 Microalgae
Microalgae are a diverse group with over 50.000 different species. They can be unicellular, free-living or live in symbiotic association with other organisms, motile (with flagella (Figure 1-d)) or non-motile, (figure 1-b) colourful and usually photoautotrophic (Lordan et al., 2011; Richmond, 2004). They can be eukaryotic (e.g. Chlorophyta) or prokaryotic (Cyanobacteria) and can be colonial with little or no cell differentiation (Figure 1- c). (Olaizola, 2003; Khattar et al., 2009; Koller et al., 2014; Bahadar and Khan, 2013). They can be found in rivers, lakes, glacial ice flows, hot springs, sea water or salt lakes (Lordan et al., 2011).
Figure 1 Examples of microalgae diversity: a) Simple filament of Oscillatoria sp.; b) Cells of Prochloron sp. (Bar: 10 µm.); c) Motile coenobium of Volvox aureus; d) Ochromonas sp., motile unicell. (Bar: 4 µm.); e) Unicell of Cryptomonas sp. (Bar: 6 µm.) (Barsanti and Gualtieri, 2006).
2 Their diversity allows them to colonize and be found in virtually any environmental condition (Table 1). The type of microalgae found in each place depends on the selective action of the chemo-physical environment and the organism’s ability to colonize a particular environment (George et al., 2014). Water may be considered the main habitat of microalgae, nevertheless microalgae can also be found on the surface of all type of soils (Olaizola, 2003; Richmond, 2004). The cyanobacteria Nostoc sp. is an example of a terrestrial organism and is frequently found in association with lichens (Merinero et al., 2015).
Table 1 Distribution of microalgae divisions. n.d., not detected. (Adapted from Barsanti and Gualtieri, 2014)
Phylum Marine Freshwater Terrestrial
Cyanobacteria Yes Yes Yes
Glaucophyta n.d. Yes Yes
Rhodophyta Yes Yes Yes
Ochrophyta Yes Yes Yes
Haptophyta Yes Yes Yes
Cryptophyta Yes Yes n.d.
Cercozoa Yes n.d. n.d.
Euglenozoa Yes Yes Yes
Chlorophyta Yes Yes Yes
Myzozoa Yes Yes n.d.
Euglenozoa Yes Yes Yes
1.2 Growth conditions and production systems
Growth conditions of microalgae culture are extremely important to obtain high yield and to control synthesis of different metabolites. Microalgae are organisms with metabolic plasticity that allows the synthesizing of compounds with high biotechnological potential manipulating physical and chemical conditions (e.g., variations in levels of protein, carbohydrate, lipids, among others) (Guedes et al., 2011; Coêlho et al., 2013). The most important parameters of microalgae growth are temperature, light, pH, salinity, aeration and nutrient quality/ quantity (Barsanti and Gualtieri, 2014).
3
1.2.1 Culture Parameters
Most microalgae cultures support temperatures of 16-27oC. Ideally the temperature should be as close as possible to the temperature that microalgae were collected. Temperatures higher than 35oC could be lethal for a several species, whereas those less than 16oC will slow down growth (Barsanti and Gualtieri, 2014).
Different microalgae have various pH needs, but generally the amplitude for microalgae species is between 7 and 9. Culture medium pH tends to increase when cell density and age of the culture increase too, due to the consumption of the CO2 (Barsanti and Gualtieri, 2014; Sayegh and Montagnes, 2011).
Marine microalgae usually are tolerant to changes in salinity. Nevertheless the salinity amplitude of the majority marine microalgae should be at 20-24 according to Barsanti and Gualtieri, 2014 and according to Muller-Feuga should be at 25-27 (Støttrup and McEvoy, 2003)
Aeration is essential in microalgae cultures since it uniforms the exposition to the light and nutrients and also avoids sedimentation and thermal stratification. Aeration should be gentle to prevent damaging cells, but strong enough to produce the above effects (Gouveia, 2011; Barsanti and Gualtieri, 2014).
Nutrient are important to obtain high yield or to control synthesis of different metabolites. The culture medium should be chosen according the natural environment and species requirement (Barsanti and Gualtieri, 2014).
As photosynthetic organisms, microalgae photoautotrophic culture depends on light intensity, spectral quality and photoperiod to produce cell biomass and secondary metabolites (Anderson, 2005). Light is the main factor affecting photosynthesis kinetics and its quantity and quality determine the amount of energy available to microalgae to conduct their metabolic activities, as microalgae absorb light from the different wavelengths at unequal rates (Richmond, 2004).
Light intensity needed depends of the density and depth of culture and at higher depths and cell concentration, it must be increased. This phenomena is even more obvious in green microalgae cultures, which have higher chlorophyll content, due to the fact that this
4 pigment has a high extinction coefficient – leading to high light absorption. Then, in dense cultures, if light is too low its absorbed by the first cell layers, leaving the inner ones virtually in the dark (Anderson, 2005). To prevent this effects, light intensities frequently variety between 100 and 200 µE s-1 m-2 and light is usually provided by fluorescent lamps or by natural source (Laing, 1991).
Microalgae’s growth and photosynthetic ability can be conditioned by the amount of light provided. Cells have a light compensation point that must be balanced with their needs – when in light deficit, microalgae growth can slow down, or even cease, due to respiratory loss, however, when in light excess, growth can be so rapidly increased that the culture becomes light-saturated and a photoinhibition effect occurs. For example, under supra-optimal irradiance, pigments are reduced but under light-limiting conditions, microalgae increase the number of photosynthetic units (Richmond, 2004). To even light effects on cultures, usually microalgae are grown under different photoperiod. In this conditions, illuminations is provided in light:dark cycles, simulating what occurs in the natural environment (Laing, 1991). The changes of size of light-harvesting complexes occur at a timescale of days (Barsanti and Gualtieri, 2014; Khoeyi et al., 2012), and can actively modify the biochemical composition of the cells, since light is a source of stress (Richmond, 2004).
Reactor configuration is also an important parameter to be control. To produce microalgae at industrial scale, the photobioreactors type must be selected, depending on the type of algae in culture and on the biomass target, from two main sorts: outdoor ponds (e.g. in raceways) and closed systems (e.g. tubular reactors) (Borowitzka, 1999).
1.2.2 Outdoor Ponds
An open system (OP) is composed of a race track shaped shallow canal that is typically circulated by a paddle wheel and thus OP systems are usually referred to as raceway ponds. OP system requires minimal maintenance to operate, and has low investment costs, however has many disadvantages in relation to performance (e.g. when compared with photobioreactors, OP systems have lower productivities). As OP systems are open to the
5 environment, they permit significant contamination and experience a typical evaporative loss of approximately 1 litre of water per gram of biomass produced (Johnson et al., 2015).
1.2.3 Closed Systems
A photobioreactor is a closed system used for culturing photosynthetic cells, which uses natural light source or artificial light. It permits control temperature, pH, carbon dioxide, oxygen and minimizes contaminations (Barsanti and Gualtieri, 2014).
There are different categories of photobioreactors, with diverse geometries, dimensions, materials and type of operation (Figure 2) (Barsanti and Gualtieri, 2014).
Figure 2 Different types of photobioreactors (Barsanti and Gualtieri, 2014).
The tubular photobioreactors are the most used systems that are constituted by tubes arranged in multiple possible orientations. Thus, there are horizontal, vertical, spiral or inclined tubular photobioreactors. This type of reactor is built with rigid transparent material, typically acrylic. The biggest problem of the tubular photobioreactors is the luminous efficiency, which is prejudiced by the curvature of the tubes´s surface. It makes the sunlight being reflected, not being utilized for growth of the biomass. However, the horizontal tubular photobioreactors allow a better use of light (comparing with the vertical ones), but need a large area installed. Spiral tubular photobioreactors are more efficient in terms of sunlight
Photobioreactor (PBR) Tubular systems Horizontal Vertical Spiral Inclined Foil systems Plate systems
6 use without requiring much installation area. Inclined tubular photobioreactors gather some of the advantages of the horizontal and vertical reactors, such as luminous efficiency, gas exchange and a good ratio volume/area installed (Fernandez et al., 1999; Ugwu et al., 2008).
1.3 Harvesting of microalgae biomass
Harvesting of biomass is a necessary process and contributes to 20-30% of the total of the biomass cost production. There are various recovery methods and does not exist a suitable method to every case. Biomass can be recovery by filtration, centrifugation and gravity sedimentation.
Filtration under pressure or vacuum are satisfactory for harvesting microalgae with a large size such as Arthrospira maxima and Coelastrum proboscideum but don’t result to recover microalgae with a small size, for instance Chlorella sp., Scenedesmus sp. and
Dunaliella sp.. Membrane microfiltration and ultrafiltration are another way to conventional
filtration for fragile cells (Grima et al., 2003).
Centrifugation can harvest the majority of microalgae and is the preferred method of recovery microalgae cells. This method can be rapid, but expensive. Conditions for centrifugation are dependent on the residence time of the cell slurry in the centrifuge, on the settling characteristics of the cells and the settling depth (Grima et al., 2003).
1.4 Cell disruption methods
Cell disruption is very a important procedure for isolation and purification of intracellular products from microalgae (Grima et al., 2003). The choice of the most appropriate method determines, not only the yield but the downstream processes success. Thus, it is desirable a complete cell disintegration and simultaneously obtaining high yields and integrity of the bioproduct (Lima and Mota, 2003). Some microalgal cell disruption methods are in table 2 and their advantages and disadvantages.
7
Table 2 Microalgae cell disruption methods: advantages and disadvantages.
Methods Advantages Disadvantages References
Chemical treatment
Allow a selective delivery of a product depending on its location
Generally not appropriate for sensitive products (e.g. proteins); Caution must be taken for Human consumption.
(Grima et al., 2003)
( Lima and Mota, 2003)
Enzymes Low impact on the
environment
High cost of the enzymes; Caution must be taken for Human consumption (Olaizola, 2003) (Lima and Mota, 2003) (Sari et al., 2013)
Bead mill Applicable to large-scale use;
Continuous operating;
High energy consumption. Coupled cooling system;
(Lima and
Mota, 2003)
High-pressure cell disruptor
Applicable to large-scale use. Not appropriate for enzymes; Coupled cooling system.
(Lima and
Mota, 2003)
Ultrasonication/ Ultrasound bath
Produces cavitation in cells; and facilitates cell disruption.
High cost; Increases the heat.
(Grima et al., 2003)
(Safi et al., 2014)
Supercritical fluid Fast extraction yields; Use of solvents
generally recognized as safe; Low extraction times; Possibility of direct coupling with analytical
chromatographic techniques (e.g.GC and SFC)
High cost. (Herrero et al.,
8
1.5 Microalgae metabolites with high biotechnological potential
The idea to explore microalgae at industrial level appeared for the first time in Germany during World War II, as a cheap source of proteins. In the 50s and 60s were made efforts on optimizing algal cultures in US and Japan but unsuccessfully. Only in the 70s occurred major improvements with the cultures use for pigments production, food supplements and vitamins for the pharmaceutical industry (Soeder, 1986).
However, microalgae still remain an uncharted resource. Of the tens of thousands of microalgae species believed to exist, merely a few thousand strains are preserved in collections, and only a few hundred have been studied for metabolites. This represents a unique opportunity to discover new compounds and produce known metabolites at lower costs (Olaizola, 2003; Guedes et al., 2011).
Pigments, lipids, proteins and polysaccharides are some of microalgae metabolites, with high biotechnological interest due to their wide application range (Table 3) (Spolaore
et al., 2006). They can act as antioxidant, antibacterial, antiviral, anti-inflammatory,
anticarcinogenic compounds, etc (Choochote et al., 2014).
Antioxidants are known for scavenging active oxygen products (e.g. Singlet oxygen, superoxide radicals, hydroxyl radicals, hydroxylperoxide) and for increasing cells’ natural defences. They are also used to prolong the storage stability of food. Some synthetic antioxidants (Butylatedhydroxytoluene (BHT), butylated hydroxyanisole (BHA), tertiary tert-Butylhydroquinone (TBHQ), propyl gallate (PG)) are authorized for use in food. However, this compounds can be accumulated in body organs and tissues. For that reason, use of natural antioxidants are essential (Yingying et al., 2014).
9
Table 3 Products synthesized by microalgae and areas of application. * Microalgaespecies with high relevance for biotechnological applications.
Class of compounds Type of compounds
Areas of application Species* References
Pigments Chlorophylls; Carotenoids; Phycobilins. Cosmetics; Human nutrition; Animal feeding; Pharmaceutical application. Dunaliella salina Haematococcus pluvialis Arthrospira platensis Dunaliella tertiolecta Botriococcus braunii Nannochloropsis sp. Eustigmatos cf. polyphem Scenedesmus almeriensis Chlorella zofingensis Chlorella ellipsoidea (Koller et al., 2014) (Pulz and Gross 2004) (Herrero et al., 2006) (Mendiola et al., 2007) (Li et al., 2012)
(Granado-Lorencio et al., 2009)
(Del Campo et al., 2004) (Jaime et al., 2010) (Plaza et al., 2009) Lipids Polyunsaturated fatty acids; Glycerol; Hydrocarbons Human nutrition; Pharmaceutical application; Animal feeding; Energy creation (Biodiesel; Biogasoline) Isochrysis galbana Phaedactylum tricornutum Odontella aurita Nannochloropsis gaditana Arthrospira sp. (Koller et al., 2014) (Pulz and Gross 2004) (Pedro et al., 2013).
Proteins Enzymes;
Hormones; Amino acid; Peptides.
Human nutrition; Animal feeding. Lyngbya majuscula
Chlamydomonas reinhardtii Phaeodactylum tricornutum
(Koller et al., 2014) (Pulz and Gross, 2004)
10 Polysaccharides β-1,3-glucan; Carrageenan; Starch; Agar; Alginates; Cellulose; EPS; sPS;
Human nutrition; Pharmaceutical application;
Energy creation (Bioethanol); Industrial sector Porphyridium cruentum Rhodella reticulate Arthrospira platensis Chlorella stigmatophora Chlorella ellipsoidea Rhodella maculate Rhodella reticulata Dunaliella salina Schizochytrium sp. Isochrysis galbana (Koller et al., 2014) (Markou and Nerantzis, 2013)
(Pulz and Gross 2004) (Herrero et al., 2005) (Shi, 2007) (Murthy et al., 2005) (Chen et al., 2010) (Wang et al., 2011) (Yingying et al., 2014) (Ko et al., 2012); Bioplastics Polyhydroxyalkan oates (PHA); poly-β-hydroxybutyrate (PHB)
“Green Plastics” Arthrospira maxima
Nostoc muscorumn Synechocystis sp.
(Koller et al., 2014)
(Markou and Nerantzis, 2013)
Other compounds Silver; Gold; Biometallic; Silicon– germanium; Silica Human nutrition; Pharmaceutical application; Industrial sector; Navicula atomus Diadesmis gallica Arthrospira platensis
(Markou and Nerantzis, 2013) (Asmathunisha and
11
1.5.1 Pigments
The main groups of pigments found in microalgae are chlorophylls (e.g. a, b and c), carotenoids and phycobilins (Koller et al., 2014).
Chlorophylls (green coloration) have applications in food industry, for example as food additive (E140 dye). Chlorophyllin, a chlorophyll derivative, has a high effectiveness as a chemo-preventive agent on colon cancer cells when supplied as dietary supplement (Díaz et al., 2003). Chlorophylls also have deodorant capacity, therefore is used as an ingredient of pastilles (against bad breath) and body deodorants (Montgomery and Nachtigall, 1950).
Carotenoids (orange and yellowish colour) are strong antioxidants and therefore have important applications on human metabolism avoiding the negative consequences of free radicals, which are commonly associated with the induction of certain cancers. This way, carotenoids are used for “functional food” products (Koller et al., 2014). “Functional food” is a natural or processed food that was demonstrated to has biologically-active compounds with good benefit in the body when consumed in a regular diet. A functional food mustn’t be in the form of capsules or pills (Plaza et al., 2009).
β-carotene (Figure 3) is used as vitamin supplement (provitamin A) and also furnish an orange colour to egg yolk as wish by the customer (food colouring agent). Dunaliella
salina (Chlorophyceae) is cultivated for β-carotene biosynthesis because reaches levels of
up to 100g.kg-1 dry weight (Hu et al., 2008; Koller et al., 2014; Ben-Amotz, 1993).
12 Astaxanthin (Figure 4) is the most powerful known natural antioxidant with several applications. Cosmetic industry utilizes astaxanthin on sunscreen creams mainly because of its UV-protecting action but also because its waterproofness. In aquaculture sector, is common the addition of astaxanthin (E161j) on salmon and trout feed to give them a reddish colour with higher consumer acceptance, and has also an important function on the immune-system and a benefit impact in their fertility (Cardozo et al., 2007). Haematococcus pluvialis (Chlorophyceae) is used for the large production of astaxanthin (Durmaz, 2007).
Figure 4 Chemical structure of Asthaxanthin (Koller et al., 2014).
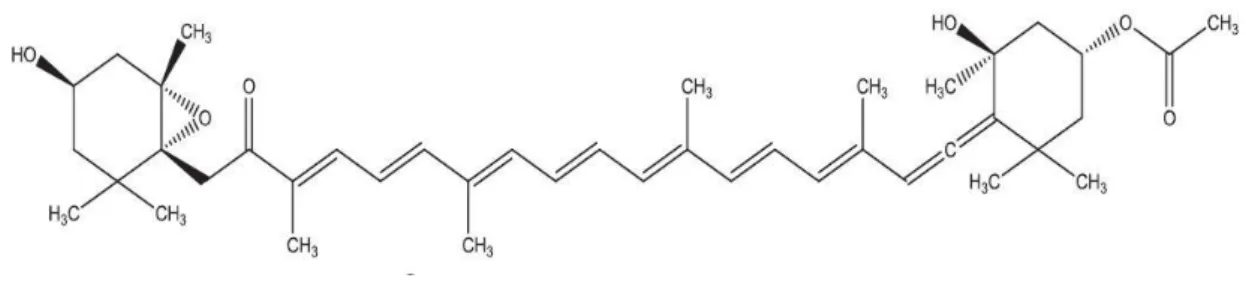
Fucoxanthin (Figure 5), which is available in diatoms and brown algae, has anti-inflammatory, antidiabetic, antioxidant and anti-obesity properties and can inhibit cell growth and induce apoptosis in human cancer cells (Maeda et al., 2005).
Figure 5 Chemical structure of fucoxanthin (Dewapriya and Kim, 2014).
However, there are some pigments that are still not approved for use as food additive in some countries. Violaxanthin is a food colorant (E161e) that has an orange colour and it is not allowed to use as food additive in USA and EU. Though, in Australia and New Zealand, it is already permitted. Dunaliella tertiolecta, Botryococcus braunii and Chlorella
ellipsoidea are potential producers of this pigment. On the other hand, canthaxanthin is not
13 EU, however USA approves this pigment as food additive. Nannochloropsis salina,
Nannochloropsis oculata and Nannochloropsis gaditana can produce canthaxanthin (Plaza et al., 2009; Koller et al., 2014).
Phycobilins (eg. phycocyanin and phycoerythrin) are mostly found in stroma of chloroplasts. Phycocyanin is a blue pigment mainly found in cyanobacteria, namely
Arthrospira is the major source for this pigment with up to 20% of its dry weight. Whereas
phycoerythrin is a red pigment found in red algae. Phycobilins are linked to determined water-soluble proteins, the phycobiliproteins (Parmar et al., 2011).Phycobiliproteins are the algal-derived products the highest market values and have been utilized commercially as natural colorant. They are used as chemical tags, by linking phycobiliproteins to antibodies, in immunofluorescence techniques, due to its fluoresce at a particular wavelength.
Aphanizomenon flos-aque can be cultivated to produce phycobiliproteins. (Arad and Yaron,
1992; Yaakob et al., 2011).
1.5.2 Lipids
Polyunsaturated fatty acids (PUFAs) from microalgae have shown advantages above fish oils, since they have no unpleasant odour, have lower risk of chemical contamination and better purifying potential. Thus, there is a large potential biotechnological market for microalgae PUFAs. For example, purified PUFAs are added to infant milk in EU with proved benefit. Other example is the production of “ω” eggs, hens are feed with microalgae (Pulz and Gross, 2004). It also, there is an increasing request for so called “vegan health food” wealthy in PUFAs for with microalgal biomass could play here an important role as well (Koller et al., 2014).
Eicosapentaenoic acid (EPA) (Figure 6), a ω-3 fatty acid, was established by the European Food Safety Authority (EFSA) as an important nutrient supplement. It is responsible for a proper order of the blood pressure, blood clotting, immune system (protective effects on the development of several cancers). Furthermore, EPA is applied in aquaculture as dietary constituents (e.g. in marine fish). Nannochloropsis sp. and
Phaeodactylum tricornutum are possible microalgal EPA large scale-producers (Karmali,
14
Figure 6 Chemical structure of Eicosapentaenoic acid (EPA) [(5Z,8Z,11Z,14Z,17Z)-5,8,11,14,17-icosapentaenoic acid] (Koller et al., 2014).
Docosahexaenoic acid (DHA) (Figure 7) is used as dietary supplement in food and drinks due to its positive effects on developing human fetus, healthy breast milk, infantile brain and eye development. It also has anti-inflammatory healthy effects, cardiovascular and nervous system (Fradique et al., 2013). DHA’s health effects are stated by EFSA. In addition, DHA is used in fish farming. Crypthecodinium cohnii, Schizochytrium, or Pavlova
lutheri are cultivated to produce DHA (Yaakob et al., 2011).
Figure 7 Chemical structure of Docosahexaenoic acid (DHA) [(4Z,7Z,10Z,13Z,16Z,19Z)-docosa-4,7,10,13,6,19-hexaenoic acid] (Koller et al., 2014).
Arachidonic acid (ARA) (Figure 8), a four-fold unsaturated ω−6 fatty acid, is used for nutrient supplements once it’s an important component of membrane phospholipids, has anti-inflammatory effects, behaves as a vasodilator and is essential for the repair and growth of skeletal muscle tissue. ARA is also applied to aquaculture (Koller et al., 2014).
Figure 8 Chemical structure of Arachidonic acid (ARA) [(5Z,8Z,11Z,14Z)-5,8,11,14-Eicosatetraenoic acid] (Koller et al., 2014).
15 γ-Linolenic acid (GLA) (Figure 9), an ω−6 unsaturated fatty acid, is used as food additive, since it has therapeutic applications due to its anti-inflammatory effects. It helps people suffering from diabetes, rheumatoid arthritis, multiple sclerosis, breast cancer, skin allergies, obesity, heart disease, high blood pressure, attention deficit hyperactivity disorder (ADHD), neurological problems related to diabetes and premenstrual syndrome. GLA is mostly present in cyanobacterial representatives (Fan and Chapkin, 1998).
Figure 9 Chemical structure of γ-Linolenic acid (GLA) [all-cis-6,9,12-octadecatrienoic acid] (Koller et al., 2014).
Nowadays, biodiesel production from microalgae is the most explored technology in development for lipids usage. In the past, two oil crises occurred (1973 and 1979) and leading the US Department of Energy began in 1978 a research program of biofuel production from microalgae in open fields. However, the program was abandoned in 1996 due to lack of finance, without achieving the purpose for which it was created (Sheehan et al., 1998). Nevertheless interest in microalgal biomass kept growing, since it is considered as one of the most promising feedstock for the large-scale production of biofuels, mainly due to its high lipid and carbohydrate content, fast generation of biomass and high photosynthetic efficiency. In order for biodiesel from microalgae production to be profitable it is necessary to generate revenues from other co-products of microalgae. This could be possible in a biorefinery setting. In a biorefinery, lipids are fractionated for biodiesel and the residual biomass from biodiesel production can be used as livestock feeds, or be fermented to produce bioethanol. However, cell disruption and lipid extraction process needs to be explored to guarantee that the functionalities of different cell components are kept (Pereira
et al., 2005; Halim et al., 2012). High levels of lipids have been reported mainly in green
algae (George et al., 2014). Nannochloropsis gaditana represents an attractive alternative as a renewable biofuel feedstock (Pedro et al., 2013).
16
1.5.3 Polysaccharides
Polysaccharides are macromolecules formed by the union of several monosaccharides. They play an important role on structural function and store energy, which why is essential to living beings (Raposo et al., 2013).
Sulphate polysaccharides released by marine microalgae have demonstrated the ability to avoid the accumulation, diminish the activity of free radicals and reactive chemical species, thus, acting as protecting systems against oxidative and radical stress agents. Sulphate containing exopolysaccharide (sPS) from Porphyridium cruentum and Rhodella
reticulata was demonstrated that has antioxidants and are dose-dependent, correlating
positively with sulphate content of the sPS (Tannin-Spitz et al., 2005; Sun et al., 2009). The antiviral bioactivity of sPS on different host cell-lines had been already highlighted. Arthrospira platensis produces an intracellular polysaccharide, named calcium spirulan that it is an inhibitor of enveloped virus replication (Hayashi et al.. 1996). Without any toxicity to the host cells, sPs can inhibit the attachment/absorption or replication while the early phases of the virus cycle (Martinez et al., 2005; Hasui et al., 1995; Kim et al., 2012).
Anti-inflammatory activity and immunomodulatory agents from polysaccharides have been studied. From Chlorella stigmatophora, extract of sPS showed immunosuppressant effects. Positive phagocytic activity in vitro or in vivo of Phaeodactylum
tricornutum is an evidence of direct stimulatory effect on the immune cells. Another example
comes from Gyrodinium impudicum, a marine dinoflagellate, that produces sPS p-KG03 and also stimulates the production of nitric oxide and immunostimulates the production of cytokines in macrophages. The homopolysaccharide of this dinoflagellate has immunomodulatory properties, suppressed tumour cell growth, stimulating the innate immune system in vivo and in vitro (Guzman et al., 2003;Bae et al.,2006).
As a tumour cell growth prevention, calcium spirulan of A. platensis prevents also pulmonary metastasis, adhesion and proliferation of tumour cells. From Porphyridium sp., was demonstrated that high molecular weight oversulphated EPS (extracellular polysaccharide) inhibited neoplastic mammalian cell growth. In addition, EPS could be a good candidate as an antitumoral agent, due to its immunostimulating properties (Geresh et
17
1.5.4 Bioplastics
Bioplastic, as its names implies, is a biodegradable plastic produced from biopolymers. Polyhydroxyalkanoates (PHAs) are linear polyesters produced typically in prokaryotic organisms. Thus, several cyanobacteria synthesize PHAs. These organisms store the carbon and energy in response to adverse growth conditions. (Markou and Nerantzis 2013).
Poly-β-hydroxybutyrate (PHB) is the simplest member of PHA, a natural thermoplastic polyester with similar properties to petroleum-based plastics but with the great advantage of complete biodegradability. Arthrospira maxima accumulates PHB under some adverse growth conditions. Under nitrogen starvation, A. maxima amasses 0,7% of dry weight and, under phosphorus starvation, up to 1,2% of dry weight. Furthermore, phosphorus and nitrogen starvation makes to a significant accumulation of carbohydrates that amounts up to 23% and up to 60-70% for phosphorus and nitrogen, respectively (De Philippis et al., 1992). Although, mixotrophy (microalgae can obtain energy from both organic carbon and light (Richmond, 2004)) increases accumulation of PHB in several species. In mixotrophic cultures of Synechocystis sp. PCC 6803, PHB accumulation amounts are up to 38% of dry weight when combined phosphorus starvation and gas-exchanging limitation. The supplement of organic carbon, such as acetate, fructose or glucose allows higher intracellular PHA accumulation (Panda and Mallick, 2007). For example, Nostoc muscorumn when grows photoautotrophically, produces PHB up to 8% of dry weight but when grows mixotrophically with 0,4% (w/v) glucose and acetate, amounted up to 35% (Markou and Nerantzis 2013).
1.5.5 Proteins
Microalgae are considered as a potential proteins source with high quality and can be used as direct food supplements or as nutraceuticals ( “A nutraceutical is a food or a part of a food for oral administration with demonstrated safety and health benefits beyond the basic nutritional functions to supplement diet, presented in a non-food matrix or non-conventional food formats, in such a quantity that exceeds those that could be obtained from normal foods
18 and with such frequency as required to realize such properties, and is labeled as a ‘nutraceutical’.” (Palthur et al., 2010). Microalgal proteins includes essential amino acids, particularly lysine and branched chain amino acid (BCAA) leucine, valine and isoleucine that count for 35% of the essential amino acids in human muscle proteins (Dewapriya and Kim, 2014).
Microalgae can produce high yields of recombinant proteins faster and with lower cost than cell culture (Specht et al., 2010). Additionally, microalgae have the capacity of post-transcriptional and post-translational modifications of biosynthesized proteins. This capacity and its intrinsic easiness of cultivation, confers a potential candidate of protein bioreactor (Himaya et al., 2013). As example, recombinant proteins produced in
Chlamydomonas reinhardtii chloroplasts, gives advantages over other protein
biosynthesizing systems due to its ability to fold proteins correctly and the capacity of assemble more complex proteins easily. Further, microalgae can be produced in full containment reducing the problems about environmental contamination, moreover, microalgae do not have the risk of gene flow because algae do not reproduce by a powder that spreads, like pollen (Mayfield et al., 2007).
Another example is the diatom Phaeodactylum tricornutum that was used to express a full-length IgG antibody against the Hepatitis B surface protein and the respective antigen with average expression levels of 9% of total soluble protein (Hempel et al., 2011).
Bioactive peptides, peptides with therapeutic potentials, are 2-20 amino acids long protein fragments and have potential to be used as nutraceuticals and functional food ingredients for therapeutic activities, such as antioxidant, antimicrobial, antihypertensive, immunomodulatory, anticancer and cholesterol-lowering effects. Studies demonstrated that cultivation of Pavlova lutheri could provide small peptide with high anti-oxidative activity. Further, Chlamydomonas sp. produce an active peptide witch potently suppresses
Helicobacter pylori induced carcinogenesis (Ryu et al., 2012; Dewapriya and Kim, 2014).
1.5.6 The market of microalgae metabolites
Microalgae are possibly one of the most useful organisms, however microalgal biotechnology is the younger branch of algal biotechnology. The biomass of microalgae is the predominant product in microalgal biotechnology and its market is about 5000 t per year
19 of dry matter and has a turnover of ca. U.S $1.25x10⁹ per year (2004). Biomass is collected from cultures in artificial ponds or photobioreactor (PBR) or from natural waters. The final product of biomass production is usually a powder and it is sold manly in human health food market. An example is the production of Haematococcus pluvialis. This microalgae is cultivated for astaxanthin production and there are culture techniques well developed. In Japan and Israel there are two different types of industrial-scale closed PBR for H. pluvialis. In Japan, a special spherical thin layer PBR and in Israel, a glass tube PHR. In China and Hawaii H. pluvialis is cultivated in open ponds (Pulz and Gross, 2004). Another examples of innovative processes and products that are produced are described on table 4.
Table 4 Microalgae as healthy ingredients and companies that produces them. Adapted from Pulz and Gross, 2004.
Country Company Alga Product Activity
USA Martek/Omegatec Crypthecodinium DHA Brain development
USA Cyanotec Haematococcus Astaxanthin Treating carpal
tunnel syndrme
USA MERA Haematococcus Astaxanthin Anti-inflammatory,
treats mucle soreness
Canada OceanNutrition Chlorella Carbohydrate
extract
Immune system, anti-flu
France InnovalG Odontella EPA Anti-inflammatory
Austria Panmol/Madaus Spirulina Vitamin B12 Helps immune
system
One of the most important products that can be produce from microalgae are pigments. Carotenoids market is estimated at about $1200 million per annum in 2010 with market value of β-carotene estimated at $261 million per annum in the same period. In 2010, the global use of bioplastics was 0,64 Kt and in 2011 increased to 0,85 Kt, while glycerol use was 1995,5 Kt. In the same period, vitamin and supplement, derived from microalgae, market was around $68 milion per annum (Table 5) (Markou and Nerantzis 2013). However, the majority of the microalgal high-value compounds are either not established in the market or are still not commercialized (Borowitzka, 2013).
20
Table 5 Global market of added value compounds from microalgae ( 1- Pulz and Gross, 2004; 2 -Markou and Nerantzis, 2013
Product group Product/ Added-value compound Global market (x106 U.S. $/annum) Production kt/annum Price $/kg References
Biomass Health food 1250-2500 (2004) - - 1 Pigments Carotenoids 1200 (2013) - - 2 β-Carotene 261 (2013) - 300-700 2 Astaxanthin 240 (2013) - 2000-7000 2 Phycobilins >60 (2013) - - 2 Bioplastics - 64 (2013) - 2
Fatty acids (omega-3) >700 (2013) 85 (2013) 0.88-3.83 (2013) 2 Vitamins and supplement 68 (2013) - - 2 Antioxidants β-Carotene >280 (2004) - - 1 ARA 20 (2004) - - 1 DHA 1500 (2004) - - 1 PUFA extracts 10 (2004) - - 1 Lipids Glycerol - 1995.5 0.3-1.0 2
Other Products Toxins 1-3
(2004)
- - 1
Isotopes >5
(2004)
21
1.6 Microalgae species with biotechnological potential
There are many species that have their biotechnological potential well recognized (Tables 3 and 4). The majority of species that are already produced industrially are from fresh water (e.g. Haematococcus pluvialis and Chlorella sp.). Therefore, it would be
interesting to explore more marine microalgae.
In the present study, the following species were selected as biological model systems: (1) Arthrospira genus is widely used and was selected Arthrospira maxima as freshwater representative specie to study; (2) to explore marine microalgae, were selected Isochrysis
galbana and (3) Tetraselmis chuii, due to their world wide application on marine
aquaculture.
1.6.1 Arthrospira maxima
Arthrospira maxima Setchell & N.L.Gardner in N.L.Gardner 1917 is a blue green
aquatic mesophilic (grows best in moderate temperature) microalgae that belongs to the phylum Cyanobacteria (Table 6). This algae is an oxygenic phototroph which means that doesn’t have heterocysts to fix nitrogen and use it as a source of energy. Its photosystem II and water oxidizing complex can be up to five times faster than higher plant photosystem II enzymes and it also can put up with high light fluxes (1400 µEm-2s-1) (Carrieri et al.. 2008).
Table 6 Taxonomy of Arthrospira maxima (Guiry and Guiry, 2015).
Classification Empire Prokaryota Kingdom Eubacteria Subkingdom Negibacteria Phylum Cyanobacteria Class Cyanophyceae Subclass Oscillatoriophycideae Order Oscillatoriales Family Microcoleaceae Genus Arthrospira
22
A. maxima flourish in alkaline (pH 9.5 to 11) carbonate and bicarbonate water with
high concentrations of sodium, so it propagates with low contamination in the wild environment (0.4-1.4 M) (Carrieri et al., 2008; Carrieri et al., 2011; Cheng et al., 2011). Therefore, Zarrouk’s medium is successfully used as a standard medium for A. maxima cultures, since its rich in bicarbonate (Raoof et al., 2006; Göksan et al., 2007).
It presents a perfect open spiral of 3-8 turns and 40-60µm of diameter with a length of 5-7µm (Setchell and Gardner, 1917) (Figure 10). It has a genome size of 6 Mb, with a guanine-cytosine content of 44.8% (U.S. Department of Energy, Walnut Creek, CA 2008).
Arthrospira maxima, as others cyanobacterias, do not have the DNA organized in
chromosomes. The genetic information is on the cytoplasm together with the photosynthetic membranes (Richmond, 2004).
Figure 10 Arthrospira maxima (Adapted from Setchell and Gardner, 1917)
The A. maxima biomass is mostly composed of protein (72%) and was demonstrated its toxicological and nutritional adequacy for human food complement (Dismukes et al., 2008; Torres-Durán et al., 2006).
It is widely used as nutraceuticals due the fact of the content of its protective antioxidants, vitamins, PUFA's, immunomodulatory, antiviral and hypolipidemic effects (Rodríguez-Sánchez et al.. 2012; Torres-Durán et al.. 2006).
23
1.6.2 Isochrysis galbana
Isochrysis galbana Parke 1949 is a brown marine unicellular microalgae that belongs
to the Haptophyta phylum (Sadovskaya et al.. 2014; Kaplan et al.. 1986) (Table 7). This microalgae is small (length 5-6 µm; breadth 2-4µm), motile cell with two equal flagella (Figure 11). It has a capacity to change shape so, for that reason, under microscope visualization, individuals shape are quite different. The movement is normally slow, with rotation of the body around the long axis (about one rotation per second) and in a forward direction. It also shows a slight phototactic reaction (Parke, 1949).
Table 7 Taxonomy of Isochrysis galbana (Guiry and Guiry, 2015).
Classification Empire Eukaryota Kingdom Chromista Phylum Haptophyta Class Coccolithophyceae Subclass Prymnesiophycidae Order Isochrysidales Family Isochrysidaceae Genus Isochrysis
I. galbana grows optimally at 18-24oC of temperature, 20-24 of salinity, 2500-5000 lux pf light intensity, 8,2-8,7 of pH and a maximum photoperiod of 24 hours of light (UMDU 2012). It is known for its fast growth rate and absence of toxins (Sadovskaya et al., 2014).
24
Figure 11 Isochrysis galbana (x 5000.): a) chromatophore; b) leucosin; c) nucleus; d) oil globule; e) stigma (Adapted from Parke, 1949).
It has a high content of proteins, fatty acids and soluble and insoluble polysaccharides. It has a complex mixture of biopolymers with different proportions of galactose, glucose, xylose, mannose, arabinose, rhamnose and fucose. Isochrysis galbana is usually used to feed mollusc larvae stages, fish and crustaceans in their early stages of growth in aquaculture (Dewapriya and Kim, 2014; Sadovskaya et al., 2014; Yingying et al., 2014).
25
1.6.3 Tetraselmis chuii
Tetraselmis chuii Butcher 1959 is a green marine unicellular microalgae that belongs
to the Chlorophyta phylum (Table 8).
Table 8 Taxonomy of Tetraselmis chuii (Guiry and Guiry, 2015).
Classification Empire Eukaryota Kingdom Plantae Phylum Chlorophyta Class Chlorodendrophyceae Order Chlorodendrales Family Chlorodendraceae Genus Tetraselmis
This microalgae has 12-14µm in length and 9-10µm in breadth. It is distinguished by a curved body when viewed in different sideways and an ovoid body shape with four flagella (Figure 12), which gives high mobility (Mohammadi et al., 2015; Nunes et al., 2005).
Figure 12 Tetraselmis chuii (x 1000) (Adapted from UTEX – University of Texas at Austin).
T. chuii has high content of proteins, essential fatty acids, lipids and sterols
(Ghezelbash et al., 2008). It is used in aquaculture to feed several species of crustaceans as
Artemia and molluscs as oysters (Nunes et al., 2005; Meseck et al., 2005). It also has been
vastly used to estimate the toxicity of chemical agents of marine ecosystems on producers and primary consumers (Ferreira et al., 2007).
27
Chapter 2: Objectives
2.1 Objectives
The objective of the present study was to evaluate the effect of photoperiod regime and growth phase on the protein content of three different microalgae, Arthrospira maxima,
Isochrysis galbana and Tetraselmis chuii. To achieve such objective, the microalgae were
subjected to different photoperiod regimes. The biomass was collected at logarithmic and stationary growth phase. For each situations it was estimated the doubling time, the specific growth rate, the biomass level production, the most suitable cell disruptor method and the crude protein content.
29
Chapter 3: Materials and Methods
3.1 Growth and biomass production
Arthrospira maxima, Isochrysis galbana and Tetraselmis chuii strains were supplied
by the School of Tourism and Maritime Technology. Culture conditions were monitored and controlled during all experimental setup.
Microalgae were cultured in carboys and in batch mode (final volume=5L), with constant and gentle aeration, under different photoperiods – light:dark 24:0, 12:12 and 18:6. The temperature of culture room was kept constant and equal to 23±1 oC. The light was provided by a white fluorescent lamp with 1641 lux of illuminance [Illuminance meter T-10. (Konica Minolta Sensing, Inc)].
Freshwater, for A. maxima, and natural seawater for I. galbana and T. chuii were filtered (Whatman glass microfiber filter, grade GF/C, 47 mm) and sterilized (121oC, 15 min, 1 atm). Water was enriched with Zarrouk's medium (Appendix 1) ( (Zarrouk, 1966), following Redfield’s ratio (N:P= 5:1; pH=9 ) for the first strain and with f/2 medium (Appendix 2) (Gillard, 1975) (N:P= 15:1) for the other considered microalgae. At day 0, microalgae volume corresponded to 10% of total volume.
3.1.1 Growth measurement
All the experiments were conducted in triplicate (n=3), to ensure statistical relevance. Growth parameters was followed every day for Isochrysis galbana and Tetraselmis chuii and every other day for Arthrospira maxima. For I. galbana and T. chuii were estimated specific growth rate, doubling time, and volumetric biomass productivity. For A. maxima was estimated volumetric biomass productivity.
30 3.1.1.1 Cell counting and calibration curve
The cells of Isochrysis galbana and Tetraselmis chuii were counted in a particle counter (Beckman coulter – Z1 S). For I. galbana were considered particles from 3 to 6 µm and for T. chuii from 8 to 13 µm. Previously, a 1% NaCl solution was prepared and filtered (glass microfiber filter, grade 0,45µm, 47 mm), to ensure no particles were added to the solution. The blank count was done using 100 mL of 1% NaCl for each cell diameter considered. Sample counting was performed with a 1:10 dilution (1 mL of sample: 99 mL of 1% NaCl), to ensure equipment sensibility. Sampling cup was washed between samples with 100 mL of NaCl 1% solution.
Specific growth rate was calculated according to Equation 1, relating number of cells per millilitre and days in culture. For A. maxima, it is not possible to determine specific growth rate due the fact that has helical shape and forms filaments. This characteristic does not permit cell counting in a particle counter.
ln(𝑥) = ln(𝑥0) + 𝜇𝑡
Equation 1 Specific growth rate equation, where x refers to the cell density (cell.ml-1), x
0 initial cell density
(cell.ml-1), μ the specific growth rate (day-1) and t the time (days).
The time period defined for logarithmic phase for I. galbana and T. chuii for each photoperiod are described on Table 10.
Table 9 Days in culture of logarithmic phase for Isochryisis galbana and Tetraselmis chuii.
Days of Logarithmic phase Photoperiod Isochryisis galbana Tetraselmis chuii
12L:12D 4-11 4-11
18L:6D 6-10 8-16
24L:0D 3-6 3-6
Doubling time was calculated from the Equation 2, relating the specific growth rate with natural logarithm.
31 𝑡𝑑 =𝑙𝑛2
𝜇
Equation 2 Cultures doubling time (td), where μ represents the specific growth rate.
A linear equation between optical density and biomass dry weight (g.L-1) was defined for Arthrospira maxima. For Isochrysis galbana and Tetraselmis chuii was defined two linear equation 1) between optical density and cell density (cell.mL-1 ) 2) between optical density and biomass dry weight (g.L-1).
A wavelength screening in the VIS- spectrum (400 nm to 800 nm) was performed for each microalgae, to ensure that the wavelength used was the optimal one. Table 9 summarizes the wavelength in which each microalgae showed higher absorbance.
Table 10 Wavelenght (nm) in which each microalgae presented higher absorbance.
Microalgae Wavelenght (nm)
Arthrospira maxima 441
Isochrysis galbana 440
Tetraselmis chuii 433
Optical density was measured every day using the wavelength which had the major absorbance on the screening, using an UV/VIS spectrophotometer Thermo Electron Corporation [Helios Aquamate]. Samples with absorbance higher than 1 were diluted, to ensure Beer-Lambert linearity (Griffiths et al., 2011).
32
3.1.2 Biomass quantification
Dry weight and productivity were gravimetrically calculated, according to Zhu and Lee (1997). All the filters (Whatman glass microfiber filter, grade GF/C, 47 mm) were previously dried at 60oC for 72 hours and then weighed (Xi). For biomass productivity measuring for Isochrysis galbana and Tetraselmis chuii, every three days, 10 mL of culture was filtered and filter dried at 60oC for 72 hours and then weighed, Xf. For Arthrospira
maxima was made the same method but to follow growth parameters was taken every other
day. Dry weight was calculated from the Equation 3 and volumetric biomass productivity (P) was calculated from Equation 4.
𝑋 =𝑋𝑓 − 𝑋𝑖 𝑉𝐹
Equation 3 Dry weight (g.L-1) estimate, where Xf is dry weight after a 72h drying (g), Xi is filter weight prior
filtration (g) and VF refers to volume filtered (mL).
𝑃 =𝑋𝑓 − 𝑋𝑖 ∆𝑡
Equation 4 Volumetric biomass productivity (g.L-1.day-1), where Xi refers to initial dry biomass concentration,
Xf refers to final dry biomass concentration and Δt refers to time variation.
Microalgae were grown in different photoperiod (Light:Dark - 12L:12D; 18L:6D; 24L:0D), biomass was collected at logarithmic and stationary growth phases.
3.1.3 Sample collection and storage
Total culture volume were harvested during logarithmic and stationary growth phase. Both Isochrysis galbana (v=3000 rpm, t=10 minutes, T=4oC) and Tetraselmis chuii (v= 5000 rpm, t=5 minutes, T=4oC) were harvested by centrifugation. A. maxima was recovered through vacuum filtration with filter glass fibre (Whatman glass microfiber filter, grade GF/C, 47 mm). Biomass was kept frozen at -80oC until further analysis.


![Figure 7 Chemical structure of Docosahexaenoic acid (DHA) [(4Z,7Z,10Z,13Z,16Z,19Z)-docosa- [(4Z,7Z,10Z,13Z,16Z,19Z)-docosa-4,7,10,13,6,19-hexaenoic acid] (Koller et al., 2014)](https://thumb-eu.123doks.com/thumbv2/123dok_br/18546981.905680/33.892.272.639.541.671/figure-chemical-structure-docosahexaenoic-docosa-docosa-hexaenoic-koller.webp)
![Figure 9 Chemical structure of γ-Linolenic acid (GLA) [all-cis-6,9,12-octadecatrienoic acid] (Koller et al., 2014)](https://thumb-eu.123doks.com/thumbv2/123dok_br/18546981.905680/34.892.206.705.346.420/figure-chemical-structure-linolenic-acid-gla-octadecatrienoic-koller.webp)

