Article
*e-mail: [email protected]
Potentiometric Sensor for Betahistine Determination in Pharmaceuticals, Urine and
Blood Serum
Ali A. Ensafi,* Fatemeh Doozandeh and Ali R. Allafchian
Department of Chemistry, Isfahan University of Technology, Isfahan, 84156–83111, Iran
A construção, a avaliação e a aplicação analítica de um novo sensor potenciométrico para a determinação de beta-histina é descrito. A atuação do eletrodo de membrana está baseada em trocas iônicas da beta-histina-tetrafenilborato como material eletroativo. Este eletrodo tem uma escala dinâmica linear entre 1,0 × 10⁻⁶-1,0 × 10⁻¹ mol L−1 de beta-histina com uma inclinação
Nerstiana de (29,74 ± 1,47) mV/década e, com um limite de detecção 5,8 × 10⁻⁷ mol L−1. A resposta
potenciométrica é independente do pH da solução na escala de pH entre 4,27 a 9,02. O eletrodo é de fácil construção, baixo custo, tempo de resposta rápido (dentro de 10 s) e pode ser usado por um período de oito semanas sem mudança signiicativa em suas características de desempenho. O sensor proposto indicou boa seletividade sobre uma variedade de outros compostos orgânicos e inorgânicos (carboxilatos e ânions inorgânicos). É relatada a aplicação do sensor potenciométrico na determinação de beta-histina em drogas farmacêuticas, na urina, e nas amostras do soro sangüineo com resultados satisfatórios.
The construction, evaluation and analytical application of a new potentiometric sensor for the determination of betahistine are described. The membrane electrode acts based on betahistine-tetraphenylborate ion-exchangers as electroactive material. This electrode has a linear dynamic range between 1.0 × 10⁻⁶-1.0 × 10⁻¹mol L−1 betahistine with a Nernstian slope of (29.74 ± 1.47) mV
decade−1and a detection limit of 5.8 × 10⁻⁷mol L−1. The potentiometric response is independent of the pH of the solution in the pH range of 4.27 to 9.02. The electrode shows easy construction, low-cost, fast response time (within 10 s) and can be used for a period of eight weeks without signiicant change in its performance characteristics. The proposed sensor displayed good selectivities over a variety of other organic and inorganic compounds (carboxylates and inorganic anions). Application of this potentiometric sensor for the betahistine determination in pharmaceuticals, urine, and blood serum samples is reported with satisfactory results.
Keywords: betahistine determination, ion selective electrode, potentiometry, pharmaceutical and biological luids
Introduction
Betahistine, N-methyl-2-(2-pyridyl)-ethylamine
(Figure 1), is a histamine analogue indicated in Menière’s disease.1 Betahistine (BHT) is a histaminelike drug that
acts as both a partial histamine H1 receptor agonist and as a histamine H3 receptor antagonist.2 It is generally
assumed that the eficacy of BHT results from vascular effects,3 inducing an increase in cochlear blood low as
shown in the rat and the guinea pig.4 In addition, other
effects on the central nervous system have been suspected by BHT because betahistine was also found to be effective
in vestibular syndromes unrelated to vascular insuficiency. Few publications have been reported for the determination of BTH including calorimetry through its reaction with chloranil,5 high performance liquid chromatography
(HPLC) technique.6,7 However, many of these methods
are often time-consuming,6 technically demanding and
require the use of costly instrumentations,6 and suffer from
many interfering substances.5,7 Thus, there is an important
demand for sensitive, low-cost, simple, and rapid method for the determination of BTH in pharmaceuticals and biological samples.
Potentiometric membrane sensors are now widely used for the direct potentiometric determination of different compounds in various samples.8–10 The polymeric
membranes can easily be manufactured in different sizes and shapes and are less affected by the response of biological substrates such as protein, enzyme, antibody, etc. Thus, solvent polymeric membranes have proved to be suited for clinical analysis.11,12 Their advantages are low
detection limit, adequate selectivity, high accuracy, simple design, low cost, wide concentration range and applicability to coloured and turbid solutions.13 Many membranes were
made from liquid and plasticized poly(vinylchloride) (PVC) and are based on a water-insoluble ion-pair complex acting as ion-exchanger.14–17
To the best of our knowledge, there is no report on the use of ion-selective potentiometric sensor and/or voltammetric method for the determination of BTH. In this paper, a plastic membrane-selective electrode of the conventional type has been constructed. The membrane sensor is based on incorporation of betahistine-tetraphenylborate (BTH-TPB) ion-exchanger in PVC matrix on a platinum wire (Pt-wire) electrode that is plasticized with dioctyl phtalate (DOP). The electrode is fully characterized under batch conditions and then used for the determination of BTH in pharmaceutical, urine, and blood serum samples. The proposed sensor has the advantages of versatility, fast response, simplicity, stability, and repeatability along with low limit of detection.
Experimental
Reagents
All chemicals used were of analytical reagents grade and were used without further puriication. All solutions were prepared by dissolving the salts in deionized water.
Polyvinyl chloride (PVC) of high relative molecular weight, dibutyl phthalate (DBP), dioctyl phthalate (DOP), sodium tetraphenylborate (NaTPB), dioctyl sebacate (DOS), tetrahydrofuran (THF), and all other chemicals were of highest purity available from Aldrich (Milwaukee, USA), and were used without further puriications, except THF, which was distilled before using. The other drugs used as interferences were purchased from Fluka and Sigma. All the solutions were prepared in doubly distilled deionised water and stored in dark to prevent photochemical oxidation of the substances.18
Sodium hydroxide and nitric acid solutions of concentrations within the range of 0.1-1.0 mol L−1 were
used for adjusting the pH of the solutions.
A stock solution of 1.0 × 10⁻¹ mol L−1 BTH
dihydrochloride was prepared by dissolving an accurate mass of BTH dihydrochloride (Sigma, St. Louis, USA) in water, kept in a dark glass bottle and then stored at 4 °C. More dilute solutions of BTH dihydrochloride were prepared by accurate dilution of the stock solution with water.
Urine and blood samples were obtained from fasting healthy people during morning hours.
Apparatus
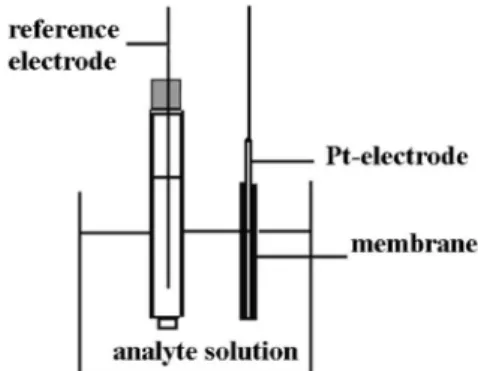
Potentials were measured by direct potentiometry at 25 ± 0.1 °C with the help of ceramic junction calomel electrode as the external reference electrode and the cell set-up was as follow:
Hg/Hg2Cl2, KCl(sat)Betahistine solutionMembranePt-wire
All potentiometric measurements were made with a pHmeter, Corning, model 140 (Switzerland). All emf measurements were carried out in a 50 mL double walled glass cell with a constant magnetic stirring. Response times were determined after the potential of the solution had became constant, and similar measurements were carried out in another solution of 10 fold lower concentration. A brief scheme of the cell is shown in (Figure 2).
For adjustment of the pH of the solution, a pHmeter, Corning model 140 (Switzerland), with a double junction glass electrode was used to check the pH of the solutions. IR spectra were recorded using FT-IR (Jasco, 680 plus, Tokyo, Japan) with a resolution of 1.0 cm−1.
Chromatographic separation was accomplished in the Shimadzu (Tokyo, Japan) with a C18 column (150 × 4.6 mm and 3.0 μm as particle size).
Electrode preparation and calibration
BTH-TPB was embedded in a PVC matrix containing DOP as a plasticizer. The membrane was made by the following procedure: 29.2 mg PVC plus 67.0 mg DOP and 4.1 mg BTH-TPB were dissolved in 3 mL of THF with shaking the mixture for 20 min. The coating process of the platinum-wire electrode was performed by dipping 1.5 cm of a Pt-wire, 20 times into the solution mixture. After each coating, the membrane was dried with a stream of air still a thin ilm was formed. Then, the electrode was immersed into BTH solution with concentration range from 1.0 × 10⁻¹
to 1.0 × 10⁻⁷ mol L−1. Then, the potential of the membrane
electrode was recorded vs. saturated calomel electrode
after stabilization of the cell potential to ± 0.1 mV and at 25 ± 1 °C. The cell potentials, Ecell, were recorded and plotted vs. −log[BTH]. The resulting graphs were used for
subsequent determination of unknown BTH concentration.
Determination of BTH in human blood serum, urine and pharmaceutical samples
For analysis of tablets, a group of ive tablets was individually weighed, finely powdered and mixed. A portion of the powder (500 mg) was accurately weighed and transferred into a 50 mL volumetric lask containing 25 mL of H2O. After being continuously shaken for 30 min, the
lask was made up to volume with H2O, and the solid was left to decant for 30 min; then, 1.0 mL aliquot was diluted to 25 mL with H2O in a 25 mL volumetric lask.
Drug-free human serum and urine, used in this study, was obtained from healthy volunteers. Urine and blood plasma were also obtained from non-healthy volunteers. Urine samples were stored in a refrigerator immediately after collection. The urine and plasma samples were analyzed before 3 h of their sampling, except stated. The urine and/or blood samples were taken from humans and were used for measurements after its centrifuged (3,000 rpm, 10 min at 25 °C) and diluted two-time with water without any further pretreatment. In addition, the diluted samples were spiked with stock solution of BTH to get the inal concentrations of BTH (between 1.0 × 10⁻⁶
and 1.0 × 10⁻¹ mol L−1) in the diluted sample. The samples
were spiked just before analysis.
High performance liquid chromatography (HPLC) was used for real sample analysis. The analyte (BTH) was separated with a C18 column (250 mm × 4.6 mm i.d., 5 μm
particle diameter). The mobile phase was programmed to deliver 30% acetonitrile and 70% sodium acetate (0.02 mol L−1, pH 4.5) with a low rate of 1.0 mL min−1, for
1 min and linear gradient elution from 1 to 21 min to end
with 70% acetonitrile and 30% sodium acetate solution. The UV detector was set at 254 nm.
Results and Discussion
Electrode characteristics
BTH has two –NH functional groups that can make ion association with tetraphenyl borate (TPB) to produce a white solid. The IR spectrum of BTH showed one C=NH+
band at 2426 cm−1, an –NH+ band based on pyridine ring
at 3435 cm−1 and an –NH
2+ band at 2769 cm−1, whereas
for the ion-pair, those bands became C=N and N–H that showed at 1601 cm−1 and 3416 cm−1. This means that BTH
has a strong interaction with TPB. Moreover, Job’s method was used to prove the stoichiometry of the association of the species (BTH-TPB). The concentrations of BTH and TPB were taken to be constant (2.0 × 10⁻³ mol L−1). Seven
aqueous solutions were prepared containing BTH and TPB at various molar ratios so that the inal volume always reached 10 mL. Then, the extraction was performed using 10 mL of chloroform, and the absorbance was measured at 249 nm. The plot reached a maximum value at a mole fraction of Xmax = 0.70, which indicates the formation of 1:2 complex between BTH and TPB. The observations conirm special interactions between BTH and TPB.
We have checked the PVC membrane response with and without the carrier to different BTH concentrations. The results showed that the membrane with no carrier displayed insigniicant selectivity toward BTH and their response was not reliable. However, in the presence of the ion-pair (BTH-TPB), the optimized membrane demonstrated the Nernstian response and remarkable selectivity for BTH over several compounds. The selectivity of the membrane to BTH is due to the fact that insuficient interaction occurs among the other substances with BTH-TPB.
Proper equilibration of membranes is essential to have a sensor showing good response characteristics. The ratio of various membrane ingredients such as amount of the ionophore, nature of the solvent mediator (plasticizer), amount of plasticizer to PVC ratio, and especially the nature of the additives, time of contact and the concentration of equilibrating solution were optimized, so that the membranes develop reproducible, stable and noiseless potentials. Membrane to membrane and batch to batch reproducibility was assured carefully following the optimum conditions of fabrication.
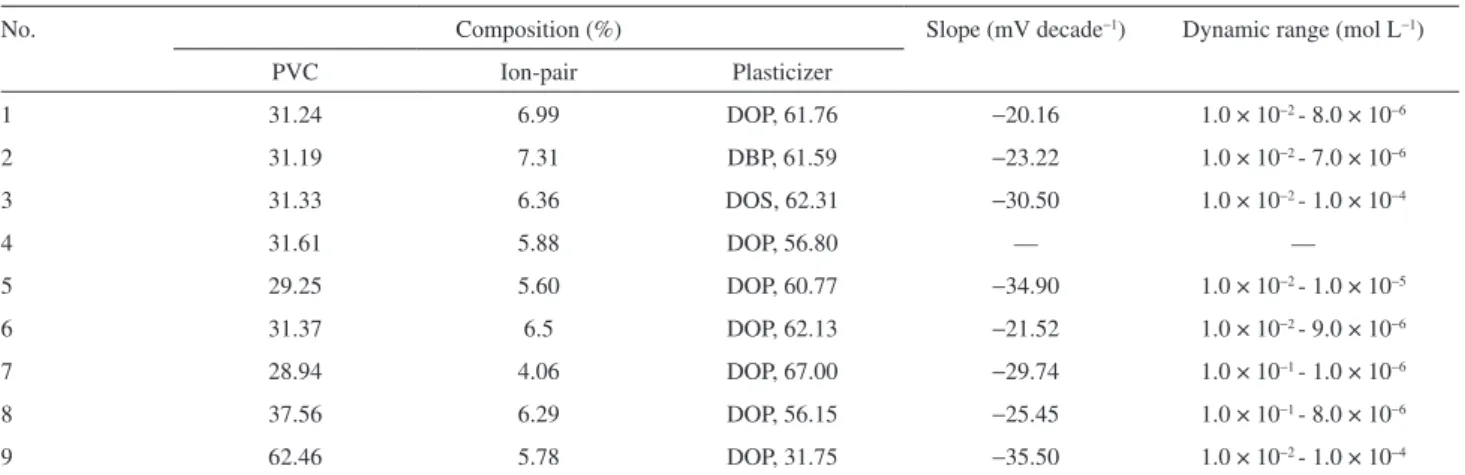
general, the sensitivity and selectivity of an ion-selective electrode is strongly inluenced by the nature and amount of the plasticizer. The effect of the plasticizer on the characteristics of BTH-selective electrode was investigated by using three kinds of plasticizers including DOP, DBP and DOS. The electrodes plasticized with DOP exhibited the better response sensitivity than that with DOS or DBP. The potential responses of the ion-selective electrodes to BTH are shown in Table 1. It is also known that the nature and amount of lipophilic additive strongly inluence the response of the BTH selective electrode. The results showed that the presence of lipophilic anion in cation-selective membrane electrodes diminished the ohmic resistance,19 enhanced
the response behavior selectivity,20 and also increased
the sensitivity of the electrode. As shown in Table 1, nine membrane compositions were prepared by varying the percentage of the ion-exchangers (BTH-TPB) while the percentage of the PVC and the plasticizer also were changed. The inal results showed that 28.94 wt.% PVC, 67.00 wt.% DOP, and 4.06 wt.% BTH-TPB (No. 7, Table 1) result in the best sensitivity with a Nernstian slope of 29.74 ± 1.47 mV decade -1 over a relatively wide concentration
range of BTH (1.0 × 10⁻⁶ to 1.0 × 10⁻¹ mol L−1).
Inluence of pH
The dependence of the potentials of the proposed electrode to different pH was investigated by measuring the sensor potential in a 1.0 × 10⁻³ mol L−1 BTH solution
over a pH range of 2.0-11.0. The solution pH was adjusted with dilute HNO3 and NaOH solutions. As it is obvious
from Figure 3 the response of the electrode is independent of pH in the range of about 4.3-9.0, which can be taken as the working pH range of the electrode. A signiicant change in the potential response was observed when the pH was above 9.8. With more acidic conditions, BTH
may be protonated, then deactivated. On the other hand, in basic solution, hydroxide ions may react with BTH to produce neutral species, which could not extract into the membrane.
Response and lifetime
Response time is an important factor for any ion-selective electrode. Thus, in the case of all electrodes, the average response time required for the electrodes to reach a potential response within ± 1 mV of inal equilibrium values after successive immersing of sensor into a series of solutions each having a 10 fold difference in their concentration , was obtained. The resulting potential-time for the coated wire electrode obtained upon changing the BTH concentration from 1.0 × 10⁻¹ to 8.0 × 10⁻⁶ mol L−1
is shown in Figure 4. The response time of the electrode to reach the inal equilibrium value was different in different BTH concentrations. The response time of the sensor was found to be less than 10 s at various BTH concentrations
Table 1. Optimized membrane compositions and their potentiometric response properties in betahistine dihydrochloride selective electrode
No. Composition (%) Slope (mV decade−1) Dynamic range (mol L−1)
PVC Ion-pair Plasticizer
1 31.24 6.99 DOP, 61.76 −20.16 1.0 × 10⁻² - 8.0 × 10⁻⁶
2 31.19 7.31 DBP, 61.59 −23.22 1.0 × 10⁻² - 7.0 × 10⁻⁶
3 31.33 6.36 DOS, 62.31 −30.50 1.0 × 10⁻² - 1.0 × 10⁻⁴
4 31.61 5.88 DOP, 56.80 –– ––
5 29.25 5.60 DOP, 60.77 −34.90 1.0 × 10⁻² - 1.0 × 10⁻⁵
6 31.37 6.5 DOP, 62.13 −21.52 1.0 × 10⁻² - 9.0 × 10⁻⁶
7 28.94 4.06 DOP, 67.00 −29.74 1.0 × 10⁻¹ - 1.0 × 10⁻⁶
8 37.56 6.29 DOP, 56.15 −25.45 1.0 × 10⁻¹ - 8.0 × 10⁻⁶
9 62.46 5.78 DOP, 31.75 −35.50 1.0 × 10⁻² - 1.0 × 10⁻⁴
and found to remain stable for several days without much drift in the potentials.
Nernstian slope
The plot of the potential difference between the ion selective electrode and calomel reference electrode vs.
the logarithm of the BTH concentration is shown in Figure 5. This igure shows that electrode No. 7 gives a linear Nernstian response in the BTH concentration range of 1.0 × 10⁻⁶ to 1.0 × 10⁻¹ mol L−1 with a slope of
29.74 ± 1.47 mV decade-1.
The limit of detection (LOD), deined as the concentration of BTH obtained when the two linear regions of the calibration graph are extrapolated to the baseline potentials, 5.8 × 10⁻⁷ mol L−1 was obtained. The limit of quantitation
(LOQ) was equal to 8.1 × 10⁻⁷ mol L−1 BTH.
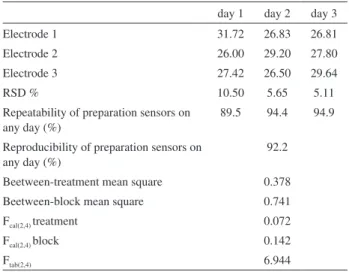
ANOVA test method used to show the reproducibility and repeatability of the sensor for the slope of
BTH calibration curve for BTH concentrations of 1.0 × 10⁻⁶ to 1.0 × 10⁻² mol L−1 on three different days.
The results are given in Table 2. The results showed that Fcal(2,4) between-treatment (= 0.378) was less than Ftab(2,4) (= 6.944, P = 0.05), meaning that there was no
signiicant difference between the sensor response signals during measurements, comparing the between-block and residual mean squares gives Fcal(2,4) = 0.142. The critical value of F being 6.944 (P = 0.05), no signiicant difference exists among different days, and conirmed the stability and reproducibility of the sensor. The repeatability of the sensor was investigated by preparing ten similar electrodes with the optimum membrane composition and then the slopes of each electrode were determined over 1.0 × 10⁻¹ and
1.0 × 10⁻⁶ mol L−1 BTH concentration. An average slope
of 29.74 ± 1.42 mV decade−1 was achieved.
The electrode was used over a period of 8 weeks without any signiicant effect on the membrane potential when used for analysis of BTH in urine samples. The lifetime of the electrode was determined by reading the potential values of the calibration solutions and plotting the calibration curves for the 10 weeks period (Figure 6), when used for analysis of BTH in urine samples 5 times per day. The slope of the electrode (29.74 mV per decade change) was observed to
show a gradual decrease after 56 days. We can therefore, concluded that the lifetime of the proposed electrode is at least 8 weeks. After this period, the slight change in the slope was observed. The lifetime of ion selective electrodes mainly depends on the type of ionophores and plasticizers used, and also on the number of times it is used.21 After 10
weeks, the electrode response deteriorated which may be attributed to the aging of the PVC matrices, ionophore as well as plasticizer.21
Figure 4. Response time of the electrode: (A) 1.0 × 10⁻¹ mol L−1; (B) 1.0 × 10⁻² mol L−1; (C) 1.0 × 10⁻³ mol L−1; (D) 1.0 × 10⁻⁴ mol L−1; (E) 1.0 × 10⁻⁵ mol L−1; (F) 9 .0 × 10−6 mol L−1 and (G) 8.0 × 10⁻⁶ mol L−1 BHT.
Figure 5. Potentiometric response of the electrode with the optimum conditions.
Table 2. ANOVA test method for the measuring of the repeatability and reproducibility of the slope for sensor
day 1 day 2 day 3
Electrode 1 31.72 26.83 26.81
Electrode 2 26.00 29.20 27.80
Electrode 3 27.42 26.50 29.64
RSD % 10.50 5.65 5.11
Repeatability of preparation sensors on any day (%)
89.5 94.4 94.9
Reproducibility of preparation sensors on any day (%)
92.2
Beetween-treatment mean square 0.378
Beetween-block mean square 0.741
Fcal(2,4) treatment 0.072
Fcal(2,4) block 0.142
Sensor selectivity
The effect of interfering substances on the response behavior of a selective membrane electrode is usually described in terms of selectivity coefficients, Ki,j. In this work, the selectivity coefficients for BTH with respect to a variety of interfering substances were determined by separation solution method (SSM)22
with a ixed concentration of interference compounds at 1.0 × 10⁻⁴ mol L−1 BTH. Then, the selectivity coeficients
were evaluated. The resulting selectivity coeficients for BTH are summarized in Table 3. From the results given in Table 3, it is obvious the proposed electrode is highly selective with respect to a variety of other substances.
Analytical applications
It can be seen that the amount of BTH can be accurately determined using the proposed sensor. To assess the applicability of the proposed sensor to real samples, an attempt was made to determine BTH in urine, plasma and pharmaceutical samples. The results were also compared by
HPLC method.23 Each sample was analyzed in triplicate by
standard addition method, using the sensor. The changes in the potential were recorded for each increment and used to calculate the concentration of BTH in the sample solutions using the following equation:
CX = CS{VS/(VS + VX)}{10n(∆E/S) – VX/(VX + VS)}–1
where Vx and Cx are the volume and concentration of the unknown sample, respectively, Cs and Vs are the concentration and volume of the standard solution, respectively, ∆E is the change in potential due to the addition of the standard solution, and S is the slope of the
Table 3. Potentiometric selectivity coeficient of various potential interfering substances
Substance logK Substance logK Substance logK
Co2+ –2.70 Zn2+ –2.80 Fructose –5.84
NO3– –9.91 Mn2+ –1.28 Diphenhydramine –1.17
Cr3+ –2.28 CO
32− –6.59 Captopril –4.52
Mg2+ –4.60 Cl– –6.91 Isoproterenol –4.21
Ca2+ –4.32 IO
4– –9.57 Desipramine –1.10
Ni2+ –2.97 K+ –2.08 Uric acid –5.56
Cd2+ –2.89 NH
4+ –2.68 Ciproloxacin –1.93
Fe+2 –3.07 Glucose –5.70 Sulforhodamine G –6.48
Na+ –2.42 Sucrose –5.81
Figure 7. A typical HPLC chromatogram of a urine sample, sampling was made after 2.5 h from a man who is safe and used; a) 0.0 mol L−1 BTH added; b) 2.5 × 10⁻⁵ mol L−1 BTH; c) 4.0 × 10⁻⁵ mol L−1 BTH.
calibration graph. In addition, the analysis results of the urine, pharmaceutical and plasma samples by the proposed sensor were compared with HPLC method statistically, using Student’s t–test (for the accuracy), and variance ratio, F–test (for the precision) at 95% conidence level. The results are given in Table 4, which shows that the amounts of BTH recovered with the help of the sensor are similar, thereby relecting the utility of the proposed electrode. A typical chromatogram of a tablet analysis is shown in Figure 7.
The sensor was also successfully applied as an indicator electrode in the potentiometric titration of BTH solution with NaTPB. Typical results for the titration of a 25 mL of 1.0 × 10⁻³ mol L−1 BTH solution with
1.0 × 10⁻² mol L−1 NaTPB is shown in Figure 8 with a very
Table 4. Concentration values obtained from the proposed (under the optimum conditions (n = 3)) and the reference method for BHT analysis of urine
and plasma samples
Sample BHT added BHT founded Recovery(%) Standard method
(mol L–1)
Fcalculated# tcalculated#
Urine (1) –– < LOD –– < LOD –– ––
Urine (1) 2.00 ×10⁻³ mol L−1 2.04 (± 0.02) ×10−3 mol L−1 102.2 –– –– ––
Urine (2) –– < LOD –– < LOD –– ––
Urine (2) 3.00 ×10⁻⁴ mol L−1 2.98 (± 0.02) ×10−4 mol L−1 99.3 –– –– ––
Urine (3) –– < LOD –– < LOD –– ––
Urine (3) 4.00 ×10⁻⁵ mol L−1 3.67 (± 0.18) ×10−5 mol L−1 91.8 –– –– ––
Urine (4)a –– 8.20 (± 0.09) ×10−6 mol L−1 –– 8.32 (± 0.28) ×10−6 9.68 0.71
Urine (4)a 4.00 ×10⁻⁶ mol L−1 12.10 ×10⁻⁶ mol L−1 97.5 –– –– ––
Urine (5)b –– 7.20 (± 0.13) ×10−6 mol L−1 –– 7.14 (± 0.26) ×10−6 4.00 0.35 Urine (5)b 4.00 ×10⁻⁶ mol L−1 11.20 (± 0.20) ×10−6 mol L−1 100.0 –– –– –– Urine (6)c –– 3.20 (± 0.11) ×10−6 mol L−1 –– 3.14 (± 0.25) ×10−6 5.16 0.38
Urine (6)c 4.00 ×10⁻⁶ mol L−1 7.30 (± 0.20) ×10−6 102.5 –– –– ––
Urine (7)c –– 3.50 (± 0.10) ×10−6 mol L−1 –– 3.42 (± 0.24) ×10−6 5.76 0.53 Urine (7)c 4.00 ×10⁻⁶ mol L−1 7.40 (± 0.10) ×10−6 mol L−1 97.5 –– –– ––
Plasma (1) –– < LOD –– < LOD –– ––
Plasma (1) 3.00 ×10⁻³ mol L−1 3.13 (± 0.25) ×10−3 mol L−1 104.3 –– –– –– Plasma (2)a –– 8.20 (± 0.12) ×10−6 mol L−1 –– 8.44 (± 0.37) ×10−6 9.51 0.89 Plasma (2)a 3.00 ×10⁻⁶ mol L−1 11.30 (± 0.20) ×10−6 mol L−1 103.3 –– –– –– Plasma (3)b –– 7.90 (± 0.10) ×10−6 mol L−1 –– 7.75 (± 0.27) ×10−6 7.29 1.50 Plasma (3)b 5.00 ×10⁻⁶ mol L−1 13.00 (± 0.30) ×10−6 mol L−1 101.7 –– –– –– Plasma (4)c –– 4.00 (± 0.10) ×10−6 mol L−1 –– 4.10 (± 0.32) ×10−6 10.24 0.52 Plasma (4)c 4.00 ×10⁻⁶ mol L−1 7.90 (± 0.20) ×10−6 mol L−1 97.5 –– –– –– Tablet(Amin
company)
8.00 mg 7.94 ± 0.50 mg 99.2 7.64 ± 0.75 mg 2.25 0.58
Tablet (Shahrdarou company)
16.00 mg 16.16 ± 0.96 mg 101.0 15.77 ± 1.1 mg 1.31 0.19
Tablet (Solvay company)
8.00 mg 8.73 ± 0.37 mg 109.1 8.23 ± 0.68 mg 3.38 1.12
± Shows the standard deviation for n = 3 replicates analysis. a Sampling was made after 2.5 h from a man who is safe and used BHT. b Sampling was made after 2.5 h from a man who had Menière’s disease and used BHT. c Sampling was made after 2.5 h from a man who had kidney problem and used BHT; #: Ftable, 95% = 19.00, and ttable, 95% = 2.78.
good inlection point, showing perfect stoichiometry that is observed in the titration plot. Before the titration end point, the measured potential shows a usual logarithmic change with amount of the titrant added, while the potential response after the end point was almost constant, due to the low concentration of free BTH ions in the solution.
Conclusion
BTH-TPB ion-exchangers as electroactive material are successfully exploited to use as a neutral carrier in PVC membrane as a coated wire. The new potentiometric sensor revealed Nernstian response over a wide concentration range for BTH. Meanwhile, it also has some other advantages, such as wide dynamic range, ine selectivity and long lifetime. These characteristics make us believe that this electrode will be used widely. The electrode is very easy to prepare and use. Its LOD for BTH is low (5.8 × 10⁻⁷ mol L−1). The comparison between the
proposed ionophores in ion-selective electrode indicated that the presented electrode is remarkably superior in terms of the detection limit, especially the selectivity over other substances. These characteristics and the typical applications presented in this paper make the sensor suitable for measuring BTH content in pharmaceutical and biological luids samples without any signiicant interaction from concomitant substances. The proposed membrane sensor work well under laboratory conditions.
Acknowledgements
The authors express their appreciation to the Isfahan University of Technology Research Councils and Center of Excellence in Sensors and Green Chemistry for inancial support of this work.
References
1. Dollery, C.; Therapeutic Drugs, Churchill Livingstone: London, 1991.
2. Timmerman, H.; Acta Otolaryngol.1991, 479, 5.
3. Meyer, J. S.; Mathew, N. T.; Hartmann, A.; Rivera, V. M.;
J. Clin. Pharmacol.1974, 14, 280.
4. Laurikainen, E.; Miller, J. M.; Nuttall, A. L.; Quirk, W. S.; Eur. Arch. Otorhinolaryngol1998, 255, 119.
5. Salman, S.; Akkuck, E.; Gezginci, H.; Acta Pharm. Turc.1991,
33, 75.
6. Chen, R. J.; Jin, S. Z.; Yaowu Fenxi Zazhi1995, 15, 56. 7. El Walily, A. F. M.; Razak, O. A.; Belal, S. F.; Bakry, R. S.;
J. Pharm. Biomed. Anal.1999, 21, 439.
8. Alizadeh, N.; Ershad, S.; Naeimi, H.; Sharghi, H.; Shamsipour, M.; J. Anal. Chem.1999, 365, 511.
9. Alizadeh, N.; Mahmodian, M.; Electroanalysis 2000, 12, 509.
10. Fakhari, A. R.; Ganjali, M. R.; Shamsipur, M.; Anal. Chem.
1997, 69, 3693.
11. Meier, C.; Amman, D.; Morf, W. E.; Simon, W. In Applications of Electrochemical Devices in Medical and Biological; Koryta,
J. ed.; John Wiley and Sons: New York, 1980. 12. Thomas, D. R.; Anal. Chim. Acta1986, 180, 289.
13. Hassan, S. S. M.; Mahmoud, W.; Othman, A.; Talanta1997,
44, 1087.
14. Ensai, A. A.; Allafchian, A. R.; J. Pharm. Biomed. Anal.2008,
47, 802.
15. Allafchian, A. R.; Ensai, A. A.; Saraji, M.; Anal. Lett. 2009,
42, 571.
16. Hassan, S. S. M.; Mahmoud, W.; Othman, A.; Talanta1997,
44, 1087.
17. Allafchian, A. R; Ensai, A. A.; J. Braz. Chem. Soc.2009, 21,
564.
18. The Pharmaceutical Codex, 11th ed., Pharmaceutical Press: London,1979.
19. Ammann, D.; Pretsch, E.; Simon, W.; Lindler, E.; Bezegh, A.; Pungor, E.; Anal. Chim. Acta1985, 171, 119.
20. Huser, M.; Gehrig, P. M.; Morf, W. E.; Simon, W.; Lindler, E.; Jeney, J.; Toth, K.; Pungo, E.; Anal. Chem.1991, 63, 1380.
21. Oesch, U.; Simon, W.; Anal. Chem.1980, 52, 692.
22. Bakker, E.; Pretsch, E.; Buhlmann, P.; Anal. Chem.2000, 72,
1127.
23. United States Pharmacopea, 31th. ed., The National Formulary 26, US Pharmacopeial Convention, Rockville: United States, 2008, vol. 2, 1514.
Submitted: December 10, 2009