!
!
Research and development expenditure in the business sector as
indicator of knowledge economy: the Portuguese experience
!" # $ %
# & ' ( ' ($ ) * )"
" # $ % &
' ( )
* # (
Research and development expenditure in the business sector as
indicator of knowledge economy: the Portuguese experience
Nuno Boavida ([email protected]) António Brandão Moniz ([email protected])
ABSTRACT
The objective of the paper is to help to understand recent changes in the structure of R&D activities, by analyzing data on the expenditure of the business sector in research and development (R&D). The results are framed in an international context, through comparison with indicators from the most developed countries, divided by technological intensity and economic activity.
The study reveals that the indicators of Portuguese R&D expenditure in the business sector are closely linked both to fiscal policy and to high foreign direct investment in knowledge-intensive industries. It also links these indicators to phenomena such as the abundance of skilled labor in pharmaceutical industries and the government intervention in some sectors of the economy (namely health and rail transportation).
JEL classification: L52; O14; O38
Key words: business sector; R&D; technology intensity; knowledge-intensive industries
1.
Introduction
This article attempts to contribute to a better understanding of the Portuguese knowledge economy through the analysis of one of its most important indicators: R&D expenditure in
the business sector1. In the first part, the general indicator of Portuguese R&D expenditure
will be compared with that of the most developed countries (Organization for Economic Cooperation and Development), particularly in what concerns the business sector of those economies. The second part will analyze data related to the Portuguese R&D expenditure
1 The study aims to analyze R&D activities in the business sector, in the optic of expenditure, the indicator
,
in the business sector throughout the last decade.
2.
Portuguese industrial R&D activities in an
international context
According to the Frascati Manual (2002), R&D activities “comprise creative work undertaken on a systematic basis in order to increase the stock of knowledge, including knowledge of man, culture and society, and the use of this stock of knowledge to devise new applications.” (p.30)
A wide variety of indicators can be employed to measure national efforts put into R&D. Input indicators, relative to expenditure and staff in R&D, tend to be the most reliable, because they employ similar data gathering methods and have generally been compiled for a relatively long period of time by national statistics centers.
These indicators are defined in the Frascati Manual, created in 1963 by Organization for Economic Cooperation and Development (OECD) countries and revised three times since. This manual is the best existing reference for gathering statistical information in the area of science and technology in developed countries. Note, however, that the existing data pertaining to resources allocated to R&D is also determined by diverse characteristics of national statistics, especially by the inquiries’ extent of coverage (in terms of industries, company size, sampling methods and frequency of the studies).
When establishing international R&D intensity comparisons, one of the most used indicators is the total expenditure in R&D. This indicator represents the sum of all domestic expenditure in R&D-related activities in a given year. However, GDP must also be taken into account in order to, not only understand the national engagement in the area of R&D, but also effectively assess the intensity of the national R&D effort in comparison with other economic activities. The GDP rate helps to put into relation the differences between countries, by providing insight into the share of national wealth that a country dedicates to these kinds of activities. In countries with big economies, however, this indicator of R&D intensity is less reliable and can mask significant efforts in R&D activities.
The Portuguese Business R&D expenditure grew gradually from 162 Millions dollars2 in
1995, 434 in 2003, 565 in 2005 and 1141 in 20073. The Portuguese Business R&D
intensity4 has also increased consistently in the past, growing from 0.5 per cent in 20035,
1.0 per cent in 20056 up to 1.2 per cent in 20077. During this period the country improved
2 Million 2000 dollars, constant prices and using Purchasing Power Parities (PPP)
3 Main Science and Technology Indicators 2009-1
4 Business enterprise expenditure on R&D (BERD) as a percentage of value added in industry
5 OECD STI 2005
6 OECD STI 2007
its relative position, ranking 26th out of 31 economies in 20038, 27th out of 32 economies in
20059 and 24th out of 36 economies in 200710. Furthermore, the average annual real growth
rate of Portuguese business R&D expenses was 12.5 per cent between 1995 and 2005
(ranking 4th out of 35 economies)11 and 18.8 per cent between 1997 and 2007 (ranking 3rd
out of 35 economies)12. In conclusion, Portugal presents a relatively low (although
growing) R&D expenses and intensities, when compared with other developed and
emerging economies13. But although its R&D expenses and intensity rates are relatively
small, Portugal did experienced significant R&D average annual real growth rates.
For detailed analysis and international comparisons, the R&D effort is generally divided into four sectors of execution: Companies, Superior Education, Government and Non-profit Institutions. Beyond these sectors, R&D activities can be divided according to sources of financing into five categories: the four execution sectors and foreign funds.
According to OCDE databases, the percentage of R&D expenditure has changed not only when considering the source of financing (as a percentage of the national total), but also the source of execution (see Figures in annex 1). In fact, the percentage of GERD financed by industry grew from 19 per cent, 32 per cent, 36 per cent, 47 and 48 per cent, respectively, in 1995, 2003, 2005, 2007 and 2008; and similarly, the percentage of GERD performed by the Business Enterprise sector grew from 23 per cent, 33 per cent, 38 per cent, 51 per cent
and 50 per cent, respectively, in 1995, 2003, 2005, 2007 and 2008 (47 per cent for 200914).
Although there were some structural differences in the distribution of the Portuguese industrial R&D from 1995 to 2007, when the comparison is made internationally (with the available data on OECD.stat in 2008 - see annex 1), the percentage of Portuguese GERD
financed by industry ranked 19th out of 30 economies and, similarly, the percentage of
GERD performed by Business ranked 29th out of 34 economies. Consequently, the
percentage of R&D expenditure remained internationally at low levels and always below the OECD average or even the EU27 in 2008.
The historical difficulties that Portugal faced in involving private efforts in R&D activities led Mateus and Antunes (2000) to note that these characteristics may represent “the answer that society has found to face the incapacity of the private sector”. However, this author also pointed out that the excessive centralization of R&D in the sectors of government and higher education contributed to the inefficiency of Portuguese scientific research. Currently, although the national efforts can clearly be identified, when R&D expenditure is internationally compared the Portuguese achievements remain inexpressive.
There are several possible explanations for the private sector’s incapacity to face the
8 OECD STI 2005
9 OECD STI 2007
10
OECD STI 2009 11
OECD STI 2007 12 OECD STI 2009
13 These studies published in the collection “OECD Science, Technology and Industry Scoreboard” included
some emerging economies that are not OECD members, such as Israel, South Africa, China and the Russian Federation.
14 Provisional data from the Portuguese R&D Survey 2009:
-challenges of the knowledge society:
1) The weak technological orientation of the Portuguese economy is reflected in industrial
R&D. In fact, Portugal presents an economic specialization with many established activities of low technological intensity (Mateus and Antunes 2000: 10), such as shoes and textile manufacturing. In this context, it is natural that the R&D activities associated with these economic activities also have a small dimension.
2) The pattern of specialization of Portuguese export activities shows a closer association
with the mass production of goods and equipments that have been developed in other economies rather than with the technological development of new products.
3) Portuguese investment in defense and security systems is not associated with the effort
in R&D of the private sector. In fact, the almost inexistence of military and security R&D is a result of the direct import of military equipment, which is done generally without need for national compensations that include the need to known R&D activities.
2.1
Military R&D
When analyzing the scientific and technological potential of a country, it is necessary to take into account the impact of R&D activities that are promoted by the departments of defense and economy. This issue is rather important, as several technological innovations with commercial application result from R&D activities promoted by the military and/or the security sectors.
However, the secrecy associated with military activities, and in particular with the budget and expenditure in defense, is an obstacle to accurate quantifications and often promotes speculation. The most approximate quantitative analysis one can reach is based on the indicator that relates the percentage of military R&D expenditure with the total budget for
R&D (GBAORD15). This indicator is therefore to be used with caution, once the public
R&D budget has not the same weight in all countries. Thus, the weight of military R&D budget in the total governmental R&D budget has different meanings according to different countries. In Japan that weight can be minor than the one in Portugal. Further studies can
be done in that direction. %. / & & ( ( . . ( 0 120
& ( . 120 & 34#0 (
Figure 1 - Defence Budget R&D as a percentage of Total GBAORD
Source: OCDE Main Science and Technology Indicators 2009-1
This indicator reveals that the OECD countries that produce weapons and other equipment associated with the defense and security industries give a larger governmental budget share to military R&D. France, Sweden, the U.S. and the U.K. are examples of this. In these countries, the industrial base of defense and security promotes innovation and increases expenditure and human resources in R&D activities. On the other hand, countries without a strong connection between R&D and the defense sector also lack the strong industrial component, which is generally established around the military and security chains.
Since countries like Portugal do not have a strong contract research component in the Defense sector, one should bear this in mind when analyzing international cross country comparisons. It is thus important to take into account the fact that R&D expenditure in the business sector covers R&D activities carried out in the sector, by company or investigation institutes, disregarding the origin of the funding. On the other hand, while the sectors of government and higher education also execute R&D activities, the industrial R&D is generally linked to the creation of new products and production techniques as well as to the efforts of innovation in the market place.
5
public, generally at an economically significant price. Private not-for-profit institutes that serve these companies are also included in the definition.
In an analysis of the evolution over the years, it is important to take into account that the average growth rates per year are high, when the base values of the country are very low. But when the growth rates remain high and constant throughout a decade - like it happened in Portugal - it is important to understand the causes of the phenomenon. As a result, this significant effort to grow the R&D expenditure in the business sector will be examined with more detail in the next chapter. The aim is to identify the origin and the nature of this trend and to understand its implications to the national development effort.
2.2
R&D activities in the business sector by technology intensity
All industries create and/or explore technology and knowledge. But some do it more intensely than others. Assessing the importance of technology and knowledge in an industry requires a thorough analysis of the product leaders in technology goods, was well as of the activities that intensely use high technology or that require highly skilled labor to explore the benefits of technological innovations.
The best way to measure industries with intense technology and knowledge is to use the OECD Science, Technology and Industry Scoreboard. This index classifies manufacturing industries in terms of technology intensity, that is, industries where the technological effort is seen as a major determinant of productivity growth and international competitiveness. Technology intensity is classified in the table as high, average-high, average-low, and low. This classification is based on the groups that were created after the OECD ranked industries in 12 countries in accordance with the average for 1991-1995 of R&D intensity.
One should note that the scoreboard created to analyze the knowledge intensity in the service sector presents more difficulties. On the one hand, it reflects a relatively limited concept of knowledge intensive services and, on the other hand, it does not include sufficient data for comparison purposes. For instance, real estate activities were not included (CEA 70), while postal and telecommunications services, financial intermediation were, except for insurance and pension funds (CEA 65). Insurance, pension funds and other complementary social security activities (CEA 66), auxiliary activities of financial intermediation (CEA 67) and, lastly, rental of equipment and machinery without staff and personal and household goods (CEA 71), information technology activities (CEA 72), research and development (CEA 73) and other services activities provided mostly to companies (CEA 74).
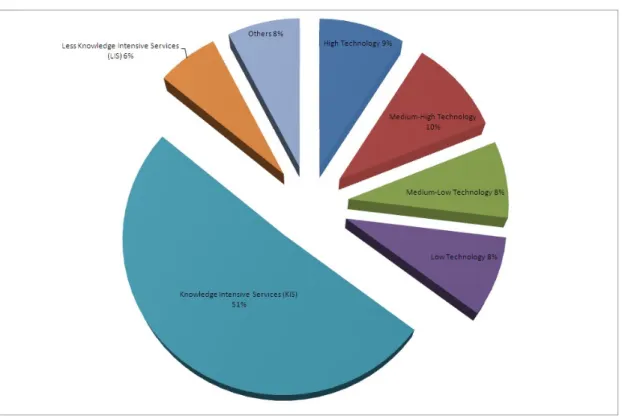
%. 6 & ( ( . ( 120 6 ( . (
7 . &7 7 88
Figure 2 – Distribution of R&D expenditure in the business sector, by technology intensity (2008)
Source: GPEARI/MCTES, 2008 R&D Survey
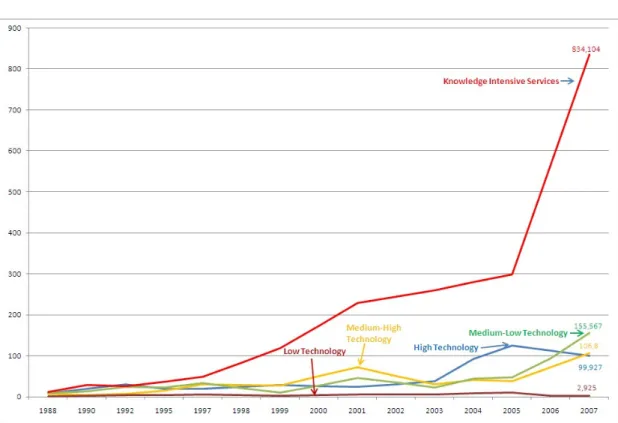
Figure 3 shows the evolution of R&D expenditure of the Portuguese business sector from 1995 to 2005, divided by sector of technology intensity.
Figure 3 – Evolution of R&D expenditure in the business sector, by technology intensity
Note: Millions of €, current prices.
Source: OECD - Data extracted on 27 Jan 2011 10:59 UTC (GMT) from OECD.Stat - Dataset: Business enterprise R-D expenditure by industry
One can observe that all sectors of technological intensity have been growing in terms of expenditure with R&D activities. However, the sectors with highest technology intensity are the ones that stand out for their greater capacity to grow. For example, the high technology sector in 2005 was already responsible for 27 per cent of the total R&D expenditure in the business sector. The sectors with low technology intensity are the ones that grew the least. These facts help sustain the idea that the coexistence of two economies in Portugal: one, more linked to the knowledge economy and to the most dynamic sectors of society, with capacity to capture more investment (and the best human resources) and more proficient in R&D activities; and another less dynamic economy, without a tendency to develop R&D activities and, consequently, with less need to invest in knowledge and to capture highly skilled labor. This economy is, nevertheless, of significant importance to the national economy and employment.
8
and, in a significant way, the report of R&D to statistical authorities. The SIFIDE was first introduce in 1997, discontinued in 2003 and reinstated with better incentives in the fiscal year 2006.
The analysis of Figure 4 shows three particular sectors that have evolved steadily throughout the decade:
1) Services with intensive knowledge have become the sector with the highest level of
R&D expenditure in Portugal. In fact, while in 1995 this sector had expenditure levels as large as the sector of high technology intensity, by the end of the decade it is the clear leader in expenditure in R&D activities. The re-introduction of R&D tax incentives in 2006 explains the significant increase in the expenditure of knowledge intensive services.
2) The sector of high technology intensity went to an important growth period between
2003 and 2005 (AAGR16 01-03=27 per cent and AAGR 03-05=45 per cent).
3) The sector of medium-high technology intensity had an unusual growth in 1997
(AAGR 95-97=38 per cent) e 2001 (AAGR 99-01=56 per cent).
The above-mentioned patters are confirmed by the analysis of the evolution of a number of variables: total staff numbers, number of research employees, number of companies engaged in R&D activities.
In this context, it is important to know which industries contributed the most to these patterns. Figures 4, 5 and 6 show the evolution of business R&D expenditure by the different Classifications of Economic Activity (CEA) that fit in these sectors of technology intensity.
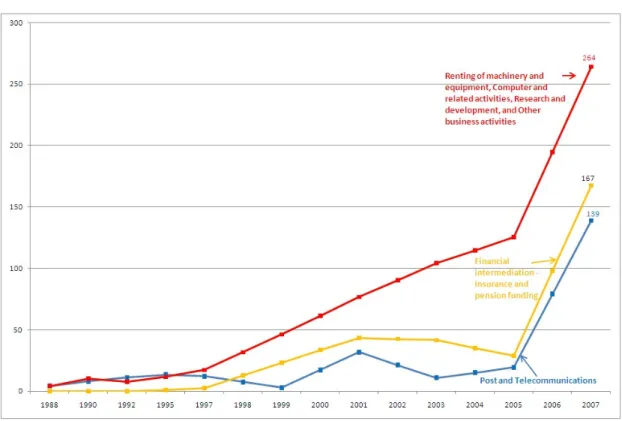
The following figure 4 shows the evolution of business R&D expenditure by CEA in the knowledge intensive services, from 1988 to 2007.
Figure 4 – Evolution of business R&D expenditure by CEA in the Knowledge Intensive Services (1988-2007)
Note: Millions of €, current prices. Several estimates and projections by OECD and authors.
Source: OECD - Data extracted on 27 Jan 2011 10:59 UTC (GMT) from OECD.Stat - Dataset: Business enterprise R-D expenditure by industry
3 ( . 5 . 91 & . (7 : ;<
9# ( ( ;< 91 ( . 0 ; 93 . (
; ( ( . & . ( ( 120
%. &( #4= > / & (
> ! " ( . ( ( < . 9" ( ; .
( 7 ? / & ( ) 7< . 9+
% ; / ( ( ( & 120 6 ( . 9"
%. 6 & ( . / . 120 6 ( 7 #4= .
( ? / & < ( -
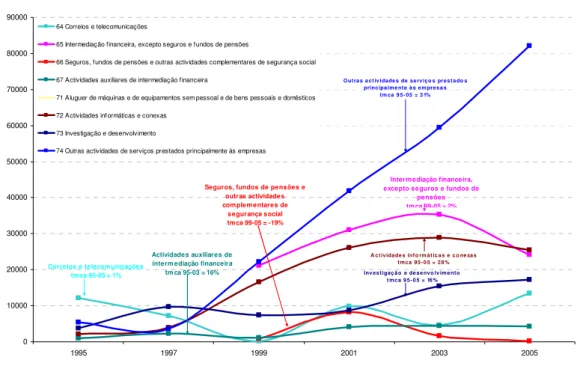
88-Figure 5 – Evolution of business R&D expenditure by CEA in the services of intense knowledge
0 10000 20000 30000 40000 50000 60000 70000 80000 90000
1995 1997 1999 2001 2003 2005
64 Correios e telecomunicações
65 Intermediação financeira, excepto seguros e fundos de pensões
66 Seguros, fundos de pensões e outras actividades complementares de segurança social 67 Actividades auxiliares de intermediação financeira
71 Aluguer de máquinas e de equipamentos sem pessoal e de bens pessoais e domésticos 72 Actividades inf ormáticas e conexas
73 Investigação e desenvolvimento
74 Outras actividades de serviços prestados principalmente às empresas
Seguros, fundos de pensões e outras actividades com plem entares de
segurança social tm ca 99-05 = -19%
Correios e telecom unicações tm ca 95-05 = 1%
Interm ediação financeira, excepto seguros e fundos de
pensões tm ca 99-05 = 2%
Actividades auxiliares de interm ediação financeira
tm ca 95-03 = 16%
A c t ividade s inf o rm át ic a s e c o ne xa s t mc a 95 - 0 5 = 28 %
Inv es t igaç ã o e de se nvo lv ime nt o t mc a 9 5 - 0 5 = 16 %
O ut ra s a ct iv idade s de se rv iço s pres t a do s princ ipa lme nt e à s e m pres a s
t m ca 9 5- 05 = 3 1%
Note: Thousands of €, current prices
Source: GPEARI/MCTES, Survey of the national potential in science and technology
One can observe that the aggregate “Other service activities provided mainly to companies” [Outras actividades de serviços prestados principalmente às empresas] (CEA 74), is the one with most R&D expenditure in the sector since 1999 in Portugal. The aggregate has witnessed an average annual growth rate (AAGR, or TMCA in Portuguese,) of 31 per cent in the considered period.
,
The following table presents the evolution of the R&D expenditure and its distribution since 2001 to 2007 in the KIBS category and in other sectors of the economy.
Table 1 – Evolution and distribution of Business R&D expenditure in KIBS and other sectors of the economy
Value % Value % Value % Value %
26 8% 29 9% 26 6% 108 11%
9 3% 15 5% 17 4% 19 2%
42 13% 59 18% 82 18% 137 14%
77 23% 104 31% 125 27% 264 26%
163 49% 179 53% 203 44% 608 60%
160 48% 151 45% 213 46% 343 34%
8 2% 8 2% 46 10% 60 6%
330 100% 338 100% 462 100% 1011 100%
OTHER SECTORS
Research and development Other business activities
MANUFACTURING SECTOR SERVICES SECTOR
Real estate, renting and business activities
CEA 2001 2003 2005 2007
Computer and related activities
TOTAL BERD*
Note: Millions of €. *BERD = Business Expenditure on Research and Development
Source: Based on data extracted on 26 Nov 2012 10:33 UTC (GMT) from OECD.Stat
It can be observed in Table 1 that the business expenditure of KIBS was concentrated in the “Other business activities” in 2007 and, increasingly in Computer and related activities. The distribution of the latter expenditures increased from 8 per cent in 2001 to 11 per cent
in 2007 and the former expenses from 13 per cent to 14 per cent during the same period.
Furthermore, the CEA of “Real estate, renting and business activities” increase its share of expenditure from 23 per cent to 26 per cent.
In addition, there was a terciarization of business R&D. In fact, the Services sector
expenditure increased from 163 to 608 Millions of Euros from 2001 to 2007, whereas de “Manufacturing sector” increased only from 160 to 343 Millions of Euros, respectively.
The following figure presents the evolution of business R&D expenditure by CEA of high technology intensity, from 1995 to 2005.
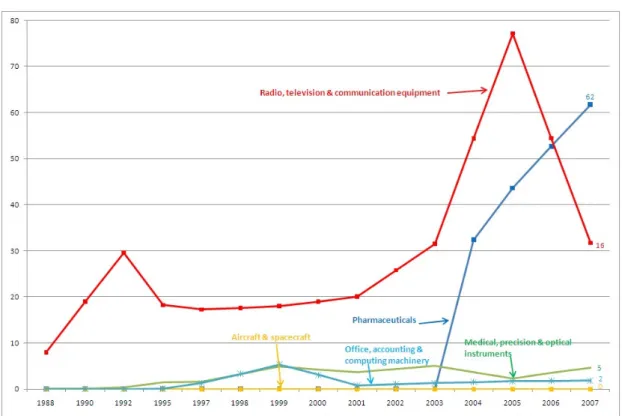
Figure 6 – Evolution of business R&D expenditure by CEA of high technology intensity
Note: Millions of €, current prices. Several estimates and projections by OECD and authors.
Source: OECD - Data extracted on 27 Jan 2011 10:59 UTC (GMT) from OECD.Stat - Dataset: Business enterprise R-D expenditure by industry
As previously mentioned, this intensity sector showed an important growth rate since 1997. The CEA of Radio, television & communication equipment was responsible for most R&D expenditures.
-The next figure presents the evolution of business R&D in the high technology sector by CEA.
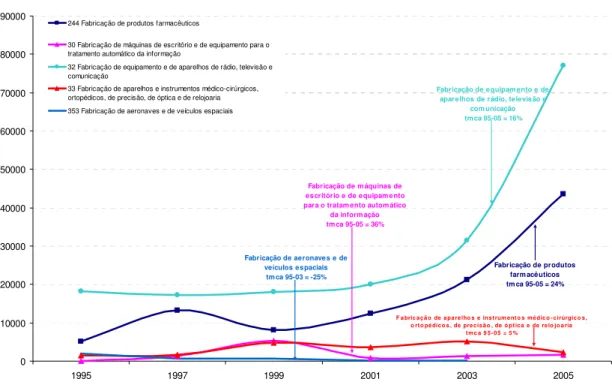
Figure 8 – Evolution of business R&D expenditure by CEA of high technology intensity
0 10000 20000 30000 40000 50000 60000 70000 80000 90000
1995 1997 1999 2001 2003 2005
244 Fabricação de produtos farmacêuticos
30 Fabricação de máquinas de escritório e de equipamento para o tratamento automático da informação
32 Fabricação de equipamento e de aparelhos de rádio, televisão e comunicação
33 Fabricação de aparelhos e instrumentos médico-cirúrgicos, ortopédicos, de precisão, de óptica e de relojoaria 353 Fabricação de aeronaves e de veículos espaciais
Fabricação de m áquinas de escritório e de equipam ento para o tratam ento autom ático
da inform ação tm ca 95-05 = 36%
Fabricação de produtos farm acêuticos tm ca 95-05 = 24%
F a bric a ç ã o de a pa re lho s e ins t rum e nt o s mé dic o - c irúrgic o s , o rt o pé dic o s , de pre c is ã o , de ó pt ic a e de re lo jo a ria
t mc a 9 5 - 0 5 = 5 %
Fabricação de equipam ento e de aparelhos de rádio, televisão e
com unicação tmca 95-05 = 16%
Fabricação de aeronaves e de veículos espaciais tm ca 95-03 = -25%
Note: Millions of €, current prices. Several estimates and projections by OECD and authors.
Source: OECD - Data extracted on 27 Jan 2011 10:59 UTC (GMT) from OECD.Stat - Dataset: Business enterprise R-D expenditure by industry
The observation of Figure 8 reveals that, since 1995, the manufacture of goods and equipment related to radio, TV and communications [Fabricação de equipamentos e de aparelhos de radio, televisão e comunicação] (CEA 32) is the activity of high technology intensity with the greatest R&D expenditure in Portugal. In addition, this expenditure increased at the average annual rate of 56 per cent between 2003 and 2005.
One should also note that in 2005 this industrial activity was responsible for 17 per cent of the total R&D expenditure, despite only representing 2 per cent of the total number of companies with R&D activities. This reveals that the growth between 2003 and 2005 is probably related to the influence of big established firms in Portugal that resulted from foreign investment.
total number of companies with R&D activities. The importance of the pharmaceutical products relies mostly on the R&D carried out by established Portuguese medium size companies.
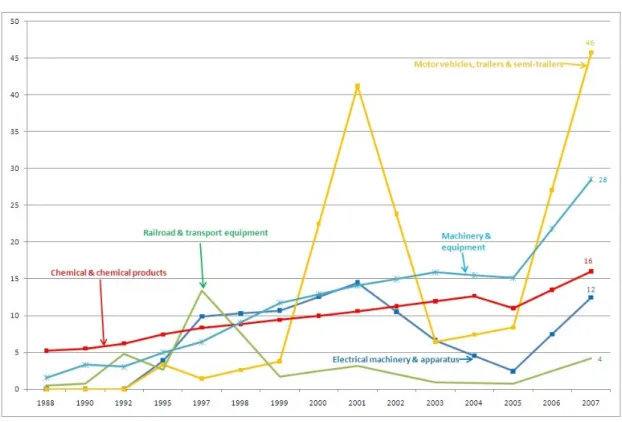
The following figure shows the evolution of R&D expenditure in the business sector by CEA of medium/high technology intensity between 1995 and 2005.
Figure 9 – Evolution of R&D expenditure in the business sector by CEA of medium/high technology intensity
Note: Millions of €, current prices. Several estimates and projections by OECD and authors.
Source: OECD - Data extracted on 27 Jan 2011 10:59 UTC (GMT) from OECD.Stat - Dataset: Business enterprise R-D expenditure by industry
5
%. 6 & ( ( . 120 6 ( .
@. &. . &7 ( 7 #4=
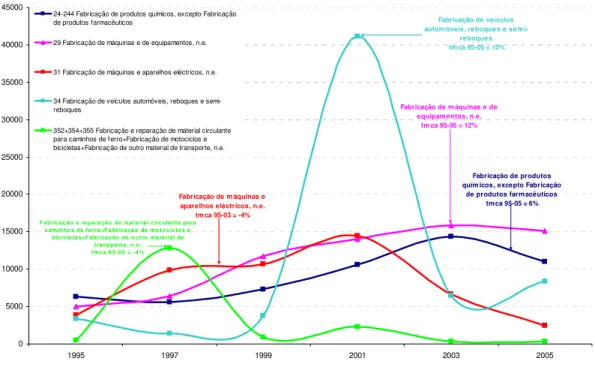
Figure 10 – Evolution of R&D expenditure in the business sector by CEA of medium/high technology intensity 0 5000 10000 15000 20000 25000 30000 35000 40000 45000
1995 1997 1999 2001 2003 2005
24-244 Fabricação de produtos químicos, excepto Fabricação de produtos farmacêuticos
29 Fabricação de máquinas e de equipamentos, n.e.
31 Fabricação de máquinas e aparelhos eléctricos, n.e.
34 Fabricação de veículos automóveis, reboques e semi-reboques
352+354+355 Fabricação e reparação de material circulante para caminhos de ferro+Fabricação de motociclos e bicicletas+Fabricação de outro material de transporte, n.e.
Fabricação de m áquinas e de equipam entos, n.e.
tm ca 95-05 = 12%
Fabricação de produtos quím icos, excepto Fabricação
de produtos farm acêuticos tm ca 95-05 = 6%
Fabricação de veículos autom óveis, reboques e sem
i-reboques tm ca 95-05 = 10%
F abric aç ão e re pa ra ção de m a te ria l c irc ulant e para c am inho s de f e rro +F a brica çã o de mo t o cic lo s e
bicicle ta s+F abricaç ão de o utro ma t erial de t ra ns po rt e , n.e. t mc a 9 5- 03 = -4 %
Fabricação de m áquinas e aparelhos eléctricos, n.e.
tm ca 95-03 = -4%
Note: Thousands of €, current prices
Source: GPEARI/MCTES, Survey of the national potential in science and technology
In 1997, the manufacture and repair of railroad material [Fabricação e reparação de material circulante para caminhos de ferro] was the industrial activity of medium/high technology intensity with the highest growth rate (this figure aggregates other economic activities which, after a more detailed examination, did not reveal significant R&D expenditures).
In 2001, the industrial activity with an unusual increase in R&D expenditure was the manufacturing of motor vehicles, trailers and semi-trailers [Fabricação de veículos automóveis, reboques e semi-reboques] (CEA 34). One should also point out that this
industry went through an outstanding annual growth rate of 230 per cent in R&D
expenditure from 1999 to 2005. In addition, in 2001, it was the second most important
activity of the national total, accounting for 12 per cent of R&D expenditure, despite
representing only 3 per cent of the total number of Portuguese companies with R&D
3.
Conclusions
The comparison with other developed economies revealed that Portugal has a national S&T system with low intensity in R&D, not only in general terms, but particularly in the business sector. The business R&D expenditure has increased and, to a certain extent, its variations seemed dependent of the introduction of tax incentives policies to R&D activities. These policies changed also along the recent years and influenced the reporting of the volume of business R&D expenditure.
However, in the period between 1995 and 2005 Portugal revealed significant annual R&D growth rates. These rates were the result of growth in services, foreign investment in telecommunications and automotive industries, as well as national investment in railroad material. Furthermore, the international comparison shows that the system has a strong component of public investment, despite not having a strong military system associated with R&D.
When observing the evolution of R&D activities in the Portuguese economy, one can conclude that:
1) The knowledge-intensive services have assumed an outstanding position in the past
decade, in terms of R&D expenditure in the Portuguese business sector. The CEA that most contributed to this phenomenon was the one related to other activities of services provided to companies and, recently, the computer and related activities.
2) The sector of high technology intensity showed a high growth rate since 2003. The
CEA that most contributed to this strong growth were the manufacture of goods and equipment related to radio, TV and communications and, to a lesser extent, the manufacturing of pharmaceutical products.
3) The years 1997 and 2001 presented sharp increases in activities of medium-high
technology intensity, although they had no continuity. The industrial activity responsible for the 1997 spike was the manufacturing and repair of railroad material. In 2001, the unusual increase in R&D expenditure was the result of a boost in activities of manufacture of motor vehicles, trailers and semi-trailers.
It can be concluded that the above mentioned characteristics are associated with a structural
change, based on the emergence of phenomena such as the terciarization of Portuguese
Bibliography
OCDE. 2007. Science, Technology and Industry Scoreboard 2007, OCDE, Paris
OCDE. 2009. Science, Technology and Industry Scoreboard 2009, OCDE, Paris
Frascati Manual (2002), OECD, Paris
JNICT (1986) “Indicadores de Ciência e Tecnologia Portugal 1964-1982”, Lisboa
JNICT (1993) “Planeamento Plurianual das actividades de Investigação Científica e Desenvolvimento Tecnológico 1991”, Lisboa
Lopes, José Silva(2004) “A economia portuguesa no século XX” ICS, Lisboa
OCT (1997) “Principais Indicadores de Ciência e Tecnologia em Portugal 1988-1995”, Lisboa
Mateus, A. e Antunes, A. (2000) “O desenvolvimento tecnológico português – Diagnóstico
e perspectivas no início de 2000”.
http://docentes.fe.unl.pt/~amateus/publicacoes/ET2000/Relatorio.PDF
NSF (2008) “Digest of Key Science and Engineering Indicators – National Science Board”
Hatzichronoglou, T. (1997), “Revision of the HighTechnology Sector and Product Classification”, OECD Science, Technology and Industry Working Papers, 1997/2, OECD
Publishing. doi: 10.1787/134337307632.
http://www.oecd-ilibrary.org/docserver/download/fulltext/5lgsjhvj7nkj.pdf?expires=1296127288&id=0000& accname=guest&checksum=13036A15B9DA97A22B804F7DEF845955
OECD STAN industry list: http://www.oecd.org/dataoecd/5/30/40729523.pdf
8
Acronyms
Average Annual Growth Rate AAGR
Classification of Economic Activity CEA
European Union EU
Gross Domestic Product GDP
Department of Planning, Evaluation and International Relations GPEARI
Inquiry to the National Scientific and Technologic Potential IPCTN
National Bureau for Science and Technology Research JNICT
Ministry of Science, Technology and Superior Education MCTES
Observatory of Science, Technology and Superior Education OCES
Observatory of Sciences and Technologies OCT
Organization for Cooperation and Economic Development OECD
Research and Development R&D