Uminho | 2015
Universidade do Minho
Escola de Ciências
Diana Filipa Pereira Rodrigues
Study of the retinoic acid regulated genes
in the rodent hypothalamus controlling
growth and appetite and the potential for
the epigenetic control
Outubro de 2015
Diana Filipa Pereira Rodrigues
Study of t
he re
tinoic acid regulated genes in t
he rodent h ypo thalamus controlling gro wt h and appe tite and t he po tential for t he epigene tic control
Diana Filipa Pereira Rodrigues
Study of the retinoic acid regulated genes
in the rodent hypothalamus controlling
growth and appetite and the potential for
the epigenetic control
Outubro de 2015
Dissertação de Mestrado
Mestrado em Bioquímica, especialização em Biomedicina
Trabalho efetuado sob a orientação do
Professor Doutor Peter McCaffery
e do
Professor Doutor Pedro M. Santos
Universidade do Minho
DECLARAÇÃO
Nome: Diana Filipa Pereira Rodrigues
Endereço eletrónico: [email protected] Cartão do Cidadão: 232196850
Título da dissertação de mestrado:
Study of the retinoic acid regulated genes in the rodent hypothalamus controlling growth and appetite and the potential for the epigenetic control.
Estudo de genes regulados pelo ácido retinóico na região do hipotálamo de roedores que controla o crescimento e apetite, e potencial regulação epigenética.
Orientador: Professor Doutor Peter McCaffery Co-orientador: Professor Doutor Pedro M. Santos
Ano de conclusão: 2015
Designação do mestrado e ramo do conhecimento:
Mestrado em Bioquímica, especialização em Biomedicina
É AUTORIZADA A REPRODUÇÃO INTEGRAL DESTA DISSERTAÇÃO APENAS PARA EFEITOS DE INVESTIGAÇÃO, MEDIANTE DECLARAÇÃO ESCRITA DO INTERESSADO, QUE A TAL SE COMPROMETE.
Universidade do Minho, 20 de Outubro de 2015
"The brain is a tissue. It is a complicated, intricately woven tissue, like nothing else we know of in the universe, but it is composed of cells, as any tissue is. They are, to be sure, highly specialized cells, but they function according to the laws that govern any other cells. Their electrical and chemical signals can be detected, recorded and interpreted and their chemicals can be identified; the connections that constitute the brainís woven feltwork can be mapped. In short, the brain can be studied, just as the kidney can."
V
ACKNOWLEDGEMENTS
I would like to start this document by expressing my most sincere gratitude to my supervisor Dr. Peter McCaffery for receiving me at his research group and guiding me throughout this last year. There is not enough words to thank all the support provided not only during my stay in Aberdeen as well in the months preceding my move. His constant availability to help, kindness, competence, pertinent advice and suggestions will always be remembered. Furthermore, I’m grateful to Patrick Stoney, the person who guided me in lab and from whom I learned a lot, for the professional inspiration, the brainstormings and patience in teaching me. I’m deeply grateful to both of you. Thanks for sharing your scientific knowledge with me.
I am also grateful to my co-supervisor, Professor Pedro Santos, who inspires me all the time with your love for science, also for your help and advices. It is a pleasure to learn from professors like you.
I must add a special word of thanks to Dr. Wenlong Huang and Dr. Tyler Stevenson, two brilliant scientific minds that I had the pleasure to meet, for sharing their scientific work with me and whose valuable suggestions deepened my knowledge.
My special thanks to all my colleagues at the 2.25 laboratory for such a pleasant working environment. I would like to particularly express my gratitude to Anna Ashton and Thabat, my lab partners, and also Marieta, Eva, Ali and Anna Riley for the help and promptness that all of you demonstrated over the time. It was a pleasure to share the office and laboratory with people that made me smile all the time. To our honours students, Ugne, Ellen, Susy and Alastair for the amazing months together and the happiness that you brought to the group, not to mention the cakes. I miss you all already.
I’m very grateful to my lunch group for integrating me, not only in the IMS as well in the Scottish society.
In addition, I also want thanks to Kamilla for the valuable friendship she presented me with. You’re the best flatmate I will ever meet. I’m in Porto waiting for you!
I would like to thank to my “road tripers” Ana, António, Lucas and Heloisa for their friendship and the amazing trips we made together throughout. Without you my stay in Aberdeen would not
VI
have been the same. You occupy a very special place in my heart. All the dinners, all the travels, all the parties, all the nonsense and hilarious moments are memories that I'll remember for the rest of my life. I'm grateful to have found such special people like you. "Oube", you have no idea how important all of you have become to me. In Brazil, USA, Norway or Portugal we shall meet again.
Thanks to the portuguese community working in IMS and oil industry for the portuguese meetings and to make me feel at home in Aberdeen. I’m grateful to them all for their friendship and important advices on my future career and personal life. A special thanks to Beatriz for the coffees at Aromas and for our long conversations, and to Bernardo for all the kindness, care, help and encouragement.
To all my friends that, one way or another, were there for me. A very special thanks to Ezequiel, Marco, Mini, Humberto, Andreia, Bete, Cris, Luísa, Mário, Rui and Jorge to have kept me present in their lives even at distance. To my girl Paulina not only for taking care of all the matters related with my exchange period in University of Minho, but also for visiting me in Scotland together with Diogo and Andreia. To Sara for the constants updates about Portugal and for all the inspiring conversations. To Adriana and Cláudia that more than colleagues are the best friends and patterns that I could have on my side. To my friend Miguel, for his treasured friendship, loyalty and for existing in my life. To Joana and André, for making the thesis writing in moments of happiness. I definitively feel blessed for having friends like you all.
The contribution of University of Minho and more specially the International Relations Office, for the granted financial support is also deeply acknowledged.
Lastly, and most importantly, I would like to extend my thanks to my parents and sister, the ones I love the most, for their unconditional love and for the constant support and help provided in all aspects throughout this journey. You are my truly inspiration and love. Everything I have and I am, I owe to you. Thank you so much for allow me to follow my dreams, even when it involves sacrifice.
VII
ABSTRACT
Study of the retinoic acid regulated genes in the rodent hypothalamus controlling growth and appetite and the potential for the epigenetic control.
In obese people the physiological system that should maintain normal energy balance no longer works correctly. Seasonal animals, such as hamsters and F344 rats, provide excellent models for investigating growth- and weight-related changes in the hypothalamus, the major region of the brain regulating feeding behaviour, metabolism and body weight. Evidence suggests that epigenetic mechanisms regulate the expression of hypothalamic genes affecting energy balance. At same time, it is also known that inflammatory responses are one key to changes in the hypothalamus. This study explored a potential role of HDAC4 and HDAC6, enzymes that set up epigenetic change, in modulating the inflammatory signalling pathways in the hypothalamus, as well the possible role of these HDACs in controlling RA and TH signalling pathways which are known to be key for hypothalamic regulation of energy balance.
This study showed that HDAC4 and HDAC6 were photoperiodically regulated in the hypothalamus of F344 rats with higher expression in rats under long-day photoperiod (16h light:8h dark), relative to short-day (8h light:16h dark). The NF-κB pathway, a central mediator of inflammatory responses, was considered a possible target of HDAC4 and HDAC6 action. To investigate this HDAC4/5 inhibitor LMK235 and HDAC6 inhibitor tubastatin A were used to evaluate the effect of HDAC inhibition on gene expression of NF-κB target genes. Inhibition of these HDACs were found to potentially influence the control, by TNF and LPS, of expression of genes required for AP1, protein kinase C and PTP1B pathways. The effect of HDAC6 inhibition on the activation of MAPK pathways was also studied. Only p38 kinase activation by TNF was shown to be affected by HDACs inhibition. However p38 inhibition did not change the capacity of HDAC inhibitors to alter TNF gene regulatory activity. Immunocytochemistry experiments indicated that both HDAC4 and HDAC6 were mainly localized in the nucleus of GT1-7 cells and SH-SY5Y cells, two neuronal cell lines. Further, the histone deacetylation activity of HDAC4 and HDAC6 was evaluated by studying the influence of HDACs inhibition in regulating the expression of the RAR-regulated genes, Cyp26A1 and RARȾ, and the THR-regulated gene Nrgn. The results pointed to possible regulation of TH- and RA-regulated genes by HDAC4 and 6. Finally, results suggested that RA and T3 metabolism was under control of inflammatory regulators.
Taken together, the results suggest a possible function of HDAC4 and HDAC6 in modulating the activity of inflammatory pathways in the hypothalamus.
IX
RESUMO
Estudo de genes regulados pelo ácido retinóico na região do hipotálamo de roedores que controla o crescimento e apetite, e potencial regulação epigenética.
Em pessoas obesas, o sistema fisiológico existente responsável pela manutenção do balanço energético não se encontra a funcionar corretamente. Animais sazonais tais como hamsters e ratos F344 são excelentes modelos para estudar alterações relacionadas com o crescimento e o apetite no hipotálamo, a principal região do cérebro que regula o comportamento alimentar, metabolismo e peso corporal. Estudos prévios sugerem que, no hipotálamo, a expressão de certos genes que afetam o equilíbrio energético estão sob o controle epigenético. Para além do referido, é também sabido que os processos inflamatórios desempenham um papel proeminente nas alterações hipotalâmicas. No presente trabalho investigou-se a potencial função da HDAC4 e HDAC6, duas enzimas responsáveis pela remoção de grupos acetil das histonas, na modulação dos processos inflamatórios no hipotálamo, bem como o possível papel destas HDACs no controlo das vias de sinalização do ácido retinóico (RA) e da hormona da tiroide (TH), duas vias conhecidas por desempenhar um papel crucial na regulação hipotalâmica do balanço energético.
Este estudo demonstrou que a HDAC4 e a HDAC6 são fotoperiodicamente reguladas no hipotálamo de ratos F344 com maior expressão em ratos sob condições que mimetizam dias de verão (16h de luz: 8h escuro) comparativamente a ratos sob condições que mimetizam dias de inverno (8h de luz: 16h escuro). O papel destas duas enzimas na regulação da expressão de genes regulados pelo NF-κB, um mediador central da resposta inflamatória, foi avaliada recorrendo ao uso de um inibidor para a HDAC4/5, o LMK235, e de um inibidor para a HDAC6, a tubastatin A. A inibição destas HDACs revelou uma potencial função da HDAC4 e HDAC6 em regular, através do TNF e do LPS, a expressão de genes requeridos para as vias de sinalização do AP-1, proteína cinase C e PTP1B. O efeito da inibição da HDAC6 na ativação das vias de MAPK foi também estudado, tendo-se verificado que apenas a ativação do p38 pelo TNF foi afetada pela inibição desta HDAC. No entanto a inibição do p38 não afetou a capacidade dos inibidores de HDACs em alterar a atividade reguladora do TNF . Estudos de imunocitoquímica realizados indicaram que tanto a HDAC4 como a HDAC6 se encontram localizadas principalmente no núcleo das células GT1-7 e SH-SY5Y, duas linhas de células neuronais. Além disso, a capacidade da HDAC4 e da HDAC6 em remover os grupos acetil das histonas foi também avaliada através do estudo da expressão dos genes regulados pelo RAR, Cyp26A1 e RARȾ, e do gene regulado pelo THR, o Nrgn, na presença dos inibidores LMK235 e tubastatin A. Os resultados apontam para uma possível regulação da via de sinalização do RA e da TH por estas enzimas. Por fim, foi ainda verificado que o metabolismo do RA e da TH poderá estar sob o controle de reguladores inflamatórios.
Em suma, este trabalho sugere uma possível função da HDAC4 e da HDAC6 em modular a atividade das vias inflamatórias no hipotálamo.
XI
LIST OF PUBLICATIONS
Rodrigues, D., Stoney, P., Helfer, G., Hay, E., Starr, R., Johnson, L., Bownman, E., Morgan, P., McCaffer, P. “The function of Histone Deacetylase HDAC4 in the Hypothalamus”, Poster Communication – Rowett - IMS Winter Symposium, Aberdeen, 2 December 2014
Rodrigues, D., Stoney, P., Helfer, G., Morgan, P., McCaffery, P. “Potential epigenetic modification of the lipid signalling factor retinoic acid to regulate hypothalamic control of energy balance and obesity”, Poster Communication – Lipids and Health: Risk, Reward and Revelation, London, 16-17 November 2015
Stoney, P., Helfer, G., Rodrigues, D., Morgan, P., McCaffery, P. (2015). Thyroid hormone activation of retinoic acid synthesis in hypothalamic tanycytes, Glia (accepted)
Stoney, P., Rodrigues, D., Morgan, P., McCaffery, P. A Seasonal switch in histone deacetylase gene expression in the rat with the potential to modulate both Tumour Necrosis Factor alpha and nuclear receptor activity”. To be submitted to Neuroscience.
XIII
TABLE OF CONTENT
ACKNOWLEDGEMENTS ... V ABSTRACT ... VII RESUMO ... IX LIST OF PUBLICATIONS ... XITABLE OF CONTENT ... XIII
LIST OF FIGURES ... XV
LIST OF TABLES ... XXI
LIST OF ABBREVIATIONS ... XXIII
CHAPTER I.INTRODUCTION ... 1
1.1. Seasonal Changes ... 3
1.2. Retinoic Acid Metabolism and its Signalling Pathway ... 9
1.3. Inflammatory Signalling Pathways ... 15
1.3.1. NF-κB Pathway ... 16
1.3.2. MAPK Pathway ... 17
1.3.3. Activation of NF-κB and MAPK signalling pathways by LPS and TNF ... 19
1.4. Epigenetics ... 22
1.4.1. DNA Methylation ... 22
1.4.2. Histone Modifications ... 23
1.5. Aim ... 25
CHAPTER II.MATERIALS AND METHODS ... 27
2.1. Chemicals ... 29
2.2. Cell cultures ... 29
2.3. Organotypic slice culture ... 30
2.4. RNA extraction and gene analysis by qPCR ... 30
2.5. Western blotting analysis ... 32
XIV
2.7. Statistical analysis ...34
CHAPTER III.RESULTS ...37
3.1. NF-κB pathway is activated by TNF in GT1-7 cells and by LPS in tanycytes...39
3.2. Class IIa HDACs can decrease TNF and LPS activity in hypothalamic cells. ...40
3.3. HDAC6 expression is photoperiodically regulated in the hypothalamus of F344 rats ...44
3.4. HDACs inhibition reduced the ability of TNF to activate p38 kinase, but p38 inhibition did not change the capacity of HDAC inhibitors to alter TNF gene regulatory activity ...46
3.5. TH and RA regulated genes were controlled by HDACs. ...49
3.6. HDAC6 and HDAC4 are localized predominantly in the nucleus in cultured cells. ...52
3.7. RA metabolism is under inflammation control ...54
CHAPTER IV.DISCUSSION ...57
CHAPTER V.CONCLUSIONS AND FUTURE PERSPECTIVES ...65
REFERENCES ...69
XV
LIST OF FIGURES
C
HAPTERI
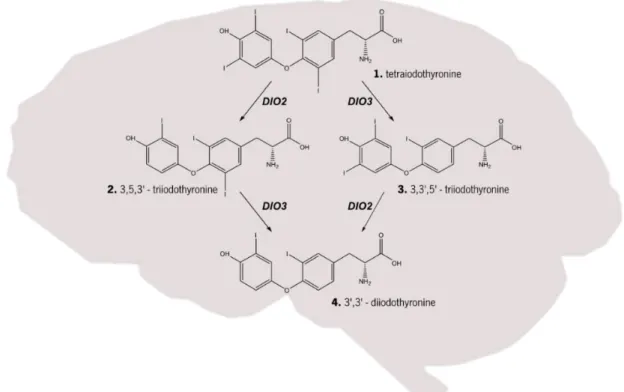
Figure 1 | Thyroid hormone metabolism. Within the brain the tetraiodothyronine (T4; structure 1) can be converted into the more active form 3,5,3 - triiodothyronine (T3; structure 2) by the action of type II iodothyronine deiodinase (DIO2) or the inactive form 3,3,5’- triiodothyronine (rT3; structure 3), an isomer of T3, by type III iodothyronine deiodinase (DIO3). T3 and rT3 can be converted into 3’,3’-diiodothyronine (T2; structure 4) by action of DIO3 and DIO2, respectively. Rodrigues (2015)... 5 Figure 2 | Regulation of energy balance by leptin and ghrelin. In the arcuate nucleus of the hypothalamus, orexigenic and anorexigenic neurons receive hormonal inputs and relay neuronal signals. Stimulation of these neurons leads to production of orexigenic peptides (promoting appetite), such as Neuropeptide Y (NPY) and Agouti-related peptide (AgRP), or anorexigenic peptides (decreasing appetite), as -melanocyte-stimulating hormone ( -MSH), one of several cleavage products of pro-opiomelanocortin (POMC), and cocaine amphetamine-related transcript (CART). Leptin is a hormone released from adipose tissue when there is an increase in the size of body-fat mass. Release of leptin leads to a decrease in appetite and an increase in fuel metabolism by stimulation of melanocortin-producing neurons, inhibiting neurons that produce the molecules NPY and AgRP. On the other hand, when of body-fat mass decreases ghrelin is released by the stomach, which leads to an activation of NPY/AgRP-expressing neurons, and consequently stimulates appetite. In this way, energy balance is restored, ensuring the homeostasis of the organism. Rodrigues (2015) ... 7 Figure 3 | Link between photoperiod and energy balance regulation. Schematic representation showing the main hypothalamic nuclei involved in energy balance and their interrelated connections (right side) as well the action of the hormones melatonin and leptin in these nuclei (left side). Melatonin, a hormone photoperiodically regulated, has its receptors expressed in dorsomedial (DMN) and suprachiasmatic nucleus (SCN). In turn, these nuclei have connections with others nuclei, namely the paraventricular nucleus (PVN) and lateral hypothalamic (LH), respectively, both connected to the arcuate nucleus (ARC), the most important nucleus in the regulation of energy balance. The ARC regulates feeding and energy expenditure though two different neuronal types, anorexigenic and orexigenic neurons, that project from the ARC to the PVN. Rodrigues (2015) ... 8 Figure 4 | The major metabolic pathway of retinol in nonvisual mammalian cells. Retinol is obtained from dietary in the form of retinyl esters (structure 5) and/or carotene (structure 1). -carotene 15-15’ – dioxygenase catalyse the oxidative cleavage of the -carotene in all-trans
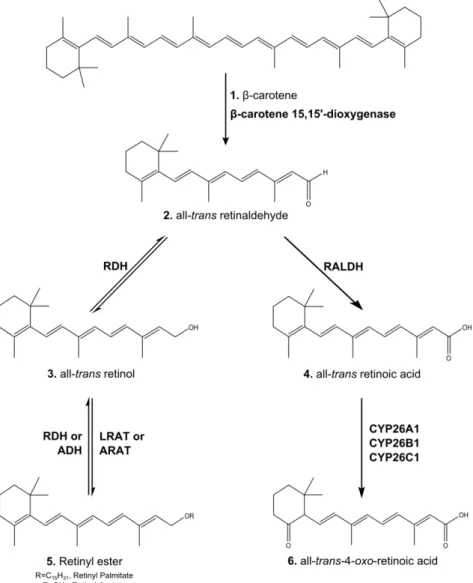
retinaldehyde (structure 2), which in turn can be reducted to all-trans retinol (structure 3) by retinol dehydrogenases (RDHs) and alcohol dehydrogenase (ADH), or converted in all-trans retinoic acid (structure 4) by retinaldehyde dehydrogenase (RALDH) family members. The retinol can be stored in form of retinyl esters, being the esterification reaction of retinol carried out by lecithin:retinol acyltransferase (LRAT) or acyl-CoA:retinol acyltransferase (ARAT). The degradation of retinoic acid is carried out by the enzymes of the cytochrome P450 26 subfamily (CPY26A1, CPY26B1 and CPY26C1), originating all-trans-4-oxo- retinoic acid (structure6) and other polar retinoic acid metabolites. Rodrigues (2015) ... 12
XVI
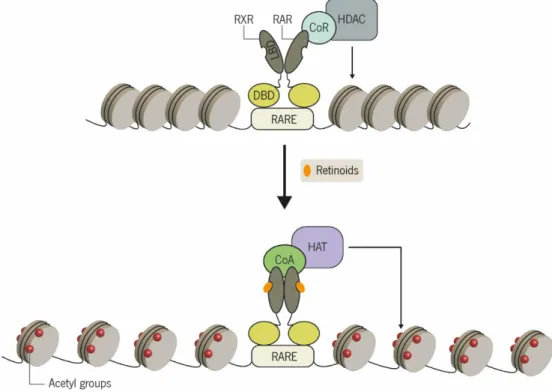
Figure 5 | Mechanism of retinoid action. In the absence of retinoids, the corepressor complex consisting of corepressor proteins (CoR) such as NCoR and SMRT, and histone deacetylases (HDACs) is bound to the RAR-RXR heterodimer. As result, the HDACs removes the acetyl groups from histones proteins, promoting condensation of chromatin and consequently the repression of gene transcription. When retinoids are present in the nucleus, they bind to the RAR-RXR heterodimer inducing an allosteric conformational change in the ligand-binding domain (LBD). This structural change leads to the recruitment of co-activators (CoAs) which in turn recruit histone acetyltransferases (HATs). HAT action results in acetylation of histone and therefore chromatin decondensation and gene expression activation. DBD, DNA-binding domain; RAR, retinoic-acid receptor; RARE, retinoic-acid response element; RXR, rexinoid receptor. Rodrigues (2015) ... 14
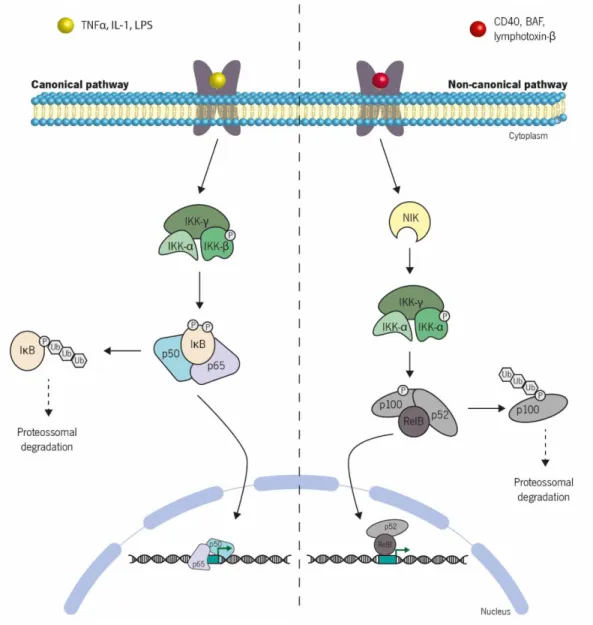
Figure 6 | Schematic representation of the canonical and non-canonical pathways of NF-κB
activation. Under resting conditions, the nuclear factor- κB (NF-κB) is bound to the inhibitory IκB
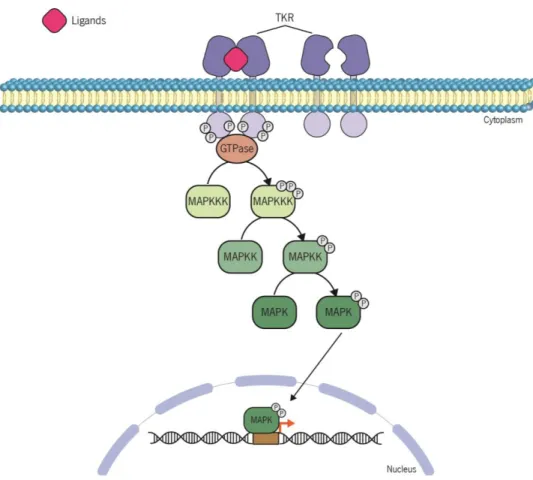
proteins, being this way sequestered in the cytoplasm. Stimulation by a range of specific stimuli leads to the activation of two different signalling cascades: canonical (left) and non-canonical (right) pathways. In the canonical pathway activation of IKK complex leads to phosphorylation of IκB and consequently its ubiquitination and proteossomal degradation. In contrast, the non-canonical pathway induces the activation of NF-kappa-B-inducing kinase (NIK), which phosphorylates and activates the IKK dimers. Once activated, IKK dimers phosphorylates p100 which is subsequently ubiquitinated and degradated. This results in the release and activation of NF-κB and p52-RelB, respectively, which induce transcription of target genes. Rodrigues (2015) ... 17 Figure 7 | Schematic representation of the MAPK pathway activation. The extracellular ligand binding to the tyrosine kinase receptor (TKR) and its dimerization cause a conformational change that allows the autophosphorylation of the cytosolic portion of each receptor monomer. The activation of receptors by autophosphorylation triggers a sequential phosphorylation of MAPKKK, MAPKK and MAPK. Once phosphorylated, MAPK translocates to the nucleus where it acts as a transcription factor promoting gene transcription. MAPKKK, MAP kinase kinase kinase; MAPKK, MAP kinase kinase; MAPK, MAP kinase. Rodrigues (2015) ... 19
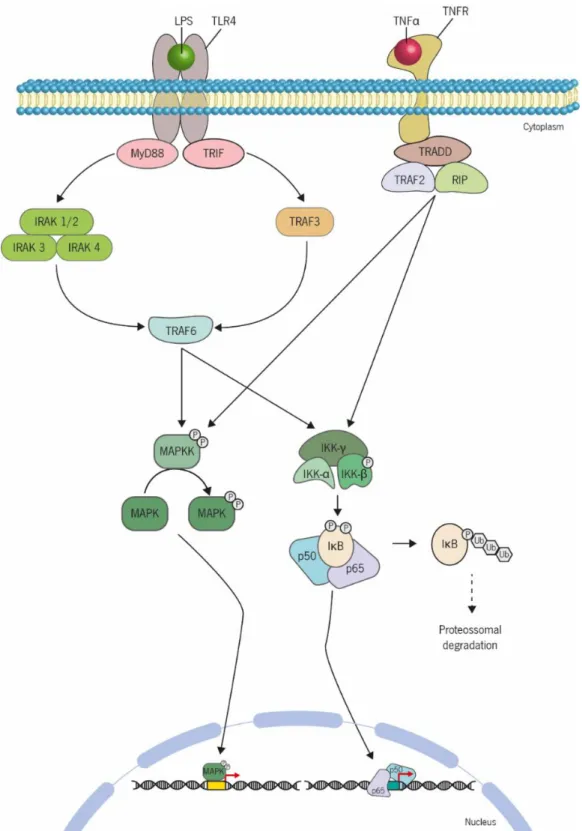
Figure 8 | Schematic overview of activation of NF-κB and MAPK pathways by LPS and TNFα.
The binding of tumor necrosis factor (TNF ) to the TNF receptor type 1 (TNFR1), one isoform present in almost every cell type, or TNFR2, expressed mostly in immune cells, unleashes different signalling pathways responsible for regulating important biological processes such as cell proliferation, differentiation and apoptosis. The NF-κB and MAPK pathways are two of the cascades activated by TNF by recruitment of the proximal receptor-associated complex consisting of TRADD, TRAF2 and RIP1, what leads to activation of the IKK complex and MAPKK proteins, respectively. The IKK complex and MAPKK proteins may also be activated by the binding of lipopolysaccharides (LPS) to the Toll-like receptor-4 (TLR4). Once bound, two different signalling pathways can be activated: myeloid differentiation factor 88 factor (MyD)88-dependent and MyD88-independent signalling via different adaptor proteins. In the first case, MyD88 is associated with the intracellular domain of cell surface receptors, activating an intracellular complex constituted by Interleukin-1 receptor-associated kinase (IRAK)4, IRAK3 and IRAK1 or IRAK2. The MyD88-independent pathway is mediated by the TIR domain-containing adaptor inducing interferon- (TRIF), which activates TNF-receptor-associated factor (TRAF)3. Both the IRAK complex and TRAF3 leads to the activation of TRAF6 which in turn phosphorylates the IKK complex and MAPKK proteins, allowing translocation of NF-κB and phosphorylated-MAPK from the cytosol into the nucleus. Rodrigues (2015)... 21
XVII
C
HAPTERIII
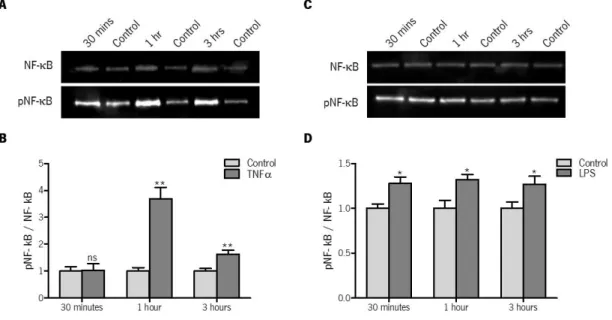
Figure 9 | Western blot analyses of NF-κB pathway activation by TNFα and LPS, in GT1-7
cells. The effect of TNF (A,B) and LPS (C,D) in the activation of NF-κB pathway was measured by
western blot, after 30 minutes, 1 hour and 3 hours of incubation with TNF (1 ng/mL) and LPS (1 μg/mL). (A, C) Ten µL of total protein obtained from GT1-7 cells samples were subjected to SDS-PAGE 12% gel. The gel with proteins was transblotted onto a nitrocellulose membrane and probed with 1: 2000 dilution of anti-NF-κB and 1:1000 dilution of anti-phospho- NF-κB antibodies. The bands were quantified as described in material and methods. Shown blots are representative of 3 independent experiments with similar results. (B, D) The graph shows the ratio between phosphorylated NF-κB and total NF-κB, normalized relatively to controls. Values are mean ± S.E.M. of 3 independent experiments. * P-value <0.05, ** P-value < 0.01, *** P-value < 0.001. Statistical analysis was done using the Students’ t-test. ns, no statistically significant difference. ... 39
Figure 10 | Western blot analyses of NF-κB pathway activation by TNFα and LPS, in
tanycytes. The effect of TNF (A and B) and LPS (C and D) on the activation of the NF-κB pathway
was measured by western blot, after 30 minutes, 1 hour and 3 hours of incubation with TNF (1 ng/mL) and LPS (1 μg/mL). (A, C) Ten µL of total protein obtained from tanycytes samples was subjected to SDS-PAGE 12% gel. The gel with proteins was transblotted onto a nitrocellulose membrane and probed with 1: 2000 dilution of anti-NF-κB and 1:1000 dilution of anti-phospho- NF-κB antibodies. The bands were quantified as described in material and methods. Shown blots are representative of 3 independent experiments with similar results. (B, D) The graph shows the ratio between phosphorylated NF-κB and total NF-κB, normalized relatively to controls. Values are mean ± S.E.M. of 3 independent experiments. * P-value <0.05, ** P-value < 0.01, *** P-value < 0.001. Statistical analysis was done using the Students’ t-test. ns, no statistically significant difference. ... 40
Figure 11 | Effect of deacetylase inhibitors on NF-κB target gene activation by TNFα, in
GT1-7 cells. The effect of HDAC4 and 5 inhibition (left panel) and HDAC6 inhibition (right panel) on
expression of the Fos (A,B), Jun (C,D), Prkca (E,F), Prkcd (G,H) and PTP1B (I,J) in GT1-7 cells. The GT1-7 cells were treated with LMK235 (1 µM), a HDAC4 and 5 inhibitor, or Tubastatin A (5 µM), a specific HDAC6 inhibitor, for 1 hour. After that TNF (1 ng/mL) was added and the cells were incubated for more 3 hours. The relative expression levels were obtained after normalization with the expression of the reference gene mActb. Values are mean ± S.E.M. of at least 3 independent experiments. * P-value <0.05, ** P-value < 0.01, *** P-value < 0.001. Statistical analysis was done using the one-way ANOVA followed by the Tukey’s post-hoc test. Tub A, Tubastatin A. ... 42
Figure 12 | Effect of deacetylase inhibitors on NF-κB target gene activation by LPS, in
tanycytes. The effect of HDAC4 and 5 inhibition (left panel) and HDAC6 inhibition (right panel) on
expression of the Fos (A,B), Jun (C,D), Prkca (E,F), Prkcd (G,H) and PTP1B (I,J) in tanycytes. The tanycytes were treated with LMK235 (1 µM), a HDAC4 and 5 inhibitor, or Tubastatin A (5 µM), a specific HDAC6 inhibitor, for 1 hour. After that LPS (1 µg/mL) was added and the cells were incubated for 3 hours. The relative expression levels were obtained after normalization with the expression of the reference gene mActb. Values are mean ± S.E.M. of at least 3 independent experiments. * P-value <0.05, ** P-value < 0.01, *** P-value < 0.001. Statistical analysis was done using the one-way ANOVA followed by the Tukey’s post-hoc test. Tub A, Tubastatin A ... 43
XVIII
Figure 13 | Western blot analyses of the effect of HDAC4/5 and HDAC6 inhibition in NF-κB
pathway activation, in GT1-7 cells. The effect of HDAC4/5 and HDAC6 inhibition in the activation of NF-κB pathway was measured by western blotting, after cell treatment with LMK235 (1 µM) and Tubastatin A (5 µM), respectively, for 3 hours. (A) Ten µL of total protein obtained from GT1-7 cells was subjected to SDS-PAGE 12% gel. The gel with proteins was transblotted onto a nitrocellulose membrane and probed with 1: 2000 dilution of anti-NF-κB and 1:1000 dilution of anti-phospho- NF-κB antibodies. The bands were quantified as described in material and methods. The blots shown are representative of 3 independent experiments with similar results. (B) The bar graph represents the ratio between phosphorylated NF-κB and total NF-κB, normalized relative to control. Error bars denote SEM, n=3. * P-value <0.05, ** P-value < 0.01, *** P-value < 0.001. Statistical analysis was done using the one-way ANOVA followed by the Tukey’s post-hoc test. ns, no statistically significant difference; Tub A, Tubastatin A. ... 45 Figure 14 | Effect of photoperiod on regulation of histones deacetylases in the hypothalamus
of F344 rats. Gene expression analysis by qPCR of responsiveness of HDAC6 (A) and HDAC4 (B) to
photoperiod. Transfer of rats from SD to LD conditions increased hypothalamic HDAC6 and HDAC4
mRNA expression. The relative expression levels were obtained after normalization with the expression of the reference gene mActb. Values are mean ± S.E.M. of at least 3 independent experiments. * P-value <0.05, ** P-P-value < 0.01, *** P-P-value < 0.001. Statistical analysis was done using the Students’ t-test. LD, long-day conditions; SD, short-day conditions. ... 46 Figure 15 | Effect of photoperiod on regulation of inflammation related genes in the
hypothalamus of F344 rats. The regulation of Dnmt1, Nos-2, Fcgr1, IL6, IL1Ⱦ and TNFȽ gene
expression by photoperiod in the hypothalamus of rats under LD conditions and short day conditions was measured by qPCR. The relative expression levels were obtained after normalization with the expression of the reference gene mActb. Values are mean ± S.E.M. of at least 3 independent experiments. * P-value <0.05, ** P-value < 0.01, *** P-value < 0.001. Statistical analysis was done using the Students’ t-test. ns, no statistically significant difference; LD, long-day conditions; SD, short-day conditions. ... 46 Figure 16 | Western blot analyses of the effect of HDAC4/5 and HDAC6 inhibition in MAPKs pathways activation, in GT1-7. The effect of HDAC4/5 and HDAC6 inhibition on the activation of the p38 pathway (left panel) and ERK1/2 pathway (right panel) was measured by western blotting, after cell treatment with LMK235 (1 µM) and Tubastatin A (5 µM), respectively, for 3 hours. (A, B) Ten µL of total protein obtained from GT1-7 cells was subjected to SDS-PAGE 12% gel. The gel with proteins was transblotted onto a nitrocellulose membrane and probed with 1: 1000 dilution of anti-p38 and 1:1000 dilution of anti-phosphorylated anti-p38 or 1:2000 dilution of anti-ERK1/2 antibodies and 1:4000 dilution of anti-phosphorylated ERK1/2. The bands were quantified as described in material and methods. The blots shown are representative of 3 independent experiments with similar results. (C, D) The bar graphs represent the ratio between phosphorylated p38 and total p38, and between phosphorylated ERK1/2 and total ERK1/2, normalized relative to controls. Error bars denote SEM, n=3. * P-value <0.05, ** P-value < 0.01, *** P-value < 0.001. Statistical analysis was done using the one-way ANOVA followed by the Tukey’s post-hoc test. ns, no statistically significant difference; Tub A, Tubastatin A. ... 47 Figure 17 | Regulation of p38 signalling pathway by histone deacetylases, in GT1-7 cells. The TNF regulated genes Fos (A), Jun (B), Prkca (C), Prkcd (D) and PTP1B (E) expression levels were evaluated after SB202190 treatment by qPCR. GT1-7 cells were treated with the p38 inhibitor
XIX
SB202190 (9 µM) or vehicle (DMSO) for 16 hours. They were then treated with or without TNF (1 ng/mL) and LMK235 (1 µM) for 4 hours (TNF was added 1 hour after LMK235). The relative expression levels were obtained after normalization with the expression of the reference gene mActb. Values are mean ± S.E.M. of at least 3 independent experiments. * P-value <0.05, ** P-value < 0.01, *** P-value < 0.001. Statistical analysis was done using the one-way ANOVA followed by the Tukey’s post-hoc test. ... 48 Figure 18 | Influence of HDAC inhibition in the expression of RAR and THR regulated genes. Effects of HDAC4 and 5 inhibition (left panel) and HDAC6 inhibition (right panel) on expression of the
RARȾ (A,B), Nrgn (C,D) and Cyp26A1 (E,F) in GT1-7 cells. The GT1-7 cells were incubated with RA (1 µM), T3 (50 mM), LMK235 (1 µM), a HDAC4 and 5 inhibitor, and Tubastatin A (5 µM), a specific HDAC6 inhibitor, for 24 hour. The relative expression levels were obtained after normalization with the expression of the reference gene mActb. Values are mean ± S.E.M. of at least 3 independent experiments. * P-value <0.05, ** P-value < 0.01, *** P-value < 0.001. Statistical analysis was done using the one-way ANOVA followed by the Tukey’s post-hoc test. Tub A, Tubastatin A, RA, retinoic acid, T3, thyroid hormone. ... 50
Figure 19 | Loss of Cyp26A1 responsiveness to RA, in GT1-7 cells. GT1-7 cells were treated with
RA (1 µM) for 24 hours and Cyp26A1 expression was evaluated by qPCR. After 7 days, the same experiment was repeated in the same batch of cells, having verified that GT1-7 cells lost the ability to respond to RA. The relative expression levels were obtained after normalization with the expression of the reference gene mActb. Values are mean ± S.E.M. of at least 3 independent experiments. * P-value <0.05, ** P-value < 0.01, *** P-value < 0.001. Statistical analysis was done using the Students’ t-test. ns, no statistically significant difference; RA, retinoic acid... 51
Figure 20 | Epigenetic regulation of Cyp26A1 promoter. Effect of DNA methylation on Cyp26A1
gene regulation by retinoic acid. GT1-7 cells were treated with the DNA methyltransferase inhibitor 5-Aza-2’-deoxycytidine (50 mg/mL) for 72 hours. Every day the medium was refreshed and added the inhibitor. After that, was added RA (1 µM), once Cyp26A1 expression is induced by retinoic acid, and Tubastatin A (5 µM). The GT1-7 cells recovered their ability to response to retinoic acid after inhibition of DNA methylation. The relative expression levels were obtained after normalization with the expression of the reference gene mActb. Values are mean ± S.E.M. of at least 3 independent experiments. * P-value <0.05, ** P-value < 0.01, *** P-value < 0.001. Statistical analysis was done using the one-way ANOVA followed by the Tukey’s post-hoc test. ns, no statistically significant difference; RA, retinoic acid; Tub A, Tubastatin A. ... 51 Figure 21 | HDAC6 and HDAC4 localisation, in GT1-7 cells. Immunocytochemistry staining shows that HDAC6 (A) was expressed in cytoplasm and nucleus whereas HDAC4 (B) was strongly expressed in nucleus. Each image panel shows the separate colour channels as smaller inserts to the left of the main merged image. The -tubulin, a neuronal marker, was used as positive control (C). A negative control sample that was stained with the secondary antibody but not with HDAC4 or HDAC6 antibody was also run alongside the positive samples (D). Scale bars 50 µm in a, c, d; 25 µm in b. ... 52 Figure 22 | HDA6 and HDAC4 localisation, in SH-SY5Y cells. Immunocytochemistry staining shows that HDAC6 (A) and HDAC4 (B) were mainly expressed in nucleus. The -tubulin, a neuronal marker, was used as positive control (C). A negative control sample that was stained with the secondary antibody but not with HDAC4 or HDAC6 antibody was also run alongside the positive
XX
samples (D). Each image panel shows the separate colour channels as smaller inserts to the left of the main merged image. Scale bars 25 µm. ... 53 Figure 23 | HDAC6 localisation, in tanycyte primary cells. Immunocytochemistry staining shows that HDAC6 (A) was not expressed in tanycytes. Vimentin, a marker for tanycytes, was used as positive control (B). A negative control sample that was stained with the secondary antibody but not with HDAC6 antibody was also run alongside the positive samples (C). Each image panel shows the separate colour channels as smaller inserts to the left of the main merged image. Scale bars 50 µm. ... 53
Figure 24 | TNFα reduces the cellular levels of retinoic acid by inhibiting the expression of
RA anabolic enzymes and inducing the expression of RA catabolic enzymes. GT1-7 cells were treated with TNF (1 ng/mL) for 3 hours and the expression of Cyp26A1, Cyp26B1, RALDH2
and Dio2 were evaluated by qPCR. The relative expression levels were obtained after normalization with the expression of the reference gene mActb. Values are mean ± S.E.M. of at least 3 independent experiments. * P-value <0.05, ** P-value < 0.01, *** P-value < 0.001. Statistical analysis was done using the Students’ t-test. ns, no statistically significant difference ... 54 Figure 25 | LPS upregulates the expression of enzymes involved in RA and T3 metabolism in cultured tanycytes. Primary tanycytes cells were treated with LPS (1 µg/mL) for 24 hours and the expression of Cyp26A1, Cyp26B1, RALDH2 and Dio2 were evaluated by qPCR. The relative expression levels were obtained after normalization with the expression of the reference gene mActb. Values are mean ± S.E.M. of at least 3 independent experiments. * P-value <0.05, ** P-value < 0.01, *** P-value < 0.001. Statistical analysis was done using the Students’ t-test. ... 55 Figure 26 | Responsiveness of retinoic acid signaling pathway to LPS in macrophages. Macrophages were treated with LPS (1 µg/mL) for 2 hours and the expression of Cyp26A1, Cyp26B1,
RALDH1 and RALDH2 were evaluated by qPCR. The relative expression levels were obtained after normalization with the expression of the reference gene hActb. Values are mean ± S.E.M. of at least 3 independent experiments. * P-value < 0.05, ** P-value < 0.01, *** P-value < 0.001, ****P-value < 0.0001. Statistical analysis was done using the Students’ t-test. ... 56
Figure 27 | LPS induces Dio2, NFkB1 and PTP1B, and represses RALDH1 expression in
hypothalamic slices cultures. Hypothalamic organotypic slices were treated with LPS (1 µg/mL) for 24 hours and the expression of RALDH1, Cyp26A1, Dio2, NFkB1, PTP1B and HDAC4 was evaluated by qPCR. The relative expression levels were obtained after normalization with the expression of the reference gene mActb. Values are mean ± S.E.M. of at least 3 independent experiments. * P-value <0.05, ** P-value < 0.01, *** P-value < 0.001. Statistical analysis was done using the Students’ t-test. ns, no statistically significant difference ... 56
S
UPPLEMENTARYD
ATAFigure S1 | Immunohistochemical analysis of HDCA6 localisation in the rat brain. GFAP, an astrocyte specific cell marker, was used as positive control. A negative control sample that was stained with the secondary antibody but not with HDAC6 antibody was also run alongside the positive samples. ... 87
XXI
LIST OF TABLES
C
HAPTERII
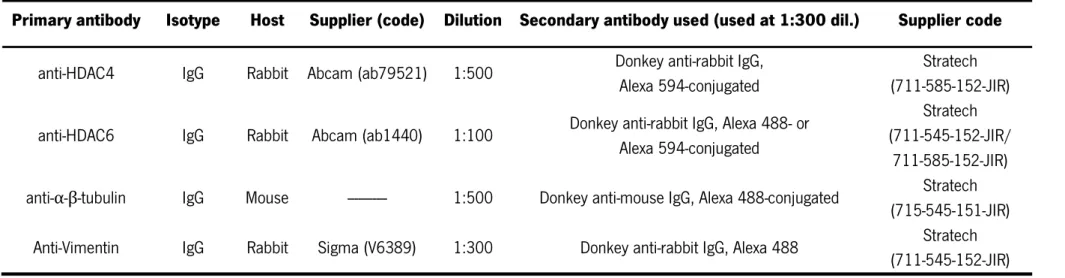
Table 1 | Sequences of the primers used in the qPCR. ... 31 Table 2 | List of antibodies used for fluorescent immunocytochemistry. ... 35 Table 3 | List of antibodies used for fluorescent immunohistochemistry. ... 35
XXIII
LIST OF ABBREVIATIONS
ADH Alcohol dehydrogenaseAgRP Agouti-related peptide
ANOVA Analysis of variances
ARAT Acyl-CoA:retinol acyltransferase
ARC Arcuate nucleus
ATCC American type culture collection
ATRA All-trans-retinoic acid
bp Base pairs
BMM Bone marrow-derived macrophages
BSA Bovine serum albumin
CaMKIV Calcium/calmodulin-dependent kinase IV
cAMP Cyclic adenosine monophosphate
CART Cocaine and amphetamine-regulated transcript
cDNA Complementary DNA
CRABP Cellular retinoic acid binding protein
CRBP Cellular retinol binding protein
CoAS Co-activators
CYP26 Cytochrome P450 26 subfamily
DBD DNA-binding domain
DIO2 Type II iodothyronine deiodinase
DIO3 Type II iodothyronine deiodinase
DMEM Dulbecco's modified Eagle's medium
DMN Dorsomedial
DMSO Dimethyl sulfoxide
DNA Deoxyribonucleic acid
Dnmt DNA methyltransferases
ERK Extracellular signal-regulated kinase
FCS Foetal calf serum
FSH Follicle-stimulating hormone
FXR Farnesoid X receptor
GnRH Gonadotropin-releasing hormone
HATs Histone acetyltransferases
HDACs Histone deacetylases
HEPES 4-(2-hydroxyethyl)-1-piperazineethanesulfonic acid
HSP heat shock protein
IKK IκB kinase
IL Interleukin
XXIV
JNK c-Jun N-terminal kinase
LBD Ligand-binding domain
LD Long-day
LH Lateral hypothalamic
LPS Lipopolysaccharide
LRAT Lecithin:retinol acyltransferase
LXRs Liver X receptors
MKP-1 MAPK phosphatase 1
MAPK Mitogen-activated protein kinases
MAPKK MAPK kinase
MAPKKK MAPK kinase kinase
MBD Methyl-CpG binding domain
ME Median eminence
MEF2 Myocyte enhancer factor-2
MyD88 Myeloid differentiation factor 88
NaCl Sodium chloride
NAD Nicotinamide adenine dinucleotide
NCoR Nuclear co-repressor
NF-κB Nuclear factor- κB
NIK NF-kappa-B-inducing kinase
NPY Neuropeptide Y
OCT Optimal cutting temperature compound
PBS Phosphate buffered saline
PET Positron emission tomography
PFA Paraformaldehyd
PKC Protein kinase C
POMC Pro-opiomelanocortin
PPARs Peroxisome proliferator activated-receptors
PTP1B Protein-tyrosine phosphatase 1B
PVN Paraventricular nucleus
qPCR Quantitative polymerase chain reaction
RA Retinoic acid
RALDH Retinaldhyde dehydrogenase
RAR Retinoic acid receptor
RAREs Retinoic acid response elements
RBP Retinol-binding protein 4
RDH Retinol dehydrogenase
RIP Receptor-interacting protein
RXR Retinoid X receptors
RXRE Retinoid X response element
rT3 3,3’,5’ – triiodothyronine (Reverse T3)
XXV
SD Short-day
SDS Sodium dodecyl sulfate
SEM Standard error of the mean
SMRT Silencing mediator for retinoic acid and thyroid hormone receptors
T2 3’,3’-diiodothyronine
T3 3,5,3’ – triiodothyronine
T4 Tetraiodothyronine
TBS Tris-buffered saline
TH Thyroid hormone
THR Thyroid hormone receptor
TKR Tyrosine kinase receptors
TLR Toll-like receptor
TNF Tumour necrosis factor
TNFα Tumour necrosis factor
TNFR Tumour necrosis factor receptor
TH Thyroid hormone receptor
TRADD TNFR-Associated Death Domain
TRAF TNF-receptor-associated factor
TREs Thyroid response elements
TRIF TIR-domain-containing adaptor inducing IFN-
VDR 1,25- dihydroxy-vitamin D3 receptor
VMH Ventromedial region of the hypothalamus
Zn Zinc
WHO World Health Organization
C
HAPTER
I.
I
NTRODUCTION
______________________________
C
HAPTER
I
I
NTRODUCTION
3 Obesity is one of the greatest health problems of the 21st century in developed countries.
Between 1980 and 2008 the number of obese worldwide doubled, and there is no reason to expect this alarming rate of increase to change over the next years. According to the World Health Organization (WHO), in 2008, 24% of the Portuguese adult population (≥20 years) were obese and 59.1% were overweight. In the United Kingdom and North Ireland, the percentage of adult population obese is 26.9% and the percentage of the adult population overweight is 64.2% (WHO 2013). The terms obesity and overweight are defined as an abnormal or excessive accumulation of fat in the body and results from an imbalance between food intake and energy expenditure. Thus, it is important to understand why the physiological systems that control energy balance allow an increase of food intake beyond the amount required for the body and why energy expenditure is not increased in these cases to restore the initial equilibrium. Seasonal animals, such as the F344 rat, which allow the hypothalamic control of energy balance to be manipulated simply by changing the length of day, provide an excellent model to study the energy balance regulation (Heideman & Sylvester 1997).
1.1.
Seasonal Changes
The biological rhythm of many mammals and birds are profoundly affected by the geographic cycles such as daily, seasonal, lunar and tidal. To cope with these environmental variations, animals living in temperate and arctic regions usually show a host of physiological and behavioural changes that include, hibernation, reproduction, migration, feeding pattern, energy metabolism, body weight, changes in pelage colour and thickness, immune function and much else (Barrett et al. 2007; Klingenspor et al. 2000). Throughout the seasons, one of the environmental aspects that changes most dramatically is the availability of food. Consequently, during the winter, when food availability is minimal and energy demand is maximum, animals display a set of behaviours that allow them to survive. Also important is the timing of reproduction to ensure that offspring born just in the most favourable time of year, when the food viability is maximum and temperatures are warm. The switch in such physiological and behavioural responses is controlled by the hypothalamus, the major portion of brain that links the nervous system to the endocrine system via pituitary gland, being responsible for maintain the internal balance of the organism - homeostasis. Many important features, such as circadian rhythms, reproductive status, hormone release,
4
feeding, and energy balance, are regulated by hypothalamus by sending out signals as hormones and neuropeptides.
The seasonal variations can be predicted by animals through the changes in day length (photoperiod). Photoperiodism can be defined as a process whereby organisms are able to use both absolute measures of day length and the direction of day length change as a basis for regulating seasonal changes in physiology and behaviour (Goldman 2001). The molecular mechanism of the seasonal timing system is not fully understood in any organism studied so far. However, over the last years many progresses have been made in the comprehension of the mechanisms by which photoperiod drive the physic and behaviour changes. The effects of photoperiod can be studied in laboratory by changing the animals from long-day (LD) “summer-like” conditions (16:8 hrs light:dark cycle) to a short-day (SD) “winter-“summer-like” conditions (8:16 hrs light:dark cycle).
Studies on many species of seasonal mammals and birds showed that photoperiod is transduced by a photoneuroendocrin system where melatonin, a hormone secreted by the pineal gland with receptors located on several regions of hypothalamus (Morgan et al. 1994), acts as a chemical mediator of day length changes. In mammals, melatonin has many biological effects, being involved in the regulation of physiological functions such as sleeping time, seasonal reproduction, immune function, circadian entrainment and many others.
Alterations in the secretion of melatonin provoked by seasonal change is responsible for reproductive seasonality by regulation of testosterone production, testicular size, and sperm production in males, and ovulatory cycles in females (Gerlach & Aurich 2000). The biosynthesis and secretion of melatonin is tightly regulated by sunlight that is transmitted to pineal gland through the retina, suppressing its synthesis. The synthesis of melatonin is directly related to the length of darkness. Thus, winter-like days are associated with a greatest quantity of melatonin secreted whereas summer-like days are associated with a short secretion of this hormone. The amount of melatonin is inversely proportional to gonadotropin-releasing hormone (GnRH) secretion such that an increase in melatonin’s secretion is associated with a decrease GnRH release. In turn, the GnRH released regulates the production of luteinizing hormone (LH) and follicle-stimulating hormone (FSH; Grosse et al. 1993). In this way, melatonin controls seasonal reproduction by indirectly modulating the secretion of gonadotropins.
5 Another hormone known to be involved in seasonal physiology in mammals and birds is
trioiodothyronine (T3), a hormone that plays an important role in photoperiodic control of energy
balance and reproduction (Dawson et al. 2001; Shinomiya et al. 2014). Within the brain, the availability of T3 hormone is controlled by the activity of type II iodothyronine deiodinase (DIO2) and
type III iodothyronine deiodinase (DIO3). DIO2 catalyses the conversion of the prohormone thyroxine (T4) to the more active form T3 whilst DIO3 converts T4 to inactive T3 (reverse T3; rT3) and
T3 to inactive 3’,3’-diiodothyronine (T2; Bernal 2014; Figure 1). The expression of both DIO2 and
DIO3 is photoperiodically regulated in tanycytes, specialized hypothalamic glia that line the floor and the basolateral walls of the third ventricle, with higher expression of DIO2 in rats under long-day photoperiod, relative to short-long-day (Yoshimura et al. 2003)resulting in higher thyroid hormone activity. Conversely, DIO3 is weakly expressed in rats under LD conditions and strongly expressed in rats under SD conditions (Yasuo et al. 2005) leading to decreased thyroid hormone activity. Interestingly, it has been shown that the regulation of DIO2 and DIO3 expression in Siberian hamster (Phodopus Sungorus) and Syrian hamster (Mesocricetus auratus), two of the most widely used models for photoperiodic studies, are melatonin dependent, and that injection of these hamster species with melatonin under long-day conditions for 7 days inhibits DIO2 expression to that of short day levels (Revel et al. 2006; Watanabe et al. 2004).
Figure 1 |Thyroid hormone metabolism. Within the brain the tetraiodothyronine (T4; structure 1) can be converted into the
more active form 3,5,3 - triiodothyronine (T3; structure 2) by the action of type II iodothyronine deiodinase (DIO2) or the inactive form 3,3,5’- triiodothyronine (rT3; structure 3), an isomer of T3, by type III iodothyronine deiodinase (DIO3). T3 and rT3 can be converted into 3’,3’-diiodothyronine (T2; structure 4) by action of DIO3 and DIO2, respectively. Rodrigues (2015)
6
The importance of photoperiod in seasonal reproduction has been extensively studied over the last years. However, its influence on metabolism and energy balance is poorly understood. It is well known that animals living in temperate regions have a weight decrease during the winter and an increase in summer. Siberian hamsters, for example, lose between 30 and 40% of their body weight in response to photoperiod (Morgan et al. 2003). These models can be used to study the hypothalamic signalling systems required to regulate energy balance. Several hypothalamic nuclei are known to be involved in control of metabolism and energy balance regulation; the main hypothalamic nuclei responsible are the arcuate nucleus (ARC), paraventricular nucleus (PVN), lateral hypothalamic (LH) area, dorsomedial (DMN), and ventromedial region of the hypothalamus (VMH).
The arcuate nucleus has two types of neurons that control fuel intake and metabolism: orexigenic neurons (appetite-stimulating) and anorexigenic neurons (appetite-suppressing). Orexigenic neurons stimulate eating by producing and releasing neuropeptide Y (NPY), whereas anorexigenic neurons exerts the opposite effect physiologic producing -melanocyte-stimulating hormone ( -MSH; Nelson & Cox 2013). The release of NPY and -MSH are regulated by various factors including the serum levels of leptin, a hormone synthesized in adipose tissue and whose receptors are highly expressed in ARC (Sahu 2003). When there is an increase in the size of fat tissue, leptin is released into the bloodstream and binds to the hypothalamic leptin receptors, influencing the expression of NPY and -MSH (Klok et al. 2007). An increase in leptin levels in blood serum stimulates -MSH production and inhibits NPY production. Therefore, leptin exerts its function stimulating hypothalamic anorexigenic pathways and inhibiting orexigenic ones. On the other hand, food restriction decreases leptin levels and increase the ghrelin levels, and consequently increases the expression of some orexigenic genes such as NPY and Agouti-related peptide (AgRP) and suppresses the expression of some anorexigenic genes such as pro-opiomelanocortin (POMC) and cocaine and amphetamine-regulated transcript (CART) in the ARC (Kalra et al. 1999; Figure 2). Studies developed in Siberian hamsters showed that animals under LD conditions subject to food restrictions have the same changes in gene expression that normally result from a decrease in leptin levels. However the gene expression pattern of hamsters under SD conditions are completely different suggesting that photoperiod exerts its effect on the energy balance through a different regulatory system to that regulated by leptin.
7
In Siberian hamsters melatonin receptors are localised to the DMN, one of the hypothalamic nuclei involved in the regulation of metabolism and energy balance, as well as the suprachiasmatic nucleus (SCN; Morgan et al. 1994). Siberian hamsters infused for 10 hours with melatonin, to mimic the nocturnal durations of this hormone in serum, showed a decrease in body and fat pad weights, however these effects were blocked by lesion of the SCN (Bartness et al. 1991). These results suggest a role of the SCN in the photoperiodic regulation of body weight. Although the melatonin receptors are expressed at a low level and in just a few neurons of the DMN, it was
Figure 2 | Regulation of energy balance by leptin and ghrelin. In the arcuate nucleus of the hypothalamus, orexigenic and
anorexigenic neurons receive hormonal inputs and relay neuronal signals. Stimulation of these neurons leads to production of orexigenic peptides (promoting appetite), such as Neuropeptide Y (NPY) and Agouti-related peptide (AgRP), or anorexigenic peptides (decreasing appetite), as -melanocyte-stimulating hormone ( -MSH), one of several cleavage products of pro-opiomelanocortin (POMC), and cocaine amphetamine - related transcript (CART). Leptin is a hormone released from adipose tissue when there is an increase in the size of body-fat mass. Release of leptin leads to a decrease in appetite and an increase in fuel metabolism by stimulation of melanocortin-producing neurons, inhibiting neurons that produce the molecules NPY and AgRP. On the other hand, when of body-fat mass decreases ghrelin is released by the stomach, which leads to an activation of NPY/AgRP-expressing neurons, and consequently stimulates appetite. In this way, energy balance is restored, ensuring the homeostasis of the organism. Rodrigues (2015)
8
shown that the increase in the duration of melatonin secretion leads to an increase of these receptors in the DMN which, in turn, increases lipolysis in white adipose tissue and decreases adiposity (Song & Bartness 2001). These findings support the idea that energy balance may be regulated by the melatonin receptors in the DMN. Although the action of photoperiod and melatonin in energy balance regulation is far from completely understood, it is known that the several hypothalamic nuclei involved in these pathways have interrelated connections, which can explain the interface between the neuronal pathways involved in energy balance regulation and circadian rhythms (Figure 3). However, melatonin is presumed to work via an intermediate since
in isolated adipocytes from Syrian hamsters, Sprague-Dawley rats and rabbits melatonin does not directly affect lipolysis and lipogenesis (Ng & Wong 1986). Although this intermediate is still unidentified, several signalling pathways including thyroid hormone (TH) and retinoic acid (RA) signalling pathways, are known to be regulated by melatonin and to control energy balance and metabolism.
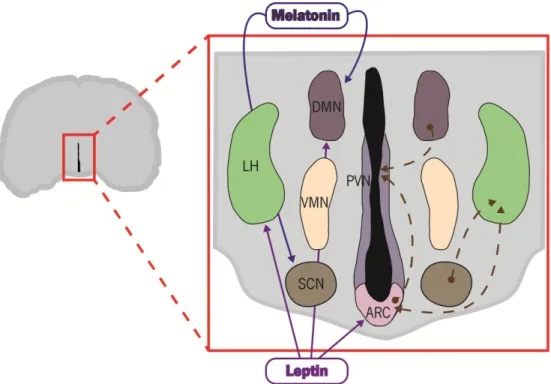
Figure 3 | Link between photoperiod and energy balance regulation. Schematic representation showing the main
hypothalamic nuclei involved in energy balance and their interrelated connections (right side) as well the action of the hormones melatonin and leptin in these nuclei (left side). Melatonin, a hormone photoperiodically regulated, has its receptors expressed in dorsomedial (DMN) and suprachiasmatic nucleus (SCN). In turn, these nuclei have connections with others nuclei, namely the paraventricular nucleus (PVN) and lateral hypothalamic (LH), respectively, both connected to the arcuate nucleus (ARC), the most important nucleus in the regulation of energy balance. The ARC regulates feeding and energy expenditure though two different neuronal types, anorexigenic and orexigenic neurons, that project from the ARC to the PVN. Rodrigues (2015)
9 The importance of thyroid hormone in the regulation of appetite and energy expenditure is
indicated from studies of patients with thyroid dysfunction; either hypothyroidism, the underproduction of TH, or hyperthyroidism, the overproduction of TH. Patients with hypothyroidism have a body weight gain while hyperthyroid patients decrease their body weight. In addition, in hyperthyroid rats, TH has a similar effect to the ‘hunger hormone” ghrelin, increasing the expression of Agrp and NPY, and decreasing the expression of Pomc, in ARC (Varela et al. 2012). Concordant with that, fasting results in an increase in the conversion of T4 into T3 in the
hypothalamus (Diano et al. 1998).
A study developed by Ross et al. in 2004 showed that in Siberian hamster, the expression of some genes involved in the RA signalling pathway are photoperiodically regulated, with expression higher in the hypothalamus of animals under long day “summer-like” conditions. Furthermore, the alterations in gene expression appeared to be in dependent on melatonin. These results suggest an important role of the RA signalling pathway in the photoperiodic regulation of body weight. However, the link between RA and food intake has remained relatively unexplored. Studies by Ziouzenkova et al. (2007) showed that vitamin A metabolism and responses to a high-fat diet are linked. Raldh1, which is necessary for RA synthesis, when deficient in mice, had lower leptin and RBP4 plasma levels, and gained less weight than wild type mice when on a high-fat feeding, suggesting that the RA can play an important role as a mediator of energy balance.
1.2.
Retinoic Acid Metabolism and its Signalling Pathway
Vitamins are compounds that, just in small amounts, are required for growth and are essential to health of humans and other vertebrates. Vitamin A, one of the earliest vitamins to be discovered is an essential dietary micronutrient belonging to the group of fat-soluble vitamins. This vitamin found in animal tissue most commonly in the form of retinol or retinyl ester, or as provitamin A carotenoids in plant tissues, among which -carotene is the most important.
Retinoids, a generic term introduced in 1976 by Sporn et al., are a family of signalling molecules related to vitamin A with respect to their chemical structures (Tang & Gudas 2011; Sodhi & Singh 2014). They are low molecular weight molecules derived from terpenoids with a cyclic end group, a 6 carbon -ionone ring, a polyene side chain, and a polar end group.
10
Diversification of side chains and end groups creates the various classes of retinoids (Tang & Gudas 2011; Ransom et al. 2013).
Unlike plants and microorganisms such as some bacteria, algae, and fungi, mammals lack the biosynthetic machinery to synthesize vitamin A de novo. The principal source of vitamin A for mammals is dietary, namely provitamin A carotenoids (mainly carotene, carotene and, cryptoxanthin) found in plant-derived products and, preformed vitamin A in the form of retinyl esters, which is found in foods of animal origin (Orfali et al. 2014; Paik et al. 2014). The most stable storage form of vitamin A in animal tissues is the fat-soluble retinyl esters (Tanumihardjo 2011; Ransom et al. 2013). In humans, vitamin A can be found in three forms, retinol, retinal and retinoic acid, the latter being the main and most abundant intracellular metabolite in mammals.
Retinol homeostasis, as well as the distribution of RA in different tissues, is tightly regulated by several proteins and enzymes involved in retinoid signalling (Rhinn & Dollé 2012). The main sources of vitamin A in the diet are fish-liver oils, eggs, milk, butter, and plants and are present in the form of retinyl esters and provitamin A carotenoids (Marill et al. 2003). In the intestinal lumen the majority of food-derived retinoids are converted to retinol prior to uptake by the enterocytes by a series of reactions. Retinyl esters are hydrolysed to unesterified retinol by enzymes such as pancreatic triglyceride lipase and intestinal phospholipase B. Carotenoids are oxidatively cleaved by -carotene 15,15-oxygenase into two molecules of all-trans-retinaldehyde followed by their reversible reduction to retinol, a reaction catalysed by the retinol dehydrogenase (RDH; During & Harrison 2007). The retinol resulting from this reaction, the form absorbed into the intestinal mucosal cell, is then re-esterified in enterocytes with long chain fatty acids, particularly palmitic acid, before secretion into the intestinal lymph (Lane & Bailey 2005; Blomhoff & Blomhoff 2005). This esterification reaction is catalysed by the enzyme lecithin:retinol acyltransferase (LRAT), an enzyme that uses the acyl group at the sn-1 position, using phosphatidylcholine from the membrane bilayer as a source of fatty acids. Esterification of retinol can also be carried out by acyl-CoA:retinol acyltransferase (ARAT) which catalyses the fatty acyl-CoA-dependent esterification of retinol (Eroglu & Harrison 2013). LRAT and ARAT are distinguished by the capacity of the former to esterify retinol when bound to cellular retinol binding protein (CRBP), as opposed to the latter which does not require substrate bound to CRBP (O’Byrne & Blaner 2013).
Retinol binds with high affinity to cellular retinol binding protein II (CRBP-II), playing this protein important roles in the regulation of retinol absorption by enterocytes and its intracellular
11 metabolism, directing the retinol substrate more specifically toward LRAT, thus preventing its free
access to cytosol reductases (Eroglu & Harrison 2013; Ransom et al. 2013). The absorbed vitamin A can also be directly secreted into the portal circulation as unesterified retinol (Lane & Bailey 2005; Blomhoff & Blomhoff 2005).
After re-esterification of retinol, the retinyl esters are incorporated with other dietary lipids into chylomicrons for transport to the liver, where they are hydrolysed in hepatocytes. The unesterified retinol formed is then associated with retinol-binding protein 4 (RBP4), a protein found in high concentrations in hepatocyte endoplasmic reticulum. Binding of retinol to RBP4 apparently results in the translocation of retinol-RBP4 from endoplasmic reticulum to the Golgi complex, and therefore the secretion of retinol-RBP4 into the blood plasma for transportation to peripheral tissues (Ransom et al. 2013; Orfali et al. 2014; Blomhoff & Blomhoff 2005). Retinol is transported in the bloodstream to its target tissue bound in a 1:1 ratio to RBP4/transthyretin (Lane & Bailey 2005). However, some of unesterified retinol can be transferred as retinol to another liver cell type, the perisinusoidal stellate cell, for storage (Blomhoff & Blomhoff 2005). The liver is the major site of retinoid metabolism and storage in the body, storing the retinol secreted in response to the body’s needs, thus relieving animals from the daily acquirement of vitamin A from food (Paik et al. 2014; Lane & Bailey 2005).
Uptake of retinol by cells that require this retinoid is mediated by a multi-transmembrane domain protein that is the product of the RA-inducible gene STRA6 (Kawaguchi et al. 2007). This protein acts like a RBP4 receptor, removing retinol from the RBP4 complex and transporting it across the plasma membrane, where it can be metabolized. However, studies developed in Stra6-deficient mice suggest the presence of additional non-receptor-mediated pathways for retinol uptake into cells. Nevertheless, the uptake of retinol via the RBP4 receptor Stra6 is the most important one (O’Byrne & Blaner 2013; Eroglu & Harrison 2013), and mutations in STRA6 leads to a wide variety of diseases in humans, including anophthalmia, heart defects, lung hypoplasia, and mental retardation (Mongan & Gudas 2007).
Once inside the cell, retinol binds to CRBP and can be esterified by LRAT for storage or metabolized to its biologically active metabolite, all-trans-retinoic acid (ATRA), by two sequential oxidation steps that convert first retinol to retinaldehyde by RDH or alcohol dehydrogenase (ADH) and then to retinoic acid by retinaldhyde dehydrogenase (RALDH). When necessary, the cells can mobilize the retinyl esters from storage by retinyl esterase to yield retinol, which can then be
12
converted in ATRA (Khillan 2014; Napoli 1996; Lane & Bailey 2005; Orfali et al. 2014). ATRA is the most important metabolite of vitamin A and is involved in a wide variety of biological processes, being responsible for regulating the expression of many genes by binding to retinoic acid receptors (RAR) when bound to cellular retinoic acid binding protein 2 (CRABP-2), and which will be discussed in more detail later (Lane & Bailey 2005). In addition, RA can bind to CRABP-1 and be destroyed by the enzymes of the cytochrome P450 26 subfamily (CYP26A1, CYP26B1 and CYP26C1). CYP26 enzymes catalyse the oxidation reactions that convert RA into 4-hydroxy-RA and then 4-oxo-RA (Figure 4). This is an important mechanism that allows tight control of RA levels in
cells and tissues, and thereby regulate the retinoid signalling (Rhinn & Dollé 2012).
Figure 4 |The major metabolic pathway of retinol in nonvisual mammalian cells. Retinol is obtained from dietary in the
form of retinyl esters (structure 5) and/or -carotene (structure 1). -carotene 15-15’ – dioxygenase catalyse the oxidative cleavage of the -carotene in all-trans retinaldehyde (structure 2), which in turn can be reducted to all-trans retinol (structure 3) by retinol dehydrogenases (RDHs) and alcohol dehydrogenase (ADH), or converted in all-trans retinoic acid (structure 4) by retinaldehyde dehydrogenase (RALDH) family members. The retinol can be stored in form of retinyl esters, being the esterification reaction of retinol carried out by lecithin:retinol acyltransferase (LRAT) or acyl-CoA:retinol acyltransferase (ARAT). The degradation of retinoic acid is carried out by the enzymes of the cytochrome P450 26 subfamily (CPY26A1, CPY26B1 and CPY26C1), originating all-trans -4-oxo- retinoic acid (structure6) and other polar retinoic acid metabolites. Rodrigues (2015)