Morphological and molecular diversity among cassava genotypes
Thiago Fonseca Mezette(1), Caroline Groppo Blumer(1) and Elizabeth Ann Veasey(1)
(1)Universidade de São Paulo, Escola Superior de Agricultura Luiz de Queiroz, Departamento de Genética, Avenida Pádua Dias, no 11, CEP 13418‑900 Piracicaba, SP, Brazil. E‑mail: [email protected], [email protected], [email protected]
Abstract – The objective of this work was to characterize morphologically and molecularly the genetic diversity of cassava accessions, collected from different regions in Brazil. A descriptive analysis was made for 12 morphological traits in 419 accessions. Data was transformed into binary data for cluster analysis and analysis of molecular variance. A higher proportion of white or cream (71%) root cortex color was found,
while flesh colors were predominantly white (49%) and cream (42%). Four accession groups were classified
by the cluster analysis, but they were not grouped according to their origin, which indicates that diversity is not structured in space. The variation was greater within regions (95.6%). Sixty genotypes were also evaluated using 14 polymorphic microsatellite markers. Molecular results corroborated the morphological ones, showing the same random distribution of genotypes, with no grouping according to origin. Diversity indices were high for each region, and a greater diversity was found within regions, with: a mean number of alleles per locus of 3.530; observed and expected heterozygosity of 0.499 and 0.642, respectively; and Shannon index of 1.03. The
absence of spatial structure among cassava genotypes according to their origins shows the anthropic influence
in the distribution and movement of germplasm, both within and among regions.
Index terms: Manihot esculenta, genetic diversity, germplasm, microsatellites, morphological traits.
Diversidade morfológica e molecular entre genótipos de mandioca
Resumo – O objetivo deste trabalho foi caracterizar, morfológica e molecularmente, a diversidade genética de acessos de mandioca de diferentes regiões do Brasil. Realizou-se a análise descritiva de 12 características morfológicas em 419 acessos. Os dados foram transformados em dados binários para análise de agrupamento e análise de variância molecular. Observou-se maior proporção (71%) de cor branca ou creme do córtex da raiz, enquanto as cores da polpa foram predominantemente branca (49%) e creme (42%). Quatro grupos de
acessos foram classificados pela análise de agrupamento, mas não foram agrupados de acordo com sua origem,
o que indica que a diversidade não está estruturada no espaço. A maior parte da variação ocorreu dentro das populações (95,6%). Sessenta genótipos também foram avaliados com o uso de 14 marcadores microssatélites
polimórficos. Os resultados moleculares corroboraram os morfológicos e mostraram a mesma distribuição
aleatória dos genótipos, com ausência de agrupamento quanto ao local de origem. Os índices de diversidade foram elevados para cada região e a maior parte da diversidade foi observada dentro de regiões, com: número médio de alelos por loco de 3,530; heterozigosidade média observada de 0,499 e esperada de 0,642; e índice de Shannon de 1,03. A ausência de estrutura espacial entre os genótipos de mandioca de acordo com suas origens
mostra a influência antrópica na distribuição e movimentação de germoplasma, tanto entre como dentro de
regiões.
Termos para indexação: Manihot esculenta, diversidade genética, germoplasma, microssatélites, caracteres
morfológicos.
Introduction
Cassava (Manihot esculenta Crantz) is considered a subsistence food for over 500 million people in tropical areas, and its world production in 2010 was approximately 252 million tons (Food and Agriculture Organization of the United Nations, 2011). Brazil´s current production is around 25.4 million tons a year (Food and Agriculture Organization of the United
Nations, 2011), which places cassava among the major crops in the country, most of it cultivated by small and medium producers.
crop (Siqueira et al., 2010; Alves-Pereira et al., 2011; Montero-Rojas et al., 2011), which is important for plant breeding programs. This large genetic variability is due to the ease of cross-pollination, fruit dehiscence, high heterozygosity of the species, and to the occasional use of seeds in propagation (McKey et al., 2010; Montero-Rojas et al., 2011). Besides, there is usually an intense plant material exchange system between traditional farmers, further expanding this diversity, which continuously originates an infinite number of new clones (Sambatti et al., 2001; McKey et al., 2010).
Several studies have reported morphological characterization to determine the genetic diversity among cassava genotypes (Sambatti et al., 2001; Benesi et al., 2010; Raghu et al., 2007; Vieira et al., 2008; Rimoldi et al., 2010; Asare et al., 2011). Molecular markers have also being used to estimate genetic diversity parameters for cassava originated from Brazil and other countries, such as: RAPD (random amplified polymorphic DNA) (Lokko et al., 2006; Ferreira et al., 2008; Rimoldi et al., 2010), SSR (simple sequence repeats) (Moyib et al., 2007; Siqueira et al., 2009, 2010; Alves-Pereira et al., 2011; Montero-Rojas et al., 2011; Oliveira et al., 2012; Costa et al., 2013), and AFPL (amplified fragment length polymorphism) (Benesi et al., 2010). SSR markers are particularly attractive because they are abundant in plants, showing codominance and high levels of polymorphism (Mba et al., 2001). Some of the studies using SSR markers have focused on the characterization of cassava from germplasm banks, such as: Fregene et al. (2003) in Colombia, who assessed germplasm from several countries; Lokko et al. (2006), Moyib et al. (2007) and Asare et al. (2011) in Africa; Ferreira et al. (2008), Siqueira et al. (2009, 2010), Oliveira et al. (2012), and Costa et al. (2013) in Brazil; Montero-Rojas et al. (2011), in Puerto Rico; and Raghu et al. (2007), in India.
The objective of this work was to characterize morphologically and molecularly the genetic diversity of cassava accessions, collected from different regions in Brazil.
Materials and Methods
The experiment was carried out at the Experimental Station of Anhumas, SP, Brazil, at 22º45'S, 48º00'W, from 2010 to 2011. A total of 419 cassava accessions from the germplasm bank of the Escola Superior de
Agricultura Luiz de Queiroz, Universidade de São Paulo, were evaluated for 12 qualitative, morphological traits.
The evaluation was made on individual plants, on January 2011, according to the set of morphological descriptors (Table 1) for cassava (Fukuda et al., 2010). The genotypes were arranged in plots composed of five plants in a 1 m spaced row, with 1.5 m spacing between rows. A dystrophic Latossolo Amarelo (Xantic Ferralsol) soil type (Santos et al., 2006) was used, without liming or fertilization at planting (January 2010). During the experiment, irrigation was done by aspersion, at planting and whenever necessary. Weed infestation was constantly controlled.
Descriptive statistics were used to construct frequency graphs for each of the morphological characters. Data were converted to binary data (present = 1 and absent = 0) for each phenotypic class of morphological characters. The genotypes were separated into five groups according to their origin (CW, Central-West, with 200 genotypes; N, North, with 97 genotypes; NE, Northeast, with six genotypes; SE, Southeast, with 79 genotypes; and NI, no identification, with 37 genotypes). Binary data were submitted to an analysis of molecular variance, to verify the variation within and between groups or
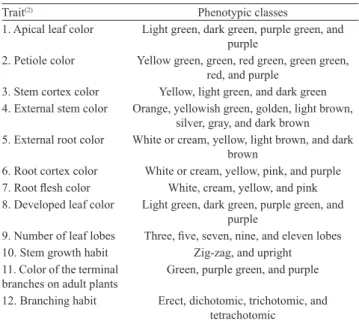
Table 1. Morphological traits used to evaluate 419 cassava (Manihot esculenta) accessions(1).
Trait(2) Phenotypic classes
1. Apical leaf color Light green, dark green, purple green, and purple
2. Petiole color Yellow green, green, red green, green green, red, and purple
3. Stem cortex color Yellow, light green, and dark green 4. External stem color Orange, yellowish green, golden, light brown,
silver, gray, and dark brown 5. External root color White or cream, yellow, light brown, and dark
brown
6. Root cortex color White or cream, yellow, pink, and purple
7. Root flesh color White, cream, yellow, and pink
8. Developed leaf color Light green, dark green, purple green, and purple
9. Number of leaf lobes Three, five, seven, nine, and eleven lobes 10. Stem growth habit Zig-zag, and upright 11. Color of the terminal
branches on adult plants
Green, purple green, and purple
12. Branching habit Erect, dichotomic, trichotomic, and tetrachotomic
(1)Accessions of the germplam bank of the Escola Superior de Agricultura
Luiz de Queiroz, Universidade de São Paulo. (2)Morphological descriptors
regions, using the software Arlequin 3.0 (Excoffier et al., 2005). Binary data were also used to obtain a Jaccard dissimilarity index matrix, which was used to construct a dendrogram using the Unweighted Neighbor Joining method with the DARwin5 software (Perrier et al., 2003). A principal component analysis was performed, using the software Past (Hammer et al., 2001) in order to verify which characters contributed mostly for genotype discrimination.
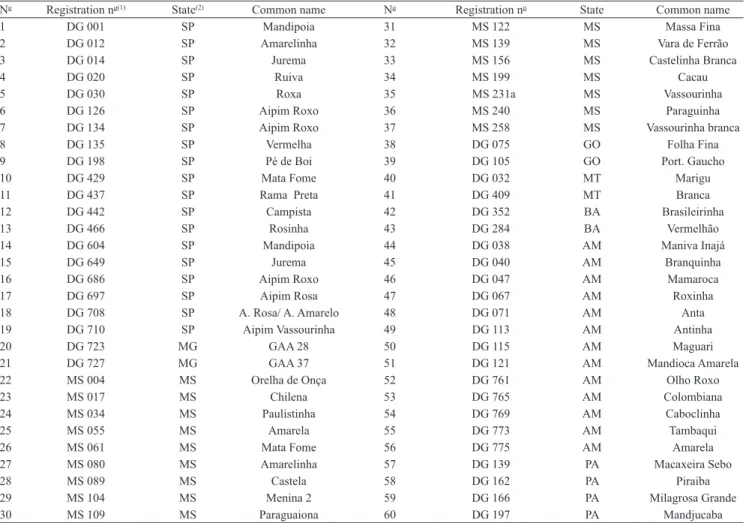
For the molecular analysis, 60 accessions were selected (Table 2) from each of the main Brazilian geographic regions: 17 accessions from the Amazon region, collected in the states of Amazonas and Pará; 20 accessions from the Central-West region, collected in the states of Mato Grosso do Sul, Mato Grosso and Goiás; 21 accessions from the Southeast region, collected in the states of São Paulo and Minas Gerais;
and two accessions from the Northeast, collected in the state of Bahia. The selection of these accessions was made in attempt to equally represent each region. The scarcity of accessions from Northeast region was due to their lack in the germplasm bank.
DNA extraction was performed according to the procedure described by Doyle & Doyle (1990), with modifications proposed by Siqueira et al. (2009). The genotypes were evaluated using 14 microsatellite loci, of which 11 were developed by Mba et al. (2001) (SSRY 8, SSRY 21, SSRY 27, SSRY 35, SSRY 40, SSRY 43, SSRY 141, SSRY 183, SSRY 185, SSRY 235, SSRY 324), and three developed by Chavarriaga-Aguirre et al. (1998) (GAGG 5, GA 12, GA 136). DNA was quantified on a 1% agarose gel electrophoresis using undigested lambda DNA (Invitrogen, SP, Brazil) as reference. Gel was photodocumented with the software
Table 2. List of 60 cassava (Manihot esculenta) genotypes selected for the microsatellite analysis.
No Registration no(1) State(2) Common name No Registration no State Common name
1 DG 001 SP Mandipoia 31 MS 122 MS Massa Fina
2 DG 012 SP Amarelinha 32 MS 139 MS Vara de Ferrão 3 DG 014 SP Jurema 33 MS 156 MS Castelinha Branca
4 DG 020 SP Ruiva 34 MS 199 MS Cacau
5 DG 030 SP Roxa 35 MS 231a MS Vassourinha
6 DG 126 SP Aipim Roxo 36 MS 240 MS Paraguinha
7 DG 134 SP Aipim Roxo 37 MS 258 MS Vassourinha branca
8 DG 135 SP Vermelha 38 DG 075 GO Folha Fina
9 DG 198 SP Pé de Boi 39 DG 105 GO Port. Gaucho
10 DG 429 SP Mata Fome 40 DG 032 MT Marigu
11 DG 437 SP Rama Preta 41 DG 409 MT Branca
12 DG 442 SP Campista 42 DG 352 BA Brasileirinha
13 DG 466 SP Rosinha 43 DG 284 BA Vermelhão
14 DG 604 SP Mandipoia 44 DG 038 AM Maniva Inajá
15 DG 649 SP Jurema 45 DG 040 AM Branquinha
16 DG 686 SP Aipim Roxo 46 DG 047 AM Mamaroca
17 DG 697 SP Aipim Rosa 47 DG 067 AM Roxinha
18 DG 708 SP A. Rosa/ A. Amarelo 48 DG 071 AM Anta 19 DG 710 SP Aipim Vassourinha 49 DG 113 AM Antinha
20 DG 723 MG GAA 28 50 DG 115 AM Maguari
21 DG 727 MG GAA 37 51 DG 121 AM Mandioca Amarela 22 MS 004 MS Orelha de Onça 52 DG 761 AM Olho Roxo
23 MS 017 MS Chilena 53 DG 765 AM Colombiana
24 MS 034 MS Paulistinha 54 DG 769 AM Caboclinha
25 MS 055 MS Amarela 55 DG 773 AM Tambaqui
26 MS 061 MS Mata Fome 56 DG 775 AM Amarela
27 MS 080 MS Amarelinha 57 DG 139 PA Macaxeira Sebo
28 MS 089 MS Castela 58 DG 162 PA Piraiba
29 MS 104 MS Menina 2 59 DG 166 PA Milagrosa Grande 30 MS 109 MS Paraguaiona 60 DG 197 PA Mandjucaba
(1)Registration number in the germplasm bank. (2)Varieties originated from the following Brazilian states: SP, São Paulo; MG, Minas Gerais; MS, Mato
Canon Utilities Remote Capture DC (Canon U.S.A., Melville-NY, USA).
The amplification reactions were performed in a 16 μL final volume, containing the following solutions: 1U Taq-polymerase, 1X buffer (10 mmol L-1 Tris-HCl,
pH 8.3, 50 mmol L-1 KCl), 2.4 mmol L-1 MgCl
2, 2.4 pmol
of primer F; 2.4 pmol of primer R, 3.2 mmol L-1 of
each dNTP, and 20 ng DNA. PCR reactions were performed using the touchdown technique in the MyCycler Thermal Cycler (BioRad, Rio de Janeiro, RJ, Brazil), using the following steps: an initial step of denaturation of 5 min at 94°C, followed by 10 cycles of pre-amplification (30 s at 95°C, 30 s initial 60°C annealing temperature, reducing 1°C at each cycle, and 50 s at 72°C); then, 30 cycles of denaturation (30 s at 95°C, 30 s at 50°C and 50 s at 72°C); and a final extension of 5 min at 72ºC.
The amplified material was separated on a 7% denaturing polyacrylamide gel. Electrophoresis was performed at 45 V cm-1 constant wattage. Band patterns
were visualized with silver staining procedure (Creste et al., 2001), then they were evaluated manually in a transilluminator, and photographed using a digital camera.
Molecular data was evaluated by the PopGene software (Yeh et al., 1997), which determined the genetic diversity indices, such as number of alleles per locus, percentage of polymorphic loci, observed and expected mean heterozygosity and Shannon diversity index for each group of accessions from each region (Amazon, Central-West, Southeast, and Northeast). We used the software FSTAT (Goudet, 2002) to estimate the following Nei (1973) diversity indices: HT (total species diversity), HS (within-group
diversity component), DST (between-group diversity
component), GST (proportion of genetic diversity
attributed to the between-group component, where GST = DST/HT). Cluster analysis was performed with the
software TFPGA (Miller, 1997) to obtain the Rogers distance matrix modified by Wright (1978), which was subsequently used to construct an unrooted tree by using the Unweighted Neighbor Joining method with DARwin5 software (Perrier et al., 2003).
Results and Discussion
A wide genetic variability was found among the 419 accessions for all characters, except for stem growth habit. Most accessions showed an upright
growth habit, while zigzag growth type was present in only one genotype (0.2%) (Figure 1). All possible phenotypic classes described by Fukuda et al. (2010) (Table 1) were observed for most traits, except for apical leaf color, petiole color, developed leaf color and number of leaf lobes.
Root flesh color is a trait with great commercial importance for sweet cassava because of dietary habits of each region. Moreover, this trait is directly related to the presence of compounds with vitamin activity – the yellow genotypes have higher concentrations of β-carotene (carotenoid with 100% pro-vitamin A activity) (Mezette et al., 2009). Low occurrence was found for yellow root color (8.7%) and pink root color genotypes (0.3%), which possibly have lycopene in their roots (Ferreira et al., 2008) (Figure 1). The predominant colors for root flesh color in the collection were white (49%) and cream (42%).
The characterization of plant materials using morphological traits has being used to assess the genetic diversity of cassava (Sambatti et al., 2001; Raghu et al., 2007; Benesi et al., 2010; Asare et al., 2011), to determine the divergence among genotypes (Vieira et al., 2008; Rimoldi et al., 2010), and to verify the correlation among agronomic traits (Vieira et al., 2008). The use of these characters allows rapid identification of germplasm bank accessions and has the advantage of the fact that most traits show a high heritability, without suffering interference from the environment (Fukuda et al., 2010). The 12 morphological descriptors used in this study allowed the classification of the 419 cassava genotypes into four distinct groups, with Jaccard dissimilarity index varying from 0.04 to 1.0.
The use of molecular markers may allow a more accurate detection of differences between genotypes than morphological characterization. However, the results from the morphological descriptors obtained here were quite similar to those obtained with molecular markers (Figures 2 and 3). A high genetic diversity was observed among the 60 genotypes selected for molecular analysis. Four groups were formed based on the location of sample collection. The number of alleles per polymorphic locus (A) varied from 2.46 (Northeast) to 3.93 (North and Central-West), with 3.53 on average (Table 3), a value comparable to the ones obtained by Peroni et al. (2007), Siqueira et al. (2010) and Alves-Pereira et al. (2011). Therefore,
data obtained in this study corroborate the literature on cassava germplasm assessment.
The mean percentage of polymorphic loci (P) was high (Table 3), which is in accordance with the literature data (Siqueira et al., 2009, 2010). The heterozygosity values obtained revealed a wide genetic variability. The groups had similar heterozygosity. Genotypes from the Northeast, with only two accessions, showed the lowest value, and the ones from Southeast, the highest. Expected heterozygosity (He) were in accordance
with the literature data (Siqueira et al., 2009, 2010; Alves-Pereira et al., 2011).
As for the Shannon diversity index, the lowest value was found with the Northeast genotypes, which is
Figure 1. Morphological descriptors evaluated in 419 genotypes of cassava (Manihot esculenta) collected in the North,
Northeast, Central West and Southeast of Brazil. A, apical leaf color; B, petiole color; C, developed leaf color; D, color of the
terminal branches; E, number of leaf lobes in adult plants; F, branching habit; G, external stem color; H, external root color; I, stem cortex color; J, root cortex color; K, stem growth habit; L, root flesh color. Morphological descriptors according to Fukuda et al. (2010).
0 20 40 60 80 Dark green Purple green Purple Accessions (%) A 0 10 20 30 Yellow green Green Red green Green green Red Purple B 0 20 40 60 Light green Dark green Purple green Purple C Light green 0 10 20 30 40 OrangeYellowish
green Golden Lightbrown Silver Gray brownDark G 0 20 40 60 80
White or Yellow Light Dark 0
10 20 30 40 50
Yellow Light Dark
I
Accessions (%)
cream brown brown
H green green 0 20 40 60 80
White or Yellow Pink Purple J 0 20 40 60 80 100 120 Upright Zig-zag K 0 20 40 60
White Cream Yellow Pink
L Accessions (%) cream 0 20 40 60 80
Figure 2. Rootless tree obtained by the Unweighted Neighbor Joining method and Jaccard dissimilarity index, based on 12 morphological characters for 419 cassava (Manihot esculenta) accessions, collected from the North (N), Northeast (NE),
Central West (CW) and Southeast (SE) regions of Brazil. NI, nonidentified origin.
consistent with the small number of accessions evaluated in this region. The high levels of diversity obtained for all regions, except for the Northeast, suggest that recombination and gene flow can play an important role in the preservation of this species diversity. Cassava, despite being vegetatively propagated, still maintains sexual reproduction. Moreover, it has easy pollination and fruit dehiscence (Martins & Oliveira, 2009; McKey et al., 2010). These facts may help to explain the high diversity found in the present work.
Total genetic diversity (HT = 0.678) confirms the
high genetic diversity among the evaluated materials. Similarly to the morphological data, most of this diversity was concentrated within regions (HS = 0.651),
varying from 0.480 for locus SSRY 35 to 0.782 for locus GA 136. Genetic diversity proportion between groups (GST = 0.041) was low, which agrees with data
obtained by Siqueira et al. (2010), who reported HT = 0.668, with most of the diversity concentrated
Cluster analysis classified the 60 accessions into three main groups, showing random distribution of the genotypes (Figure 3). This can be justified by the fact that cassava has a reproductive system which favors outcrossing, and this plant can also be propagated vegetatively, which facilitates the dispersion of genotypes, the exchange among farmers and, consequently, the exchange of alleles (Martins
Figure 3. Rootless tree obtained by the Unweighted Neighbor Joining method and Rogers distance matrix, based on 14 microsatellite loci for 60 cassava (Manihot esculenta) accessions, collected from the North (N), Northeast (NE), Central West
(CW) and Southeast (SE) regions of Brazil.
cassava germplasm from Malawi. Journal of Biological Sciences, v.10, p.616-623, 2010. DOI: 10.3923/jbs.2010.616.623.
CHAVARRIAGA-AGUIRRE, P.; MAYA, M.M.; BONIERBALE, M.W.; KRESOVICH, S.; FREGENE, M.A.; TOHME, J.;
KOCHERT, G. Microsatelites in cassava (Manihot esculenta
Crantz): discovery, inheritance and variability. Theoretical
and Applied Genetics, v.97, p.493-501, 1998. DOI: 10.1007/
s001220050922.
COSTA, T.R. da; VIDIGAL-FILHO, P.S.; GONÇALVES-VIDIGAL, M.C.; GALVÁN, M.Z.; LACANALLO, G.F.; SILVA, L.I. da; KVITSCHAL, M.V. Genetic diversity and population structure
of sweet cassava using simple sequence repeat (SSR) molecular markers. African Journal of Biotechnology, v.12, p.1040-1048, 2013. DOI: 10.5897/AJB12.2727.
CRESTE, S.; TULMANN NETO, A.; FIGUEIRA, A. Detection of
single sequence repeat polymorphisms in denaturing polyacrilamide sequencing gels by silver staining. Plant Molecular Biology
Reporter, v.19, p.299-306, 2001. DOI: 10.1007/BF02772828.
DOYLE, J.J.; DOYLE, J.L. Isolation of plant DNA from fresh
tissue. Focus, v.12, p.13-15, 1990.
EXCOFFIER, L.; LAVAL, G.; SCHNEIDER, S. Arlequin (version
3.0): an integrated software package for population genetics data analysis. Evolutionary Bioinformatics Online, v.1, p.47-50, 2005.
FOOD AND AGRICULTURE ORGANIZATION OF THE
UNITED NATIONS. FAOSTAT. 2011. Available at: <http:// faostat.fao.org>. Accessed on: 30 May 2013.
FERREIRA, C.F.; ALVES, E.; PESTANA, K.N.; JUNGHANS, D.T.; KOBAYASHI, A.K.; SANTOS, V. de J.; SILVA, R.P.; SILVA, P.H.; SOARES, E.; FUKUDA, W. Molecular characterization of
cassava (Manihot esculenta Crantz) with yellow-orange roots for beta-carotene improvement. Crop Breeding and Applied Biotechnology, v.8, p.23-29, 2008.
FREGENE, M.; SUAREZ, M.; MKUMBIRA, J.; KULEMBEKA, H.; NDEDYA, E.; KULAYA, A.; MITCHEL, S.; GULLBERG, U.; ROSLING, H.; DIXON, A.; DEAN, R.; KRESOVICH, S.
Simple sequence repeat marker diversity in cassava landraces: genetic diversity and differentiation in asexually propagated crop.
Theoretical and Applied Genetics, v.107, p.1083-1093, 2003.
DOI: 10.1007/s00122-003-1348-3.
FUKUDA, W.M.G.; GUEVARA, C.L.; KAWUKI, R.; FERGUSON, M.E. Selected morphological and agronomic descriptors for the caracterization of cassava. Iban: International Institute of Tropical Agriculture, 2010. 19p.
GOUDET, J. FSTAT: a computer program to calculate F-statistics.
Version 1.2. 2002. Available at: <http://www2.unil.ch/popgen/ softwares/fstat.htm>. Accessed on: 10 Apr. 2010.
HAMMER, O.; HARPER, D.A.T.; RYAN, P.D. PAST: paleontological statistics software package for education and data analysis. Paleontologia Electronica, v.4, p.1-9, 2001.
LOKKO, Y.; DIXON, A.; OFFEI, S.; DANQUAH, E.; FREGENE,
M. Assessment of genetic diversity among African cassava
Manihot esculenta Grantz accessions resistant to the cassava
mosaic virus disease using SSR markers. Genetic Resources
this may be due to allelic dispersion by geographically distant regions and to an indirect gene flow, i.e., the exchange of cuttings between farmers.
Conclusions
1. There is high genetic diversity among cassava genotypes.
2. Diversity is not spatially structured, and allelic similarity among genotypes from each of the studied regions suggests an indirect gene flow promoted by man.
3. Most of the genetic diversity is distributed within regions.
Acknowledgments
To Fundação de Amaparo à Pesquisa do Estado de São Paulo (Fapesp), for financial support and schoolarships.
References
ALVES-PEREIRA, A.; PERONI, N.; ABREU, A.G.; GRIBEL, R.; CLEMENT, C.R. Genetic structure of traditional varieties of
bitter manioc in three soils in central Amazonia. Genetica, v.139, p.1259-1271, 2011. DOI: 10.1007/s10709-011-9627-4.
ASARE, P.A.; LABUSCHAGNE, M.T.; HERSELMAN, L.;
MAHUNGU, N. Morphological and molecular based diversity studies of some cassava (Manihot esculenta Crantz) germplasm in Ghana. African Journal of Biotechnology, v.10, p.13900-13908, 2011.
BENESI, I.R.M.; LABUSCHAGNE, M.T.; HERSELMAN, L.;
MAHUNGU, N. Ethnobotany, morphology and genotyping of
Table 3. Estimated genetic diversity indexes obtained from 14 SSR loci, including number of analyzed individuals (N), mean number of alleles per locus (A), percentage of polymorphic loci (P), average observed (Ho) and expected (He) heterozygosity, and Shannon index for cassava (Manihot esculenta) accessions collected in the four regions.
and Crop Evolution, v.53, p.1441-1453, 2006. DOI: 10.1007/ s10722-005-6841-x.
MARTINS, P.S.; OLIVEIRA, G.C.X. Dinâmica evolutiva em roças de caboclos amazônicos. In: VIEIRA, I.C.G.; SILVA, J.M.C.
da; OREN, D.C.; D’INCAO, M.A. (Ed.). Diversidade biológica
e cultural da Amazônia. 2.ed. Belém: Museu Paraense Emílio
Goeldi, 2009. p.373-391.
MBA, R.E.C.; STEPHENSON, P.; EDWARDS, K.; MELZER, S.; NKUMBIRA, J.; GULLBERG, U.; APEL, K.; GALE, M.; TOHME, J.; FREGENE, M. Simple sequence repeat (SSR) markers survey of the cassava (Manihot esculenta Crantz) genome: towards an SSR-based molecular genetic map of cassava. Theoretical
and Applied Genetics, v.102, p.21-31, 2001. DOI: 10.1007/
s001220051614.
MCKEY, D.; ELIAS, M.; PUJOL, B.; DUPUTIE, A. The evolutionary ecology of clonally propagated domesticated plants.
New Phytologist, v.186, p.318-332, 2010. DOI: 10.1111/j.1469-8
137.2010.03210.x.
MEZETTE, T.F.; CARVALHO, C.R.L.; MORGANO, M.A.; SILVA, M.G. da; PARRA, E.S.B.; GALERA, J.M.S.V.; VALLE, T.L. Seleção de clones-elite de mandioca de mesa visando a
características agronômicas, tecnológicas e químicas. Bragantia, v.68, p.601-609, 2009. DOI: 10.1590/S0006-87052009000300006.
MILLER, M.P. Tools for population genetic analyses (TFPGA): a windows program for the analysis of allozyme and molecular population genetic data. Version 1.3. 1997. Available at: <http:// www.public.asu.edu>. Accessed on: 15 Apr. 1998.
MONTERO-ROJAS, M.; CORREA, A.M.; SIRITUNGA, D. Molecular differentiation and diversity of cassava (Manihot
esculenta) taken from 162 locations across Puerto Rico and
assessed with microsatellite markers. AoB Plants, v.2011, plr010, 2011. DOI: 10.1093/aobpla/plr010.
MOYIB, O.K.; ODUNOLA, O.A.; DIXON, A.G.O. SSR markers
reveal genetic variation between improved cassava cultivars and landraces within a collection of Nigerian cassava germplasm.
African Journal of Biotechnology, v.6, p.2666-2674, 2007.
NEI, M. Analysis of gene diversity in subdivided populations.
Proceedings of the National Academy of Science of the United
States of America, v.70, p.3321-3323, 1973. DOI: 10.1073/
pnas.70.12.3321.
OLIVEIRA, M.V.C.; BALIZA, D.P.; SOUZA, G.A.; CARVALHO, S.P.; ASSIS, L.H.B. Caracterização de clones de mandioca utilizando
marcadores microssatélites. Revista Ciência Agronômica, v.43, p.170-176, 2012. DOI: 10.1590/S1806-66902012000100021.
PERONI, N.; KAGEYAMA, P.Y.; BEGOSSI, A. Molecular
differentiation, diversity, and folk classification of ‘‘sweet’’ and ‘‘bitter’’ cassava (Manihot esculenta) in Caiçara and Caboclo management systems (Brazil). Genetic Resources
and Crop Evolution, v.54, p.1333-1349, 2007. DOI: 10.1007/
s10722-006-9116-2.
PERRIER, X.; FLORI, A.; BONNOT, F. Data analysis methods.
In: HAMON, P.; SEGUIN, M.; PERRIER, X.; GLASZMANN,
J.C. (Ed.). Genetic diversity of cultivated tropical plants. Montpellier: Science Publishers, 2003. p.43-76.
RAGHU, D.; SENTHIL, N.; SARASWATHI, T.;
RAVEENDRAN, M.; GNANAM, R.; VENKATACHALAM, R.;
SHANMUGASUNDARAM, P.; MOHAN, C. Morphological
and simple sequence repeats (SSR) based finger printing of South
Indian cassava germplasm. International Journal of Integrative Biology, v.1, p.141-148, 2007.
RIMOLDI, F.; VIDIGAL FILHO, P.S.; KVITSCHAL, M.V.; GONÇALVES-VIDIGAL, M.C.; PRIOLI, A.J.; PRIOLI,
S.M.A.P.; COSTA, T.R. Genetic divergence in sweet cassava cultivars using morphological agronomic traits and RAPD molecular markers. Brazilian Archives of Biology
and Technology, v.53, p.1477-1486, 2010. DOI: 10.1590/
S1516-89132010000600025.
SAMBATTI, J.B.M.; MARTINS, P.S.; ANDO, A. Folk taxonomy
and evolutionary dynamics of cassava: a case study in Ubatuba, Brazil. Economic Botany, v.55, p.93-105, 2001. DOI: 10.1007/
BF02864549.
SANTOS, H.G. dos; JACOMINE, P.K.T.; ANJOS, L.H.C. dos; OLIVEIRA, V.A. de; OLIVEIRA, J.B. de; COELHO, M.R.; LUMBRERAS, J.F.; CUNHA, T.J.F. (Ed.). Sistema brasileiro de classificação de solos. 2.ed. Rio de Janeiro: Embrapa Solos, 2006. 306p.
SIQUEIRA, M.V.B.M.; QUEIROZ-SILVA, J.R.; BRESSAN, E.A.;
BORGES, A.; PEREIRA, K.J.C.; PINTO, J.G.; VEASEY, E.A. Genetic characterization of cassava (Manihot esculenta) landraces in Brazil assessed with simple sequence repeats. Genetics and
Molecular Biology, v.32, p.104-110, 2009. DOI: 10.1590/
S1415-47572009005000010.
SIQUEIRA, M.V.B.M.; PINHEIRO, T.T.; BORGES, A.; VALLE, T.L.; ZATARIM, M.; VEASEY, E.A. Microsatellite polymorphisms
in cassava landraces from the Cerrado biome, Mato Grosso do Sul, Brazil. Biochemical Genetics, v.48, p.879-895, 2010. DOI: 10.1007/s10528-010-9369-5.
VIEIRA, E.A.; FIALHO, J. de F.; FALEIRO, F.G.; BELLON,
G.; FONSECA, K.G. de; CARVALHO, L.J.C.B.; SILVA, M.S.;
PAULA-MORAES, S.V. de; SANTOS FILHO, M.O.S. dos;
SILVA, K.N. da. Divergência genética entre acessos açucarados e não açucarados de mandioca. Pesquisa Agropecuária
Brasileira, v.43, p.1707-1715, 2008. DOI: 10.1590/
S0100-204X2008001200010.
WRIGHT, S. Evolution and the genetics of populations. 4.
Variability within and among natural populations. Chicago:
University of Chicago, 1978. 590p.
YEH, F.C.; YANG, R.-C.; BOYLE, T.B.J.; YE, Z.-H.; MAO, J.X.
POPGENE: the user-friendly shareware for population genetic
analysis. Edmonton: Molecular Biology and Biotechnology Centre, 1997.