http://dx.doi.org/10.1590/1806-9061-2016-0305
Broilers
Author(s)
Pascariu SMI Pop IMI Simeanu DI Pavel GI Solcan CI
I Faculty of Animal Sciences, “Ion Ionescu de la Brad” University of Agricultural Sciences and Veterinary Medicine of Iasi, Street Ale-ea Mihail SadovAle-eanu, No. 3, 700489, Ro-mania.
Mail Address
Corresponding author e-mail address Silvia Mariana Pascariu
University of Agricultural Sciences and Veterinary Medicine from Iasi, Faculty of Animal Sciences, Aleea Mihail Sadoveanu No. 3, Iasi, Iasi, Romania - 700489 Tel: (0040) 742781879 Email: [email protected]
Keywords
Grape pomace, growing, polyphenols.
Submitted: November/2016 Approved: February/2017
ABSTRACT
This study aimed to investigate the effect of whole grape pomace (GP), grape seed (GS) and grape pomace polyphenolic extract (GPEP) on growth performance, total antioxidant status (TAS) and complete blood count (CBC) of 40-day-old chicks (hybrid Cobb 500). A total of 432 unsexed one-day-old chicks were divided into six groups: control (CON) and five experimental groups, 10 g/kg GP, 20 g/kg GP, 5 g/kg GS, 10 g/kg GS and 15 mL/L GPEP. The results showed a higher increase in growing rate in 5 g/kg GS group, from the first week of the chicks’ life throughout their growth, the average body weight of the chicks being significantly higher (p<0.01) than CON. The broilers that received 5 g/ kg seeds in the diet, 10 g/kg and 20 g/kg GP respectively, have achieved a better feed conversion ratio (FCR) than CON. The introduction of GPEP in drinking water has significantly affected (p<0.05) the growth performance in the fourth week of the experiment, lower weight gains could be due to high levels of polyphenols in grape pomace extract that may have a delayed effect on the growth of chickens. The CBC and TAS were not affected by dietary treatments (p>0.05) at 40 days of age. As a conclusion, the amount of 5 g/kg seeds, 10 g/kg and 20 g/kg pomace, can be added to the diet of the broilers, the dose of 5 g/kg seeds in the diet offering advantages in growing rate and feed valorization in weight gain.
INTRODUCTION
The wine industry produces large quantities of grape pomace that consists of skins, seeds and a few fragments of stalk, annually. According to the International Organization of Vine and Wine (OIV) this by-product is about 20% of the total weight of the harvested grapes (Vitis vinifera) (Sui et al., 2014).
Recent studies have underlined the importance of the wine industry by-products as plant materials that are particularly rich in polyphenols with a variety of biological activities (Alonso et al., 2002; Xia et al.,2010).
Currently, grape pomace is partially recovered only for oil extraction from seeds, used as an additional source of oil in the pharmaceutical industry due to some pharmacodynamic properties: antioxidant, antibacterial, anticarcinogenic, antiinflammatory, antiatherosclerotic (Arvanitoyannis et al., 2006; Xia et al., 2010).
Studies on the chemical composition of the grape pomace revealed its high content of proteins, fibres, sugars, fats, minerals, vitamins and in particular the phenolic compounds (Alonso et al., 2002; Bonilla et al.,
1999; Aslanian et al., 2011; Pop et al., 2014) which justify the use of this by-product in animal nutrition (Baumgärtel et al., 2007; Zalikarenab
et al., 2007).
maceration-fermentation process into the grape juice and wine, up to 50% of them, the rest remaining in the grape pomace (Bişboacă, 2012).
The extracts obtained from grape seeds and pomace contain large quantities of monomeric phenolic compounds such as (+) - catechins, (-) - epicathechine and (-) - epicatechin-3-O-gallate, and dimeric, trimeric and tetrameric proanthocyanidins (Saito et al., 1998). The biological activity of these polyphenols depends on their bioavailability and can be exercised at local (intestinal tract) and systemic level (Scalbert & Williamson, 2000; Hervert-Hernández et al., 2009).
Some studies have shown that the proanthocyanidins may be responsible for the weight loss and the reduction of nutrient digestibility in humans and rats (Chung et al., 1988; Butler & Rogler 1992). Polyphenols, particularly condensed tannins, have the ability to aggregate and precipitate proteins that may affect the use of macronutrients by forming tannin-protein complex combinations of both endogenous proteins and those derived from feed (Hagerman & Butler, 1980; Jansman et al., 1994).
In literature, there are few data regarding the effect on growth performances of broilers chicks fed with winemaking by-products (Brenes et al., 2008; Brenes
et al., 2010; Chamorro et al., 2012).
Thanks to the large quantities available and bioactive compounds contained, the grape pomace can be used in broiler chickens diets, but first it is necessary to know the influence on the productive performances.
This study aimed to establish the effect of wine by-products (grape pomace, grape seed and grape pomace polyphenolic extract) on growth performance, the total antioxidant status and cell blood count throughout the growth period of 40-day-old broilers.
MATERIALS AND METHODS
Materials
The pressed and fermented grape pomace (GP)
resulted from the red grapes (Fetească neagră)
vinification process was obtained from the Research Station (V. Adamachi farm) of Agricultural Sciences and Veterinary Medicine University of Iasi and undergone a natural drying process, in a clean and well ventilated space, at a constant temperature of 20°C.
Grape pomace consisted of skins, seeds and a small amount of stalks (~10%). A portion of the fresh grape pomace was separated from the seeds before drying. The separation of the seeds was done manually using fiberglass strainer and a strainer with a 2 mm diameter mesh.
After drying, samples of whole grape pomace and seeds were taken in order to determine the chemical composition. Preparation of test samples met the requirements of ISO 6498, 2012 methods. The samples were ground with Grindomix GM 200 mill to obtain a powder with particles of 1 mm in diameter.
Content determination
The determination of the crude chemical content from the grape pomace and seeds was made using International Organization for Standardization standardized methods (ISO 5983 2005; ISO 2171, 2010; ISO 6865, 2002; ISO 6498, 2001; ISO 6496, 2001; ISO 6492, 2001), the polyphenols and tannins being determinated by the Folin Ciocalteu method using gallic acid as standard described by Singleton & Rossi (1965) and Tarcău et al. (2013). Each sample was analysed three times.
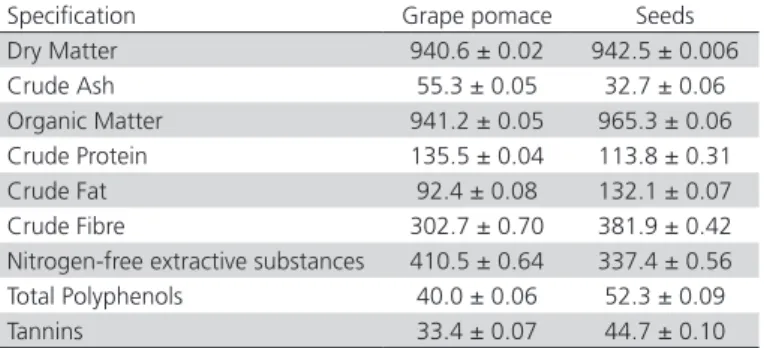
The proximate chemical content of the grape pomace and seeds in dry matter, crude ash, crude protein, crude fat, crude cellulose, nitrogen-free extractive substances and the content in polyphenolic compounds are presented in Table 1.
Table 1 – Proximate composition of grape pomace and seeds (g/kg dry matter)
Specification Grape pomace Seeds Dry Matter 940.6 ± 0.02 942.5 ± 0.006 Crude Ash 55.3 ± 0.05 32.7 ± 0.06 Organic Matter 941.2 ± 0.05 965.3 ± 0.06 Crude Protein 135.5 ± 0.04 113.8 ± 0.31 Crude Fat 92.4 ± 0.08 132.1 ± 0.07 Crude Fibre 302.7 ± 0.70 381.9 ± 0.42 Nitrogen-free extractive substances 410.5 ± 0.64 337.4 ± 0.56 Total Polyphenols 40.0 ± 0.06 52.3 ± 0.09 Tannins 33.4 ± 0.07 44.7 ± 0.10
Data are the mean of 3 determinations ± SD
Experimental design
The feed was conceived in order to meet the requirements of broilers at all stages of growth, as recommended in the guide of nutritional management for the studied hybrid (COBB 500). Three distinct diets were elaborated, specific to each growth period of the studied chickens, namely: starter, grower and finisher feeds [Table S1, S2, S3 (supplementary)]. Both water and feed were given “ad libitum” to all the six groups.
In chickens feed from the experimental groups (10 g/kg GP, 20 g/kg GP, 5 g/kg GS, 10 g/kg GS) grape pomace and ground seeds were introduced, from the first day of their life until slaughter (40 days).
In the drinking water of the experimental group GPEP, 15 mL/L aqueous polyphenolic extract from pomace was introduced, with an average polyphenolic concentration of 1.82 g GAE /100 mL, from the chicks’ age of 8 days till their slaughter (40 days).
The process for obtaining aqueous polyphenols extract from grape pomace used in the drinking water of broilers was followed according to patent specification (RO 125704) described by Bişboacă (2012). Dry grape
pomace was ground by Grindomix GM 200 grinding mill to particles of 1 mm in diameter. The process for extracting the polyphenols was made using an aqueous solution of ethanol 50% (v /v). The extract obtained was filtered through a Whatman No. 4 filter paper to remove unwanted residues. The resulting alcoholic filtrate was charged on a rotary evaporator (Heidolph Laborota 4002 control) to recover the alcohol, resulting in a concentrated aqueous solution of polyphenols that was stored in a sealed brown bottle at temperature of 4°C.
The assessment of growing rate was made by weekly weighing each individual of the entire flock. The average body weight was appreciated following the broiler chickens weighting, for each group, and the difference between the current average body weight and the previous average weight established the weekly and total weight gain of chicks in the group.
Data on weekly feed intake were also registered to estimate the total feed intake and the feed conversion ratio (FCR) (kg fodder/kg gain) and flock losses.
Table S1 – Ingredients and nutrient composition of the Starter Diet [0-10 d] (g/kg as fed)
Feed Ingredients CON and GPEP 10 g/kg GP 20 g/kg GP 5 g/kg GS 10 g/kg GS
Corn 382.8 372.5 370.7 381.8 380.0
DDGS 75.0 75.0 75.0 75.0 75.0
Grape pomace - 10 20
Grape seeds - - - 5 10
Wheat 120.0 120.0 110.0 115.0 110.0
Soybean meal 293.0 292 292.7 293.5 294
Full fat soybean 70.0 70.0 70.0 70.0 70.5
Vegetable oil 10.0 11.5 12.5 10.5 11.3
DL-Methionine 4.0 4.0 4.0 4.0 4.0
L-Lysine 4.0 4.0 4.0 4.0 4.0
L-Threonine 1.0 1.0 1.0 1.0 1.0
Calcium carbonate 18.0 18.0 18.0 18.0 18.0
Monocalcium phosphate 13.2 13 13.1 13.2 13.2
Salt 3.3 3.3 3.3 3.3 3.3
Broiler Premix1 5.0 5.0 5.0 5.0 5.0
Salinomax - - - -
-Avatec 0.7 0.7 0.7 0.7 0.7
Analysed composition
ME (Kcal/kg) 2935 2935 2935 2934 2934
Crude protein 231.7 231.7 231.7 231.7 231.7
Methionine +Cystine 11.15 11.10 11.06 11.13 11.11
Lysine 14.40 14.34 14.33 14.39 14.40
Crude fiber 34.66 37.24 39.86 36.35 38.06
Calcium 11.04 11.00 11.02 11.04 11.04
Available phosphorus (t) 6.0 5.97 5.92 6.0 5.97
Crude fat 52.2 54.16 55.77 53.23 54.59
Protein‐energy ratio 12.66 12.66 12.66 12.66 12.66
1Premix (ROVIMIX®) supplied the following per kilogram of diet: vitamin A, 13.500 IU; cholecalciferol, 2500 IU; vitamine E, 80 mg; vitamin K, 3.0 mg; vitamin B
1, 3.0 mg; vitamin B2,
8.0 mg; vitamin B6 5.0 mg; vitamin B12, 16 µg; niacin, 60 mg; pantothenate, 15 mg; folic acid 2.0 mg; biotin, 0.20 mg; L-ascorbic acid, 50 mg; 25-hydroxycholecalciferol, 62.5 µg; choline, 200 mg; calcium iodide, 1.25 mg; Se, 0.30 mg; Fe, 40 mg; Mn, 120 mg; Cu, 16 mg; Zn, 110 mg; Endo-1,4-b-glucanase (RONOZYME ®VP CT), 150 FBC; Endo-1,4-b-Xylanase
At the end of the experimental period (40 days) the Production Efficiency Factor (PEF) was calculated, based on the formula:
× 100
Liveability × Live Weight in kg Age in days × FCR
Blood samples collection
At 40-days-of age, 6 birds were randomly selected from each treatment and blood samples were obtained from axillaries veins and collected into vials containing K3- EDTA for the determination of CBC. For total antioxidant status determination, the blood was collected in dry tubes from which we obtained serum by centrifugation at 1800×g for 5 min. Serum samples were stored without further preparation at -20°C until use for TAS measurement.
Assay of complete blood count
The red blood cell (RBC) count was determined by hemocytometer method using Natt-Herrick solution; according to Campbell (1995), hematocrit (HCT) and hemoglobin (Hb) values were measured by
microhematocrit and cyanmethemoglobin methods respectively (Pierson, 2000). The mean corpuscular volume (MCV), mean corpuscular hemoglobin (MCH) and mean corpuscular hemoglobin concentration (MCHC) were computed according to Campbell (1988).
The TAS assay using ABTS method
The total serum antioxidant status was assayed using Randox kite components (metmyoglobin, hydrogen peroxide, ABTS chromogen, phosphate buffered saline, sample of control serum, and Trolox as an equivalent antioxidant capacity standard) according to Miller (1993). Calibration of the assay was done using 6-hydroxy-2, 5, 7, 8-tetramethylchroman-2-carboxylic acid (Trolox). The results were expressed in mmol/L of trolox equivalent antioxidant capacity (TEAC), using a trolox standard curve ranging from 0 to 2.29 mmol/L. Measurements were carried out on RX Imola (Crumlin, England) automatic biochemical analyser, according to instructions provided by the Randox Co.
Table S2 – Ingredients and nutrient composition of the Grower Diet [11- 26 d] (g/kg as fed)
Feed Ingredients CON and GPEP 10 g/kg GP 20 g/kg GP 5 g/kg GS 10 g/kg GS
Corn 362.0 360.5 358.5 362.5 360.0
Grape pomace - 10 20
Grape seeds - - - 5 10
Wheat 200.0 190.0 180.0 193.0 189.0
Soybean meal 336.5 337.0 338.0 337.5 338.0
Vegetable oil 62.5 63.5 64.5 63 63.8
DL-Methionine 3.3 3.3 3.3 3.3 3.3
L-Lysine 1.7 1.7 1.7 1.7 1.7
L-Threonine 0.4 0.4 0.4 0.4 0.4
Calcium carbonate 11.5 11.5 11.5 11.5 11.5
Monocalcium phosphate 12.2 12.2 12.2 12.2 12.4
Salt 3.6 3.6 3.6 3.6 3.6
Broiler Premix1 5.0 5.0 5.0 5.0 5.0
Salinomax 0.6 0.6 0.6 0.6 0.6
Avatec 0.7 0.7 0.7 0.7 0.7
Analysed composition
ME (Kcal/kg) 3121 3121 3121 3121 3121
Crude protein 213.0 213.0 213.0 213.0 213.0
Methionine +Cystine 9.73 9.68 9.65 9.71 9.69
Lysine 11.74 11.72 11.71 11.74 11.74
Crude fiber 28.62 31.23 33.87 30.32 32.00
Calcium 8.08 8.07 8.07 8.08 8.12
Available phosphorus (t) 5.8 5.76 5.73 5.78 5.80
Crude fat 86.2 87.8 89.4 87.2 88.4
Protein‐energy ratio 14.65 14.65 14.65 14.65 14.65
1Premix (ROVIMIX®) supplied the following per kilogram of diet: vitamin A, 13.000 IU; cholecalciferol, 2500 IU; vitamine E, 70 mg; vitamin K, 3.0 mg; vitamin B
1, 3.0 mg; vitamin B2,
7.0 mg; vitamin B6 4.0 mg; vitamin B12, 15 µg; niacin, 60 mg; pantothenate, 15 mg; folic acid 1.8 mg; biotin, 0.20 mg; L-ascorbic acid, 50 mg; 25-hydroxycholecalciferol, 62.5 µg; choline, 200 mg; calcium iodide, 1.25 mg; Se, 0.30 mg; Fe, 40 mg; Mn, 120 mg; Cu, 16 mg; Zn, 110 mg; Endo-1,4-b-glucanase (RONOZYME ®VP CT), 150 FBC; Endo-1,4-b-Xylanase
Statistical Analysis
The results were statistically processed using one way analysis of variance (ANOVA test) to highlight the significant differences between all groups, followed by Fisher’s test (test for two samples variances) and Student’s t-test to quantify the significant differences between control and each experimental group. Mean value and SD are reported for body weight. All statements of significance were based on p<0.05. All data were automatically analyzed by computer using Microsoft Office 2010 software package (Microsoft Inc., USA).
RESULTS
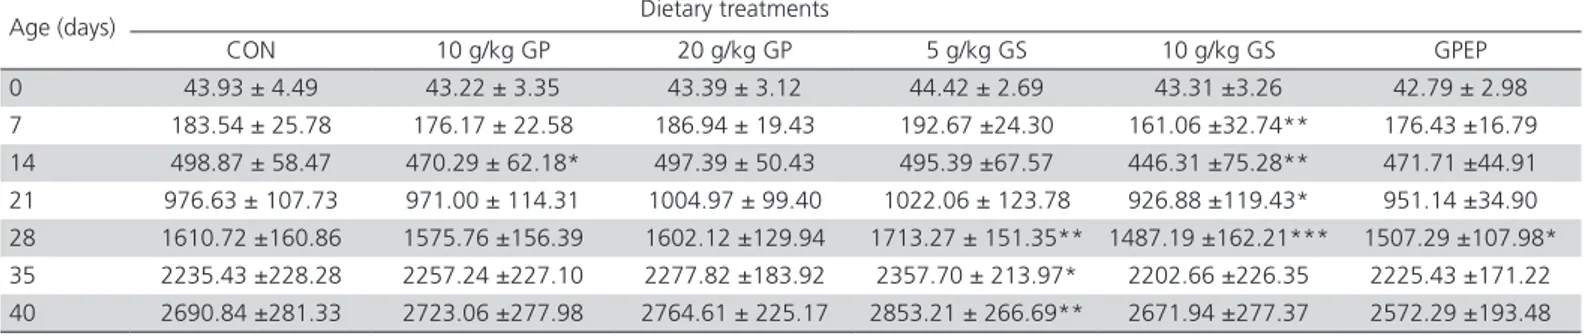
Average body weight has insignificantly increased (p>0.05) for chickens from the experimental groups receiving 10 g/kg GP and 20 g/kg GP in the diet and significantly (p<0.01) for chickens from 5 g/kg GS group (Table 2).
Instead, chickens from 10 g/kg GS group decreased significantly in weight (p<0.01) from the first week of
growth, with very significant differences (p<0.001) in the fourth week versus the control group. Over the following days, the average body weight of chicks in 10 g/kg GS group still remained low, without significant statistical differences versus the control group.
Regarding the GPEP group chickens, they showed a weight loss from the first two weeks of aqueous polyphenols extract administration in drinking water, but was significantly lower in the third week of administration.
The group that received 5 g/kg grape seeds showed throughout the growth period a good response in term of average body weight, with statistically significant differences from the fourth week of experiment.
At the end of the experiment, the highest average body weight was recorded in the experimental 5 g/kg GS group, with 6.03%, higher than the control group, followed by those receiving 20 g/kg GP (2.74%) and 10 g/kg GP group (1.20%). The lowest average body weights were recorded in the GPEP group, with 4.41% and 10 g/kg GS group with 0.70%.
Table S3 – Ingredients and nutrient composition of the Finisher Diet [27- 40 d] (g/kg as fed)
Feed Ingredients CON and GPEP 10 g/kg GP 20 g/kg GP 5 g/kg GS 10 g/kg GS
Corn 416.0 414.0 411.8 414.0 412.7
Grape pomace - 10 20
Grape seeds - - - 5 10
Wheat 200.0 190 180 195.3 190
Soybean meal 285.0 285.8 286.7 285.7 286.5
Vegetable oil 62.3 63.5 64.7 63.2 64
DL-Methionine 2.8 2.8 2.8 2.8 2.8
L-Lysine 1.4 1.4 1.4 1.4 1.4
L-Threonine 0.5 0.5 0.5 0.5 0.5
Calcium carbonate 11.0 11.0 10.8 11.0 11.0
Monocalcium phosphate 11.4 11.4 11.7 11.5 11.5
Salt 3.3 3.3 3.3 3.3 3.3
Broiler Premix1 5.0 5.0 5.0 5.0 5.0
Salinomax 0.6 0.6 0.6 0.6 0.6
Avatec 0.7 0.7 0.7 0.7 0.7
Analysed composition
ME (Kcal/kg) 3180 3180 3180 3180 3180
Crude protein 193.3 193.3 193.3 193.3 193.3
Methionine +Cystine 8.79 8.75 8.70 8.77 8.75
Lysine 10.27 10.25 10.24 10.27 10.27
Crude fiber 27.22 29.84 32.46 28.91 30.60
Calcium 7.59 7.58 7.56 7.61 7.61
Available phosphorus (t) 5.48 5.45 5.47 5.49 5.47
Crude fat 87.2 89.0 90.8 88.6 89.9
Protein‐energy ratio 16.45 16.45 16.45 16.45 16.45
1Premix (ROVIMIX®) supplied the following per kilogram of diet: vitamin A, 12.000 IU; cholecalciferol, 3480 IU; vitamin E, 60 mg; vitamin K, 3.0 mg; vitamin B
1, 3.0 mg; vitamin B2,
7.0 mg; vitamin B6 3.0 mg; vitamin B12, 15 µg; niacin, 40 mg; pantothenate, 15 mg; folic acid 1.5 mg; biotin, 0.15 mg; L-ascorbic acid, 50 mg; 25-hydroxycholecalciferol, 37.5 µg; choline, 150 mg; calcium iodide, 1.25 mg; Se, 0.30 mg; Fe, 40 mg; Mn, 120 mg; Cu, 16 mg; Zn, 100 mg; Endo-1,4-b-glucanase (RONOZYME ®VP CT), 150 FBC; Endo-1,4-b-Xylanase
During the growth period, the weekly body weight gain of chicken from the experimental groups showed varying values (Table 3). So, the values of GP groups were similar to those obtained in control group in the first three weeks of growth. There was an exception for 10 g/kg GP group, recording in the second week a
6.84% lower average weekly gain, correlated with the recorded body weight (p<0.05). Higher weight gains of the two groups fed with grape pomace were found towards the end of the experiment, from the age of 35 days onwards.
Table 2 – Effects of dietary treatments and growth period on body weight (g/bird). Least square means ± standard deviation.
Age (days) Dietary treatments
CON 10 g/kg GP 20 g/kg GP 5 g/kg GS 10 g/kg GS GPEP 0 43.93 ± 4.49 43.22 ± 3.35 43.39 ± 3.12 44.42 ± 2.69 43.31 ±3.26 42.79 ± 2.98 7 183.54 ± 25.78 176.17 ± 22.58 186.94 ± 19.43 192.67 ±24.30 161.06 ±32.74** 176.43 ±16.79 14 498.87 ± 58.47 470.29 ± 62.18* 497.39 ± 50.43 495.39 ±67.57 446.31 ±75.28** 471.71 ±44.91 21 976.63 ± 107.73 971.00 ± 114.31 1004.97 ± 99.40 1022.06 ± 123.78 926.88 ±119.43* 951.14 ±34.90 28 1610.72 ±160.86 1575.76 ±156.39 1602.12 ±129.94 1713.27 ± 151.35** 1487.19 ±162.21*** 1507.29 ±107.98* 35 2235.43 ±228.28 2257.24 ±227.10 2277.82 ±183.92 2357.70 ± 213.97* 2202.66 ±226.35 2225.43 ±171.22 40 2690.84 ±281.33 2723.06 ±277.98 2764.61 ± 225.17 2853.21 ± 266.69** 2671.94 ±277.37 2572.29 ±193.48
CON = control group; GP = grape pomace; GS = grape seed; and GPEP = grape pomace polyphenolic extract administered in drinking water; Significant differences between control and experimental groups: * = p<0.05; ** = p< 0.01; *** = p< 0.001.
Table 3 – Effects of dietary treatments and growth period on weight gain (mean g/bird).
Period (days) Dietary treatments
CON 10 g/kg GP 20 g/kg GP 5 g/kg GS 10 g/kg GS GPEP
1-7 139.61 132.97 143.55 148.24 117.75 133.64
8-14 315.33 293.76 310.45 302.73 285.25 295.29
15-21 477.76 500.71 507.58 526.67 480.56 479.43
22-28 634.09 604.76 597.15 691.21 560.31 556.14
29-35 624.72 681.47 675.70 644.42 715.47 718.14
36-40 455.40 460.47 486.79 495.52 469.28 346.86
CON = control group; GP = grape pomace; GS = grape seed; and GPEP = grape pomace polyphenolic extract administered in drinking water
Chickens from 5 g/kg GS group, throughout the experimental period showed the best growth increases, which is consistent with body weights obtained. The period during which the largest increases in growth
were recorded was the 4th week of life of chicks,
recording an average weekly increase significantly higher by 9.01% (691.21 g/bird).
By contrast, 10 g/kg seeds in chicken diet resulted in a decrease in weight gain from the first two weeks, and particularly in the fourth week of the experiment; this period witnessed an average weekly weight gain of 11.64% (560.31 g/bird) lower compared to the control group (634.09 g/bird). Higher weight gain in 10 g/kg GS group was revealed towards the end of the experiment, especially at the age of 35 days, registering an increase of 14.53% (715.47 g/bird) average weekly gain compared to the control group (624.72 g/bird). Differences in gains recorded at 35 and 40 days between 10 g/kg GS and control groups are not related to those in the body weight, weight gain differences being a lot larger.
Along with 10 g/kg GS group, the GPEP group showed a reduction in weight gain from the first week of administration of aqueous polyphenols extract in drinking water (6.36%), dropping dramatically at the age of 28 days with 12.29% and at 40 days with 23.84% as opposed to the control group. In the GPEP group, the highest increases were seen at the chicken age of 35 days, registering an increase of 14.96% (718.14 g/bird) average weekly gain compared to the control group (624.72 g/bird). Differences in gains recorded at 35 days between GPEP and control groups are not consistent with those obtained in body weight, the differences in weight gains being higher.
From the data presented in Table 5, it can be observed that lower weekly feed intake in the experimental groups compared to those obtained in the control group. During the first three weeks, the average feed intake was lower in the experimental groups compared to the control group. These consumption differences may be correlated with the weight gains registered in the first two weeks, that were lower in the experimental groups compared to the control group.
At the age of 28 days higher feed consumption in the experimental groups was recorded: 5 g/kg GS with 5.97%, 10 g/kg GP group with 4.20% and 20 g/kg GP group with 0.68%. Lowest feed intake was seen in the GPEP group with 5.25% and 10 g/kg GS group with 3.85%.
Average feed intake recorded in the chickens from 5 g/kg GS group could be correlated with their weight gain achieved at this age. Differences in consumption recorded in the groups that received grape pomace in their diet could be justified by the fact that the chickens were better adapted to feed after the fourth week of life, but this could not be seen in their weight gain.
On the 35th day of the experiment a decrease in feed consumption may be noticed in the experimental groups compared to the CON group. Thus, the average consumption was reduced by 7.92% to GPEP, with 4.68% to 10 g/kg GP with 4.31% in 20 g/kgGP, with 2.94% in 10 g/kg GS and with 2.62% in 5 g/kg GS. Although the chickens from the experimental groups consumed less feed this week, they recorded higher growth gains than the CON group, especially in groups GPEP and 10 g/kg GS.
At the age of 40 days, the average feed intake has increased in the experimental groups with 21.89% in 20 g/kg GP group with 18.58% in GPEP, with 16.25% in 10 g/kg GS group, with 14.62% in 5 g/kg GS group and 10.30% in 10 g/kg GP group, compared to the control group.
At the end of the experimental period, the total average feed intake in the experimental groups was higher by 1.90% to 5 g/kg GS and 1.03% in 20 g/kg GP, and fell by 3.66% in group 10 g/kg GS with 3.26% in group GPEP and 1.46% in group 10 g/kg GP than CON group (Table 4).
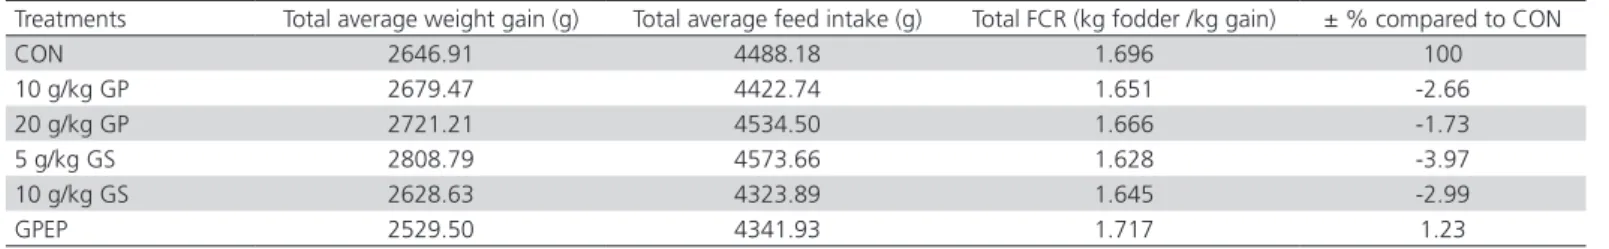
Regarding the feed conversion ratio (Table 4), at the age of 40 days, experimental groups achieved FCR decreased by 3.97% (1.628 kg fodder /kg gain) in 5 g/ kg GS group with 2.99% (1.645 kg fodder /kg gain) in 10 g/kg GS group, 2.66% (1.65 kg fodder /kg gain) in 10 g/kg GP group and 1.73% (1.666 kg fodder /kg gain) in 20 g/kg GP group. Instead, the GPEP group achieved a feed conversion higher with 1.23% (1.717 kg fodder /kg gain) compared to the control group who performed a FCR of 1.696 kg fodder /kg gain.
Although chickens in CON and GPEP groups achieved a feed conversion ratio higher than for those in 5 g/kg GS and 10 g/kg GP groups, it is not reflected in their recorded weight gains.
From those presented above, regarding the feed conversion ratio, it results that the broiler chickens which received a quantity of 5 g/kg seeds, 10 g/kg and 20 g/kg grape pomace respectively in their mixed fodder achieved a better feed conversion, the values obtained being further reduced compared to the
Table 4 – Total feed conversion ratio of the studied broilers
Treatments Total average weight gain (g) Total average feed intake (g) Total FCR (kg fodder /kg gain) ± % compared to CON
CON 2646.91 4488.18 1.696 100
10 g/kg GP 2679.47 4422.74 1.651 -2.66
20 g/kg GP 2721.21 4534.50 1.666 -1.73
5 g/kg GS 2808.79 4573.66 1.628 -3.97
10 g/kg GS 2628.63 4323.89 1.645 -2.99
GPEP 2529.50 4341.93 1.717 1.23
CON = control group; GP = grape pomace; GS = grape seed; and GPEP = grape pomace polyphenolic extract administered in drinking water
Table 5 – Effects of dietary treatments and growth period on weekly feed intake (mean g/bird).
Period (days) Dietary treatments
CON 10 g/kg GP 20 g/kg GP 5 g/kg GS 10 g/kg GS GPEP
1 - 7 247.62 219.32 238.35 223.00 195.40 227.81
8 - 14 426.23 355.48 359.01 365.34 343.96 353.41
15 - 21 795.79 761.94 785.03 821.31 705.41 737.42
22 - 28 961.33 1001.66 967.89 1018.74 924.35 910.86
29 - 35 1233.88 1176.17 1180.69 1201.54 1197.65 1136.10
36 - 40 823.33 908.17 1003.54 943.71 957.12 976.33
control group (1.73% and 2.66%). Though, 10 g/kg GS group which has achieved a lower feed conversion ratio (1645 kg fodder / kg gain), it is not found in their recorded weight gain.
During the experiment, there had been some losses, which scored in the normal range (4-5%) for the hybrid that we used. Most losses were recorded in the first and second week of life for the chicks in CON and 10 g/kg GS groups (2 losses each) and were accidental.
Regarding the Production Efficiency Factor (PEF), the best values were recorded by the chicks that received in the feed a proportion of 5 g/kg seeds respectively 10 g/kg and 20 g/kg grape pomace; the calculated values being shown in Table 6.
Table 6 – Production Efficiency Factor (PEF)
Treatments PEF
Absolute Relative
CON 375 100
10 g/kg GP 401 107.01
20 g/kg GP 403 107.63
5 g/kg GS 426 113.65
10 g/kg GS 384 102.35
GPEP 375 99.97
CON = control group; GP = grape pomace; GS = grape seed; and GPEP = grape pomace polyphenolic extract administered in drinking water
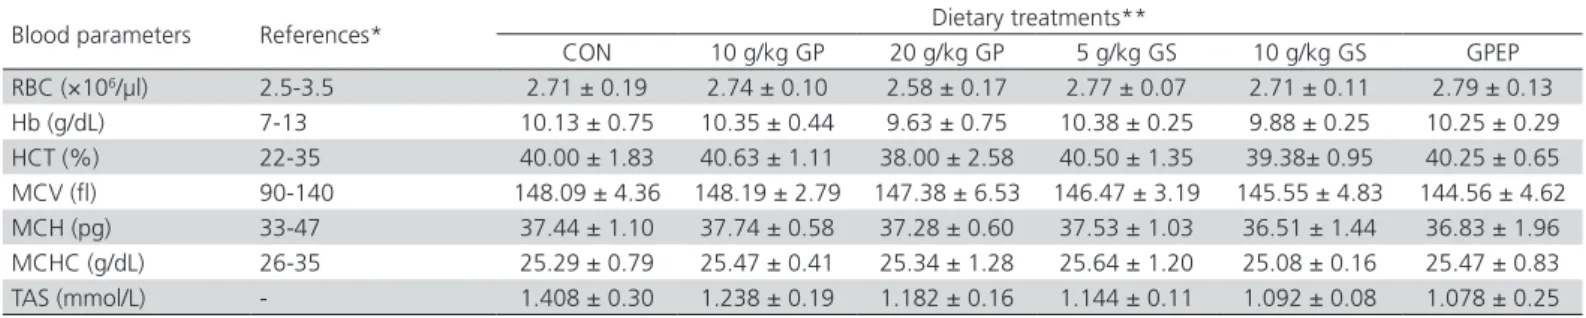
Table 7 presents blood indicators and total anti-oxidant status of serum in chickens. None of the blood erythrocyte parameters and TAS were influenced by the dietary treatments (p>0.05).
Table 7 – Effect of experimental diets on blood indicators and serum TAS in broiler chickens at the age of 40 days (means and SD)
Blood parameters References* Dietary treatments**
CON 10 g/kg GP 20 g/kg GP 5 g/kg GS 10 g/kg GS GPEP RBC (×106/μl) 2.5-3.5 2.71 ± 0.19 2.74 ± 0.10 2.58 ± 0.17 2.77 ± 0.07 2.71 ± 0.11 2.79 ± 0.13 Hb (g/dL) 7-13 10.13 ± 0.75 10.35 ± 0.44 9.63 ± 0.75 10.38 ± 0.25 9.88 ± 0.25 10.25 ± 0.29 HCT (%) 22-35 40.00 ± 1.83 40.63 ± 1.11 38.00 ± 2.58 40.50 ± 1.35 39.38± 0.95 40.25 ± 0.65 MCV (fl) 90-140 148.09 ± 4.36 148.19 ± 2.79 147.38 ± 6.53 146.47 ± 3.19 145.55 ± 4.83 144.56 ± 4.62 MCH (pg) 33-47 37.44 ± 1.10 37.74 ± 0.58 37.28 ± 0.60 37.53 ± 1.03 36.51 ± 1.44 36.83 ± 1.96 MCHC (g/dL) 26-35 25.29 ± 0.79 25.47 ± 0.41 25.34 ± 1.28 25.64 ± 1.20 25.08 ± 0.16 25.47 ± 0.83 TAS (mmol/L) - 1.408 ± 0.30 1.238 ± 0.19 1.182 ± 0.16 1.144 ± 0.11 1.092 ± 0.08 1.078 ± 0.25
RBC – Red Blood Cells; MCV – Mean Corpuscular Volume; MCH – Mean Cell Hemoglobin, MCHC - Mean Corpuscular Hemoglobin Concentration; TAS - Total Antioxidant Status CON - control; GP - grape pomace; GS – grape seed; GPEP - polyphenolic extract from grape pomace.
* Wakenell, 2010.
** Data are means of 6 chicks for each treatment. Anova: Two-Factor With Replication, Statistical significance: NS = p>0.05.
DISCUSSION
There are few references in the literature on the use of grape pomace and other wine by-products in broiler chickens feed. The protective effects of grape pomace and grape seed extracts on growing chickens were studied by a group of researchers from Spain and the results were published in a series of papers
from the same department (Goñiet al., 2007; Brenes
et al., 2008; Viveros et al., 2011). The use of smaller quantities of grape pomace of 5 g/kg and 15 g/kg did not improve growth performance of the chickens, the values obtained being very close to the group that did not receive feed grape pomace (Goñi et al., 2007; Brenes et al., 2008).
In studies by Goñi et al. (2007); Brenes et al.
(2008) and Viveros et al. (2011), the authors used
high quantities of grape pomace (30 g/kg and 60 g/ kg) and grape seed extracts rich in polyphenols in broiler chickens feed. Thus, in the study by Brenes et
al. (2008), the use of an amount of 60 g/kg pomace
in broilers feed, at the age of 21 and 42 days, resulted in a decrease in weight gain (68 g) and an increase of FCR (1.79 vs. 1.74). In contrast, the study by Viveros
et al. (2011), using the same proportions of 60 g/kg pomace in the mixed fodder at the age of 21 days of the chickens resulted in improved FCR of 5.29% (1.43 vs. 1.51 kg fodder /kg gain).
The chicks which received in the diet an amount of 30 g/kg grape pomace showed at the age of 21 days a weight gain by 2.59% (17 g) higher and a feed conversion ratio by 1,53% lower. Similar data
were obtained by Brenes et al. (2008) who used in
chickens diet 30 g/kg concentrated grape pomace. The results of these studies have shown also an increase of the antioxidant activity in diet, excreta and meat. Concentrated grape pomace can be a new source of antioxidants for animal nutrition and also a potential antioxidant as well as vitamin E.
Our results are comparable with those obtained by Goñi et al. (2007) at the age of 21 days, respectively
administrated smaller quantities of grape pomace (5, 15 and 30 g/kg) in the broiler chickens diets.
In general, the effect of polyphenolic compounds on the absorption and assimilation of different nutrients depends on many different factors including the type of compounds, its dosage, combination with other compounds, etc (Martel et al., 2010). Significant growth depression was observed with the use of grape seed extract that was reported by Hughes et al. (2005) and Lau & King (2003).
Lau & King (2003) showed a weight loss for the chickens fed with high concentrations (up to 10 g/kg) of grape seed extract containing 85.4 g GAE/100 g polyphenols and resulting in a feed concentration of
5 g GAE/kg. However, Hughes et al. (2005) reported
that levels up to 10 g/kg of GSE in feed did not affect chickens performance. The differences in polyphenol content of grape seed extracts may explain these contradictory results.
In another study of Chamorro et al. (2012), the
concentration of less than 5 g/kg of grape seed extract in the feed also caused a negative effect on the growth performances. The total polyphenol content of 5 g / kg GSE in feed led to a concentration of 1.5 g GAE / kg because grape seed extract had a content of only 29.6 g GAE / 100 g.
In our experiment, the concentration of 15 mL/L administered in the drinking water also caused a detrimental effect on the growth performances. Total polyphenol content in the extract administered in the drinking water was 1.82 g GAE/100 mL.
The effect of polyphenols has also been studied in broiler chickens using ingredients such as sorghum and faba beans. In general, relatively high concentrations of polyphenols obtained from dietary supplemental with these ingredients reduced the performance of chickens and other farm animals (Jansman et al., 1989; Nyachotti et al., 1997).
The presence of polyphenolic compounds in feed may have some adverse effects associated mainly with low efficiency of nutrients, especially protein and amino acid, digestive enzyme inhibition and increased excretion of endogenous proteins (Butler & Rogler 1992; Jansman et al., 1994). Polyphenols, particularly condensed tannins bind to proteins due to the interaction of their reactive hydroxyl groups with the carbonyl groups of protein. As a consequence of these formed combinations, the digestibility of protein and amino acid were reduced after the inclusion of polyphenol-rich sorghum and faba beans into chickens and pigs diets (Jansman et al., 1989; Ortiz et al.,
1993). Some phenolic compounds may also reduce
the absorption of iron and possibly other trace metals, when added in a diet. For example, grape seed extract inhibited the absorption of Zn (Kim et al., 2011) and
haeme iron in a dose-dependent manner (Ma et al.,
2010; Ma et al., 2011), the microbial fermentation of proteins and / or amino-acid metabolism were affected in humans (Jacobs et al., 2012).
According to the data provided by Wakenell (2010), the values of RBC, hemoglobin and MCH obtained in all the studied groups were within the normal range, while the hematocrit and MCV showed higher values, and MCHC lower values. The differences can be attributed to the broiler line used in the experiment and the method of determination (Haile & Chanie, 2014) or age and nutrition and chickens’ ages (Habibu et al.,
2013). Broilers of the species Gallus gallus domesticus
tend to have fewer and larger red blood cells generally (Wakenell, 2010), as in this study, including the control group.
Haematological indices of the red cells series correlate with the nutritional status of the chickens. The hematocrit is one of the indicators that shows stimulatory or inhibitory factors of the physiological process of hematopoiesis (Ogunwole, 2014).
The high hematocrit values in experimental groups as well as the control group, compared to the reference data (Wakenell, 2010) is an indicator of a diet rich in protein and of absence of the hematopoietic inhibitors. However, hemoglobin shows an insignificant decrease in the groups with higher doses of GP and GS compared to the control group, MCH having a slightly reduced value in the group with GPEP.
Although the changes are insignificant, we can discuss the concept of hormesis (biphasic response, dependent on the dose), according to which small doses have a stimulating effect and large doses inhibit (Calabrese, 2008).
Regarding the total antioxidant status measured on serum, it does not significantly change in the experimental groups, but a gradual reduction is noticed with increasing the administered dose, especially in dietary supplemental with polyphenols (1.078 mmol/L for GPEP). Our results are similar to those reported in chickens by Goñi et al. (2007) and Brenes et al. (2008). The dosage of TAS might be of immense importance in monitoring the antioxidative status of growing chickens.
ACKNOWLEDGMENTS
The authors thank The “Ion Ionescu de la Brad” University of Agricultural Sciences and Veterinary Medicine of Iasi, Romania for funding our research.
REFERENCES
Alonso A, Guillean D, Barroso C, Puertas B,Garcia A. Determination of antioxidant activity of wine by-products and its correlation with polyphenolic content. Journal of Agricultural and Food Chemistry 2002;50(21):5832–5836.
Arvanitoyannis IS, Ladas D, Mavromatis A. Potential uses and applications of treated wine waste:a review. International Journal of Food Science and Technology 2006;41(5):475-485.
Aslanian A, Asadi Dizaji A, Farhoomand P, Aghdam Shahryar H, Maheri Sis N, Rouhnavaz S. Characterization of the nutritive value and protein system in white and red grape (Vitis vinifera sp.) pomace. Research Journal of Biological Sciences 2011;6(7):298-303.
Baumgartel T, Kluth H, Epperlein K, Rodehutscord M. A note on digestibility and energy value for sheep of different grape pomace. Small Ruminant Research 2007;67(2-3):302-306.
Bișboacă SE. A process to obtain the polyphenols from grape pomace. Romanian State Office for Inventions and Trademarks. Patent RO 125704 B1. 2012. p.1-5.
Bonilla F, Mayen M, Merida J, Medina M. Extraction of phenolic compounds from red grape marc for use as food lipid antioxidants. Food Chemistry 1999;66:209–215.
Brenes A, Viveros A, Goñi I, Centeno C, Saura-Calixto F, Arija I. Effect of grape seed extract on growth performance, protein and polyphenol digestibilities, and antioxidant activity in chickens. Spanish Journal of Agricultural Research 2010;2:326–333.
Brenes A, Viveros A, Goñi I, Centeno C, Sayago-Ayerdi SG, Arija I, et al. Effect of grape pomace concentrate and vitamin E on digestibility of polyphenols and antioxidant activity in chickens. Poultry Science 2008;87(2):307–316.
Butler LG, RoglerJC. Biochemical mechanisms of the antinutritional effects of tannins. In: Ho CT, Lee CY, Huang MT, editors. Phenolic compounds in food and their effects on health. New Jersey: American Chemical Society;1992. v.506; p.289–304.
Calabrese EJ. Hormesis:why it is important to toxicology and toxicologists. Environmental Toxicology and Chemistry 2008;27(7):1451-1474.
Campbell TW. Avian hematology and cytology. 2nd ed. Iowa: Iowa State University Press; 1995. p.7-11.
Campbell TW. Avian hematology and cytology. Ames: Iowa State University Press; 1988.
Chamorro S, Viveros A, Centenol C, Romero C, Arija I, Brenes A. Effects of dietary grape seed extract on growth performance, amino acid digestibility and plasma lipids and mineral content in broiler chicks. The International Journal of Animal Biosciences 2013;7(4):555–561.
Chung KT, Wong TY, Wei CI, Huang YW, Lin Y. Tannins and human health: a review. Critical Reviews in Food Science and Nutrition 1998;38:421– 464.
Goñi I, Brenes A, Centeno C, Viveros A, Saura-Calixto F, Rebole A, et al. Effect of dietary grape pomace and vitamin E on growth performance, nutrient digestibility and susceptibility to meat lipid oxidation in chickens. Poultry Science 2007;86(3):508–516.
Habibu B, Yaqub LS, Ahmed IA, Kawu MU, Buhari HU, Tauheed M, et al. Erythrocyte osmotic fragility and haematologic parameters of three breeds of 9-week-old broiler chickens. International Journal Poultry Science 2013;12(5):277-279.
Hagerman AE, Butler LC. Determination of protein in tannin–protein precipitate. Journal of Agricultural Chemistry 1980;28:952–957.
Haile Y, Chanie M. Comparative aspects of the clinical hematology of birds:a review. British Journal Poultry Science 2014;3(3):88-95.
Hervert-Hernández D, Pintado C, Rotger R, Goñi I. Stimulatory effect of grape pomace polyphenols on Lactobacillus acidophilus growth. International Journal of Food Microbiology 2009;136:119–122.
Hughes RJ, Brooker JD, Smyl C. Growth rate of broiler chickens given condensed tannins extracted from grape seed. Proceedings of the 17th Australian Poultry Science Symposium, Sydney; 2005 Feb 7-9; New South Wales, Australia. Sydney; 2005. p.65-68.
ISO 2171:2010. Cereals, pulses and by-products. Determination of ash yield by incineration. Geneva: International Organization for Standardization; 2010. p.1-18.
ISO 5983-1:2005. Animal feeding stuffs. Determination of total nitrogen content and calculation of crude protein content. Part 1: Kjeldahl method. Geneva: International Organization for Standardization; 2005. p.1-10.
ISO 6492:2001. Animal feeding stuffs. Determination of fat content. Geneva: International Organization for Standardization; 2001. p.1-14
ISO 6496:2001. Animal feeding stuffs. Determination of moisture and other volatile matter content. Geneva: International Organization for Standardization; 2001. p.1-12.
ISO 6498:2012. Animal feeding stuffs. Guidelines for sample preparation. Geneva: International Organization for Standardization; 2012. p.1-54.
ISO 6865:2002. Animal feeding stuffs. Determination of crude fibre content Method with intermediate filtration. Geneva: International Organization for Standardization; 2002. p.1-16.
Jacobs DM, Fuhrmann JC, Van Dorsten FA, Rein D, Peters S, Van Velzen EJ, et al. Impact of short-term intake of red wine and grape polyphenol extract on the human metabolome. Journal of Agricultural and Food Chemistry 2012;60:3078–3085.
Jansman AJ, Huisman J, Van Der Poel AFB. Faba beans with different tannin contents:ileal and faecal digestibility in piglets and growth in chicks. In: HuismanJ, Van Der Poel AFB, Liener IE, editors. Recent advances in research of antinutritional factors in legume seeds. Wageningen: Academic Press; 1989. p.176-180.
Jansman AJM, Frohlich AA, Marquardt RR. Production of proline-rich proteins by the parotid glands of rats is enhanced by feeding diets containing tannins from faba beans (vicia faba L). Journal of Nutrition 1994;124:249–258.
Kim EY, Pai TK, Han O. Effect of bioactive dietary polyphenols on zinc transport across the intestinal Caco-2 cell monolayers. Journal of Agricultural and Food Chemistry 2011;59:3606–3612.
Lau DW, King AJ. Pre-and post-mortem use of grape seed extract in dark poultry meat to inhibit development of thiobarbituric acid reactive substances. Journal of Agricultural and Food Chemistry 2003;51:1602– 1607.
Ma Q, KimEY, Han O. Bioactive dietary polyphenols decrease heme iron absorption by decreasing basolateral iron release in human intestinal Caco-2 cells. Journal of Nutrition 2010;140:1117–1121.
Martel F, Monteiro R, Calhau C. Effect of polyphenols on the intestinal and placental transport of some bioactive compounds. Nutrition Research Reviews 2010;23:47–64.
Miller NJ, Rice-Evans C, Davies MJ, Gopinathan V, Milner A. A novel method for measuring anthioxidant capacity and its application to monitoring the antioxidant status in premature neonates. Clinical Science 1993;84(4):407-412.
Nyachotti CM, Atkinson JL, Leeson S. Sorghum tannins a review. World’s Poultry Science Journal 1997;53:5–21.
Ogunwole OA, Omojola AB, Sajo AP, Majekodunmi BC. Performance, hematology and serum biochemical indices of broiler chickens fed toasted sesame seed (Sesamum indicum, inn) meal based-diets. American Journal of Experimental Agriculture 2014;4(11):1458-1470.
Ortiz LT, Centeno C, Trevino J. Tannin in faba bean seeds:effects on the digestion of protein and amino acids in growing chicks. Animal Feed Science and Technology 1993;41:271–278.
Pierson FW. Laboratory techniques for avian hematology. In: Feldman BF, Zinkl JG, Jain NC, editors. Schalm’s veterinary hematology. 5th ed. Philadelphia: Lippincott W&Wilkins; 2000. p.1145 – 1146.
Pop IM, Pascariu MS, Simeanu D, Radu-Rusu C, Albu A. Determination of the chemical composition of the grape pomace of different varieties of grapes. University of Agricultural Sciences and Veterinary Medicine of Iasi 2014;63:76-80.
Saito M, Hosoyama H, Ariga T, Kataoka S, Yamaji N. Antiulcer activity of grape seed extract and procyanidins. Journal of Agricultural and Food Chemistry 1998;46:1460–1464.
Scalbert, A, Williamson G. Dietary intake and bioavailability of polyphenols. Journal of Nutrition 2000;130:2073–2085.
Singleton VL, Rossi JA. Colorimetry of total phenolics with phosphomolybdic – phosphotungstic acid reagents. American Society for Enology and Viticulture 1965;16:144-158.
Sui Y, Yang J, Ye Q, Li H, Wang H. Infrared, convective, and sequential infrared and convective drying of wine grape pomace. Drying Technology: An International Journal 2014;32:686-694.
Tarcău D, Vîntu V, Samuil C, Man-Cucu S. Polyphenolic composition of a permanent pasture under influence of organic fertilization. University of Agricultural Sciences and Veterinary Medicine of Iasi 2013;59:98-102.
Viveros A, Chamorro S, Pizarro M, Arija I, Centeno C, Brenes A. Effects of dietary polyphenol-rich grape products on intestinal microflora and gut morphology in broiler chicks. Poultry Science 2011;90:566–578.
Wakenell PS. Hematology of chickens and turkeys. In: Douglas JW, Wardrop JK, editors, Schalm’s veterinary hematology. 6th ed. Ames: Blackwell Publishing;2010. p.958–967.
Xia E-Q, Deng G-F, Guo Y-J, Li H-B. Biological activities of polyphenols from grapes. International Journal Molecular Sciences 2010;11:622-646.
![Table S1 – Ingredients and nutrient composition of the Starter Diet [0-10 d] (g/kg as fed)](https://thumb-eu.123doks.com/thumbv2/123dok_br/15894475.670044/3.892.54.840.607.1104/table-s-ingredients-nutrient-composition-starter-diet-fed.webp)
![Table S2 – Ingredients and nutrient composition of the Grower Diet [11- 26 d] (g/kg as fed)](https://thumb-eu.123doks.com/thumbv2/123dok_br/15894475.670044/4.892.53.840.172.635/table-s-ingredients-nutrient-composition-grower-diet-fed.webp)
![Table S3 – Ingredients and nutrient composition of the Finisher Diet [27- 40 d] (g/kg as fed)](https://thumb-eu.123doks.com/thumbv2/123dok_br/15894475.670044/5.892.53.839.172.635/table-s-ingredients-nutrient-composition-finisher-diet-fed.webp)