Food Science and Technology ISSN 0101-2061
DI:
D http://dx.doi.org/10.1590/1678-457X.06317
1 Introduction
Mycotoxins make up a diverse group of toxic substances produced by some types of fungi. The aflatoxin-producing species are Aspergillus flavus, Aspergillus parasiticus and others such as A. nominus, A. tamariie, A. pseudotamarii, A. bombycis,
A. ochraceoroseus and A. australis. Exposure of animals to mycotoxins, through the ingestion of contaminated food, may result in harm to their health as well as that of humans, who are consumers of the products obtained from this raw material (Benkerroum, 2016; Gacem & Hadj-Khelil, 2016; Dliveira et al., 2016; Wilson et al., 2002).
Among aflatoxins, B1 is the most toxic, followed by B2, G1 and G2 (Bbosa et al., 2013). The aflatoxins are absorbed in the gastrointestinal tract of the animal and are biotransformed, primarily in the liver, by microsomal enzymes related to the cytochrome P450 (Joint FAD/WHD Expert Committee on Food Additives, 2002) in multiple forms, among which epoxidation and hydroxylation stand out. Hydroxylation is a process that can be reversible or irreversible, forming derivatives such as aflatoxin M1, which can be excreted through body fluids such as milk (Dliveira & Germano, 2003). Aflatoxin B1 that has not been biotransformed can also be excreted (Scaglioni et al., 2014).
The maximum limit of aflatoxin M1 in milk and dairy products, as stipulated by international regulations, ranges from 0 to 1.0 μg kg-1. The European Union and the United
States of America, for example, set limits of 0.05 and 0.5 μg kg-1,
respectively; Nigeria, 1.0 μg kg-1 (Iqbal et al., 2015); and Brazil
has a maximum limit of 0.5 μg kg-1 for fluid milk (Brasil, 2011).
When it comes to the production of bovine milk, Brazil stands out in the international scenario. In 2015, it was the fifth largest producer in the world (35.00 billion liters), with the South Region being the largest Brazilian producer (12.32 billion liters). Among the Brazilian States, Santa Catarina is one of the major producers, with 8.7% of the volume of bovine milk produced in this country, with the Western mesoregion being responsible for 75.2% of the volume produced throughout the State in that year. These data show the importance of this region in the milk production chain at national and international levels (Instituto Brasileiro de Geografia e Estatística, 2016; United States Department of Agriculture, 2016).
Due to public health concerns and the consequent economic losses due to the presence of aflatoxins in foods, the objective of this study was to determine aflatoxin M1 in fresh bovine milk produced in small farms in the city of Concórdia, located in the State of Santa Catarina, Brazil.
2 Materials and methods
2.1 Sampling
Samples of fresh bovine milk were collected between November 2014 and January 2015 in 52 small rural farms, with an average production of 120 L day-1, from Concórdia, Western
region of Santa Catarina, in the South of Brazil.
Incidence of aflatoxin M
1in fresh milk from small farms
Luana GDNÇALVES1, Andréia DALLA RDSA1, Samantha Lemke GDNZALES1, Maria Manuela Camino FELTES2,
Eliana BADIALE-FURLDNG3, Giniani Carla DDRS4*
Received 22 Feb., 2017 Accepted 16 Oct., 2017
1 Departamento de Engenharia de Alimentos, Instituto Federal Catarinense – IFC, Campus Concórdia, Concórdia, SC, Brazil
2 Departamento de Ciência e Tecnologia de Alimentos, Centro de Ciências Agrárias, Universidade Federal de Santa Catarina – UFSC, Florianópolis, SC, Brazil 3 Escola de Química de Alimentos, Universidade Federal do Rio Grande – FURG, Campus Carreiros, Rio Grande, RS, Brazil
4 Departamento de Ciência e Tecnologia Agroindustrial, Faculdade de Agronomia Eliseu Maciel, Universidade Federal de Pelotas – UFPel, Campus Capão do Leão, Pelotas, RS, Brazil
*Corresponding author: dorsgi@yahoo.com.br Abstract
The objective of this work was to determine aflatoxin M1 in fresh milk from fifty-two small farms in the city of Concórdia - SC, Brazil. Samples from the cooling tanks of each property were collected from November 2014 to January 2015. The QuEChERS method was used for the extraction of aflatoxin M1, and quantification was performed in UHPLC-FL. 40.4% of the analyzed samples (eg, 21 samples) showed contamination levels by aflatoxin M1 above the maximum limit allowed by the Brazilian regulation, which is 0.5 μg L-1. These results suggest the importance of implementing Good Practices in obtaining feed for
dairy cows, since the contamination of milk by aflatoxin M1 occurs through the biotransformation of aflatoxin B1, after the ingestion of feed or silage contaminated by the animals, posing risk to the animals themselves, as well as to consumers of milk and dairy products.
Keywords: aflatoxins; QuEChERS; UHPLC-FL.
In each farm, a single direct collection was carried out in the morning, directly from the cooling tank, in duplicate, using Falcon tubes of 50 mL. These vials were placed in ice-cold isothermal boxes, sent to the laboratory and kept in a freezer at -12 °C until analyses.
2.2 Determination of aflatoxin M1 in samples of fresh bovine
milk
Samples preparation
Samples of bovine milk, in natura, were thawed and centrifuged at 2600 g for 3 min at room temperature to remove the supernatant fat layer.
Extraction of aflatoxin M1
The extraction of aflatoxin M1 was performed in triplicate using the QuEChERS method (Sartori et al., 2015). 15 g of the defatted and homogenized milk were weighed, to which 10 mL of hexane (C6H14; Synth, Brazil) and 15 mL of acetonitrile (C2H3N; J.T. Baker, Brazil) with 1% acetic acid (C2H4D2; Dinâmica, Brazil) were added. This solution was homogenized for 1 min, manually and slowly. Thereafter, 6 g of magnesium sulfate (MgSD4; Synth, Brazil) and 1.5 g of sodium chloride (NaCl; Vetec, Brazil) were added, and the solution was homogened manually and vigorously for 90 sec. Subsequently, the sample was centrifuged at 2600 g
for 7 min at room temperature. The hexane phase was discarded and the acetonitrile phase was collected in amber flasks for further concentration of this fraction in a water bath at 60 °C. The obtained extract was conditioned and kept under freezing for further quantification of aflatoxin M1.
Quantification of aflatoxin M1
For quantification of aflatoxin M1 in the samples, a Shimadzu high-performance liquid chromatograph with fluorescence detector (UHPLC-FL) (λ excitation = 360 nm and λ emission = 450 nm) was used, equipped with a Kromasil C18 5μ 250 x 4.6 mm chromatographic column with an injection handle of 20 μL and a flow of 1.0 mL min-1.
The method for quantification was validated by Scaglioni et al. (2014) and consisted in resuspending the dried extracts from the samples in 1 mL of the mobile phase (1% acetic acid: acetonitrile: methanol 40:35:25, by volume), shaking for 1 min in an ultrasonic bath. Later, the obtained solutions were transferred to a vial and centrifuged at 30186 g for 10 min at room temperature for later injection.
The concentration of aflatoxin M1 in the samples was calculated using the equation of the calibration curve y = 2,246,144x - 6,973.83, with coefficient of determination (R2) 0.9983 and correlation
coefficient of 0.9991 (Scaglioni et al., 2014). A sample of fresh milk, in triplicate, was fortified with 0.5 μg L-1 of aflatoxin M
1,
extracted by the QuEChERS method and quantified by the Scaglioni method (2014), to obtain the method recovery. A M1 standard (Sigma-Aldrich, St Louis, MD, USA) was also injected at a concentration of 0.1 μg L-1.
3 Results and discussion
The QuEChERS method was chosen to investigate aflatoxin M1 in fresh milk samples, since it is a fast and simple method for extraction and purification prior to the determination of mycotoxins in this sample. The milk matrix contains high levels of proteins and fats, which would make it necessary to perform several cleaning steps to reduce the interferents for subsequent quantification, which can be avoided using the QuEChERS protocol. In addition to the use of this protocol, previous freezing of the sample was adopted, in order to facilitate the separation and removal of fat from the fresh milk.
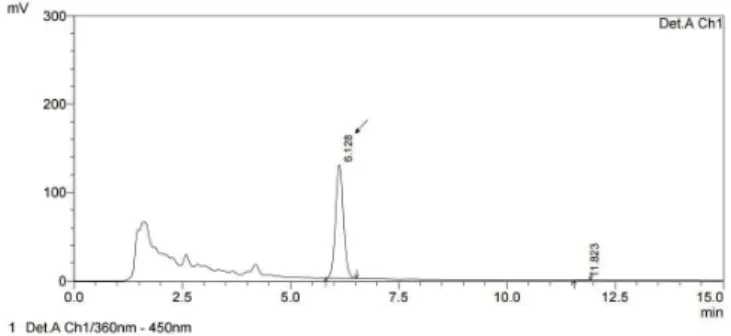
The chromatographic conditions previously established by Scaglioni et al. (2014) allowed adequate separation of aflatoxin M1 (Figure 1). Figure 2 shows the chromatogram of the fortified sample, whose mean recovery value was 60% (0.3 μg L-1).
This chromatogram, when compared to the chromatogram of fresh milk samples (chromatogram illustrative in Figure 3), presented more interference peaks.
The presence of aflatoxin M1 was detected in the 52 analyzed fresh milk samples, with values ranging from ≤ LDD (0.09 μg L-1) to
3.385 μg L-1 (Table 1). 40.4% of the analyzed samples (eg, 21 samples)
were above the limit allowed by the Brazilian regulation, which is 0.5 μg L-1 (Brasil, 2011), and 59.6% (31 samples) showed levels
higher than allowed by the European Union, which is 0.05 μg L-1
(Iqbal et al., 2015). It is important to notice that the recovery test performed with the fortified sample indicates that the values found may be even higher than those presented in Table 1.
Several recent studies found aflatoxin M1 contamination
in atura or raw milk. Shuib et al. (2017) quantified this aflatoxin in fresh milk by UHPLC-FL after immunoaffinity column cleaning,
Figure 1. Chromatogram of aflatoxin M1 standard (0.1 μg L-1).
and 4% of the analyzed 102 samples showed contamination levels below 0.5 g Kg-1, that is the maximum limit allowed by the
Malaysian regulation. Michlig et al. (2016) quantified aflatoxin M1 in 160 samples of milk collected in cooling tanks of the largest producing region of Argentina, using immunoaffinity columns for cleaning and UHPLC-MS/MS for quantification. 38.8% of total analyzed samples were contaminated with levels lower than 0.5 mg L-1 that is set by the Common Market of the South
(MERCDSUR) regulation. Hashemi (2016) analyzed 168 raw milk and 12 pasteurized milk samples in southern Iran using the ELISA method, and 55.6% showed a mean concentration of 21.31 ng L-1 aflatoxin M
1, all below the maximum limit established
by Iran regulation (100 ng L-1).
In Brazil, Pereira et al. (2005) verified that 52.8% of the 36 analyzed samples milk were contaminated with M1 in Minas Gerais (Brazil) and Dliveira et al. (2010) detected this aflatoxin in 36.7% of the 30 samples evaluated in São Paulo (SP, Brazil), but the values found in both studies were below that allowed by Brazilian regulation. Santili (2010) extracted and purified raw milk samples by immunoaffinity columns and quantified aflatoxin M1 by HPLC-FD, finding it in 49% of the 429 samples collected in São Paulo (SP, Brazil), with 0.7% being above the maximum limit allowed in Brazil. Picinin et al. (2013) collected 129 samples of bulk milk in the state of Minas Gerais, Brazil, and ELISA-tested and confirmed the presence of aflatoxin M1 by HPLC-FD in 18 samples (0.06 to 0.5 μg L-1).
It is known that aflatoxins are heat treatment stable (Assem et al., 2011; Prandini et al., 2009; Shundo et al., 2009). Studies carried out in Brazil (Scaglioni et al., 2014) and other countries (Farah Nadira et al., 2017; Armorini et al., 2016; Bellio et al., 2016; Zheng et al., 2013; Kabak & Özbey, 2012) prove that even in pasteurized or ultrapasteurized milk, aflatoxin M1 is found at levels often higher than the allowed maximum limit established by national regulations (Becker-Algeri et al., 2016).
Thus, the contamination level found in the fresh milk evaluated in this study is worrisome, since, of the 37.5% samples that showed contamination above the maximum limit allowed by Brazilian regulation (0.5 μg L-1), 9.5% showed levels at least
twice higher than this maximum value The contamination with mycotoxigenic species and the production of mycotoxins occurs under favorable environmental conditions (Gergiadou et al., 2012), which include specific climatic conditions, CD2 availability, temperature and water availability, as well as the interactions between them (Magan et al., 2011). Thus, ingestion of feeds and silages contaminated with aflatoxins will expose animals to these dangers (Mídio & Martins, 2000; Dliveira & Dlivera, 2010), which may impair their reproductive efficiency, reduce feed conversion efficiency, increase mortality rates, reduce weight gain, cause anemia and jaundice, as well as have an impact on food safety (Feddern et al., 2013).
According to Schneider et al. (2016), the feed supplied to dairy herds in the region of Concordia, SC (Brazil) is predominantly silage and feed produced on the farm itself. The feed uses corn as the main raw material and sometimes concentrate, wheat bran, soybean meal and rice bran are added during the management, production and storage of feed and silages. There is a relation between food contaminated with mycotoxins, and that fed to animals, and metabolization of aflatoxin B1 in its hydroxylated metabolite as aflatoxin M1 in milk (Kang’Ethe & Lang’A, 2009). Therefore, the high percentage of samples containing aflatoxin M1 in the analyzed milk samples suggests this path of contamination. However, other factors such as the climate, the stage of lactation of the animals, productivity and health of the mammary gland of the animal, among others, may have contributed to the high incidence of aflatoxin M1 in this product. However, contamination may also occur in temperate zones, when meteorological conditions combine with environmental factors and agricultural practices that favor the growth of toxigenic molds and AF production (Giovati et al., 2015).
4 Conclusion
40.4% of fresh milk samples showed contamination by aflatoxin M1 above the maximum limit allowed by Brazilian regulation (0.5 μg L-1). The contamination levels found in the
evaluated samples were high and these results represent a food safety problem in the investigated small farms. This scenario indicates the importance of the adoption of measures to mitigate this problem, such as the implementation of Good Practices throughout the milk production chain.
References
Armorini, S., Altafini, A., Zaghini, A., & Roncada, P. (2016). Dccurrence of aflatoxin M1 in conventional and organic milk offered for sale in Italy. Mycotoxin Research, 32(4), 237-246. PMid:27632224. http:// dx.doi.org/10.1007/s12550-016-0256-8.
Assem, E., Mohamad, A., & Dula, E. A. (2011). A survey on the occurrence of aflatoxin M1 in raw and processed milk samples marketed in Lebanon. Food Control, 22(12), 1856-1858. http:// dx.doi.org/10.1016/j.foodcont.2011.04.026.
Bbosa, D. K., Lubega, A., Dgwal-Dkeng, J., Anokbonggo, W. M., & Kyegombe, D. B. (2013). Aflatoxins: importance on animal nutrition. Figure 3. Chromatogram of fresh milk (0.73 μg L-1).
Table 1. Aflatoxin M1 content in fresh bovine milk.
AFM1 contamination level (µg L-1)
Number of samples (% of total analyzed samples)
≤ LDD (0.09) 24 (46.2%)
≤ LDQ (0.1 to 0.25) 4 (7.7%)
0.26 to 0.49 3 (5.6%)
≥ 0.50 19 (36.5%)
> 1.00 2 (3.8%)
In M. Razzaghi-Abyaneh (Ed.), Aflatoxins: recent advances and future
prospects (chap. 12, pp. 239-266). Rijeka: Intech.
Becker-Algeri, T. A., Castagnaro, D., Bortolli, K., Souza, C., Drunkler, D. A., & Badiale-Furlong, E. (2016). Mycotoxins in bovine milk and dairy products: a review. Journal of Food Science, 81(3), 44-52. PMid:26799355. http://dx.doi.org/10.1111/1750-3841.13204. Bellio, A., Bianchi, D. M., Gramaglia, M., Loria, A., Nucera, D., Gili,
M., & Decastelli, L. (2016). Aflatoxin M1 in cow’s milk: method validation for milk sampled in northern italy. Toxins, 8(3), 1-12. PMid:26927175. http://dx.doi.org/10.3390/toxins8030057. Benkerroum, N. (2016). Mycotoxins in dairy products: a review.
International Dairy Journal, 62, 63-75. http://dx.doi.org/10.1016/j.
idairyj.2016.07.002.
Brasil, Ministério da Saúde, Agência Nacional de Vigilância Sanitária. (2011, February 22). Regulamento para limites máximos tolerados para micotoxinas em alimentos (Resolução de Diretoria Colegiada nº 7, de 18 de fevereiro de 2011). Diário Oficial [da] República
Federativa do Brasil.
Farah Nadira, A., Rosita, J., Norhaizan, M. E., & Mohd Redzwan, S. (2017). Screening of aflatoxin M1 occurrence in selected milk and dairy products in Terengganu, Malaysia. Food Control, 73, 209-214. http://dx.doi.org/10.1016/j.foodcont.2016.08.004.
Feddern, V., Dors, G. C., Tavarini, F. C., Mazzuco, H., Cunha Júnior, A., Krabbe, E. L., & Scheuermann, G. N. (2013). Aflatoxins: importance on animal nutrition. In M. Razzaghi-Abyaneh (Ed.), Aflatoxins:
recent advances and future prospects (chap. 8, pp. 171-195). Rijeka:
Intech. http://dx.doi.org/10.5772/51952.
Gacem, M. A., & Hadj-Khelil, A. D. E. (2016). Toxicology, biosynthesis, bio-control of aflatoxin and new methods of detection. Asian
Pacific Journal of Tropical Biomedicine, 6(9), 808-814. http://dx.doi.
org/10.1016/j.apjtb.2016.07.012.
Gergiadou, M., Dimou, A., & Yanniotis, S. (2012). Aflatoxin contamination in pistachio nuts: a farm to storage study. Food Control, 26(2), 580-586. http://dx.doi.org/10.1016/j.foodcont.2012.02.014.
Giovati, L., Magliani, W., Ciociola, T., Santinoli, C., Conti, S., & Polonelli, L. (2015). AFM1 in milk: physical, biological, and prophylactic methods to mitigate contamination. Toxins, 7(10), 4330-4349. PMid:26512694. http://dx.doi.org/10.3390/toxins7104330. Hashemi, M. (2016). A survey of aflatoxin M1 in cow milk in Southern
Iran. Journal of Food and Drug Analysis, 24(4), 888-893. PMid:28911629. http://dx.doi.org/10.1016/j.jfda.2016.05.002.
Iqbal, S. Z., Jinap, S., Pirouz, A. A., & Ahmad Faizal, A. R. (2015). Aflatoxin M1 in milk and dairy products, occurrence and recent challenges: a review. Trends in Food Science & Technology, 46(1), 110-119. http://dx.doi.org/10.1016/j.tifs.2015.08.005.
Instituto Brasileiro de Geografia e Estatística – IBGE. (2016). Produção
de origem animal, por tipo de produto. Brasília: IBGE. Retrieved
from https://sidra.ibge.gov.br/tabela/74#resultado
Joint FAD/WHD Expert Committee on Food Additives – JECFA. (2002). Evaluation of certain mycotoxins in food. Geneva: WHD. 62 p Kabak, B., & Özbey, F. (2012). Aflatoxin M 1 in UHT milk consumed
in Turkey and first assessment of its bioaccessibility using an in vitro digestion model. Food Control, 28(2), 338-344. http://dx.doi. org/10.1016/j.foodcont.2012.05.029.
Kang’Ethe, E. K., & Lang’A, K. A. (2009). Aflatoxin B1 and M1 contamination of animal feeds and milk from urban centers in Kenya. African Health Sciences, 9(4), 218-226. PMid:21503172. Magan, N., Medina, A., & Aldred, D. (2011). Climate-change effects
on mycotoxin contamination of food crops pre- and postharvest.
Plant Pathology, 60(1), 150-163.
http://dx.doi.org/10.1111/j.1365-3059.2010.02412.x.
Michlig, N., Signorini, M., Gaggiotti, M., Chiericatti, C., Basílico, J. C., Repetti, M. R., & Beldomenico, H. R. (2016). Risk factors associated with the presence of aflatoxin M1 in raw bulk milk from Argentina. Food Control, 64, 151-156. http://dx.doi.org/10.1016/j. foodcont.2015.12.025.
Mídio, A. F., & Martins, D. I. (2000). Toxicologia de alimentos. São Paulo: Varela.
Dliveira, C. A. F., & Germano, P. M. L. (2003). Aflatoxina M1 em leite e derivados. In M. L. Germano & M. J. S. Germano (Eds.), Higiene
e vigilância sanitária de alimentos (2nd ed., chap. 6, pp. 103-109).
São Paulo: Varela.
Dliveira, C. A. F., Sebastião, L. S., Fagundes, H., Rosim, R. E., & Fernandes, A. M. (2010). Determinação de aflatoxina B1 em rações e aflatoxina M1 no leite de propriedades do Estado de São Paulo. Ciência e
Tecnologia de Alimentos, 30, 221-225. http://dx.doi.org/10.1590/
S0101-20612010000500034.
Dliveira, F. A., & Dlivera, F. C. (2010). Toxicologia experimental de
alimentos (1st ed.). Porto Alegre: Metodista IPA.
Dliveira, M. S., Rocha, A., Sulyok, M., Krska, R., & Mallmann, C. A. (2016). Natural mycotoxin contamination of maize (Zea mays L.) in the South region of Brazil. Food Control, 73, 127-132. http://dx.doi. org/10.1016/j.foodcont.2016.07.033.
Pereira, M. M. G., Carvalho, E. P., Prado, G., Rosa, C. A. R., Veloso, T., Souza, L. A. F., & Ribeiro, J. M. M. (2005). Aflatoxinas em alimentos destinados a bovinos e em amostras de leite da região de Lavras, Minas Gerais – Brasil. Ciência e Agrotecnologia, 29(1), 106-112. http://dx.doi.org/10.1590/S1413-70542005000100013.
Picinin, L. C. A., Cerqueira, M. M. D. P., Vargas, E. A., Lana, A. M. Q., Toaldo, I. M., & Bordignon-Luiz, M. T. (2013). Influence of climate conditions on a aflatoxin M1 contamination in raw milk from Minas Gerais State, Brasil. Food Control, 31(2), 419-424. http://dx.doi. org/10.1016/j.foodcont.2012.10.024.
Prandini, A., Tansini, G., Sigolo, S., Filippi, L., Laporta, M., & Piva, G. (2009). Dn the occurrence of aflatoxin M1 in milk and dairy products.
Food and Chemical Toxicology, 47(5), 984-991. PMid:18037552.
http://dx.doi.org/10.1016/j.fct.2007.10.005.
Santili, A. B. N. (2010). Ocorrência de aflatoxina M1 em leite cru de três mesorregiões produtoras do Estado de São Paulo e sua correlação com
parâmetros de qualidade do leite (Master’s thesis). Universidade de
São Paulo, Piracicaba.
Sartori, A. V., Mattos, J. S., Moraes, M. H. P., & Nóbrega, A. W. (2015). Determination of aflatoxins M1, M2, B1, B2, G1 and G2 and Dchratoxin A in UHT and powdered milk by modified QuEChERS method and ultra-high-performance liquid chromatography tandem mass spectrometry. Food Analytical Methods, 8(9), 2321-2330. http:// dx.doi.org/10.1007/s12161-015-0128-4.
Scaglioni, P. T., Becker-Algeri, T., Drunkler, D., & Badiale-Furlong, E. (2014). Aflatoxin B1 and M1 in milk. Analytica Chimica Acta, 829, 68-74. PMid:24856405. http://dx.doi.org/10.1016/j.aca.2014.04.036. Schneider, A. C. R., Dalla Rosa, A., Soligo, A., Gonçalves, L., Gonzales, S. L., Feltes, M. M. C., & Dors, G. C. (2016). Levantamento de aflatoxina B1 em rações e silagens utilizadas na nutrição de vacas leiteiras. In: Anais do II Congresso Internacional de Gestão, Tecnologia e Inovação da URI Erechim; III Congresso Sul-Brasileiro de Engenharia
de Alimentos. Erechim: CDNIGTI.
in Penang, Malaysia. Food Control, 73, 966-970. http://dx.doi. org/10.1016/j.foodcont.2016.10.013.
Shundo, L., Navas, S. A., Lamardo, L. C. A., Ruvieri, V., & Sabino, M. (2009). Estimate of aflatoxin M1 exposure in milk and occurrence in Brazil. Food Control, 20(7), 655-657. http://dx.doi.org/10.1016/j. foodcont.2008.09.019.
United States Department of Agriculture – USDA. (2016). Dairy: world
markets and trade. Washington: USDA. Retrieved from https://apps.
fas.usda.gov/psdonline/circulars/dairy.pdf
Wilson, D. M., Mubatanhema, W., & Jurjevic, Z. (2002). Biology and ecology of mycotoxigenic aspergillus species as related to economic and health concerns. Mycotoxins and Food Safety, 504, 3-17. PMid:11922097. http://dx.doi.org/10.1007/978-1-4615-0629-4_2. Zheng, N., Sun, P., Wang, J. Q., Zhen, Y. P., Han, R. W., & Xu, X. M.