INTRODUCTION
Ochratoxin A, N-[(3R)-(5-chloro-8-hydroxy-3- methyl-1-oxo-7-isochromanyl)carbonyl]-L-phe-nylalanine, is a mycotoxin produced by certain species of Aspergillus and Penicillium fungi. The natural occurrence of this toxin in grains and other plant products has been widely reported (Kuiper-Goodman and Scott, 1989; Størmer, 1992; Harwig et al., 1995). Experimental diets containing ochratoxin A have a deleterious effect on a number of animal species. Biological and biochemical effects associ-ated with ochratoxin A include nephropathy, tera-togenicity, enhancement of lipid peroxidation, par-tial inhibition of ATP-dependent calcium uptake, carcinogenicity, and inhibition of the cell-mediated immune response (Kuiper-Goodman and Scott, 1989; Størmer, 1992). Human exposure to ochra-toxin A can occur directly by consumption of taminated plant-derived food or indirectly by con-sumption of animal tissues from livestock exposed to contaminated materials (Petkova-Bocharova et al., 1988). It has also been linked with nephropathy in Bulgaria and former Yugoslavia (Hult et al., 1992).
The Joint FAO/WHO Expert Committee on Food Additives (JEFCA) has established a provisional tolerable weekly intake of 100 ng/kg body weight (Benford et al., 2001). Regulatory limits for OTA have also been settled by the European Union, with maximum allowable concentrations ranging from 2 to 10 ppb in some commodities, i.e., cereals and derived products, grapes, dried grapes, grape juice, must, wine, and coffee (Anonymous, 2005).
Many analytical methods have been developed for the determination of ochratoxin A, mainly involving the use of thin-layer chromatography (TLC) or high-performance liquid chromatogra-phy – HPLC (Trucksess, 1995). Some papers have reported using solid-phase extraction for analysis of ochratoxin A in maize (Pelegri et al., 1997), beer (Medina et al., 2006), and wine (Berente et al., 2005). The IAC clean-up procedure is widely used, allow-ing a lower limit of detection (compared to clean-up with C18) and accurate and reproducible results (Gilbert and Anklam, 2002; Blesa et al., 2004). In this paper, the performances of two different clean-up procedures, viz., use of immunoaffinity and COMPARISON OF TWO SAMPLE PREPARATION PROCEDURES FOR
HPLC DETERMINATION OF OCHRATOXIN A
GORICA L. VUKOVIĆ1, SNEŽANA Đ. PAVLOVIĆ2, and M. S. RISTIĆ2
1Institute of Public Health, 11000 Belgrade, Serbia
2Dr. Josif Pančić Institute for Medicinal Plant Research, 11000 Belgrade, Serbia
Abstract — In preparation of samples for chromatographic determination of ochratoxin A, two types of columns were used for sample cleanup (SPE and immunoaffinity columns). The first method consisted of liquid-liquid extraction with a mixture of chloroform and phosphoric acid, followed by ion-exchange cleanup on Waters Oasis MAX columns. The sec-ond method consisted of extraction with a mixture of water and methanol, followed by LCTech OtaCLEAN immunoaf-finity column cleanup. Recoveries of the methods were determined at three levels in three repetitions for maize flour, and they were 84% (%RSD = 19.2) for the first method of sample preparation and 101% (%RSD = 2.2) for the second method. Values of LOQ for OTA were 0.25 and 1.00 μg/kg for the IAC and SPE clean-up procedures, respectively. Both methods comply with present regulations, but the MAX sample clean-up procedure should be used as an alternative, since the immunoaffinity column clean-up procedure is characterized by better reproducibility, accuracy, and efficiency.
Key words:Ochratoxin A, RP-HPLC, immunoaffinity column
UDC 5582.28:543.544.5:616:59
SPE columns, were compared for determination of ochratoxin A in maize flour.
MATERIAL AND METHODS
The ochratoxin A standard, 50 µg/mL (in ben-zene/acetic acid, 99:1), was purchased from Sigma (Sigma-Aldrich, Bellefonte, USA). A stock solution of about 1 µg/L was prepared by evaporation of a standard base solution and dissolution in 50 ml of a filtered LC mobile phase. Working standard solu-tions were prepared by appropriate dilution of this solution with the LC mobile phase. Acetonitrile and methanol (both LC-grade), hexane, formic acid (p.a.), and acetic acid (suprapure) were from Merck (Darmstadt, Germany). Phosphoric acid (85%, ana-lytical grade) was from LACHEMA (Neratovice, Czech Republic). Pure water was obtained from the Purelab® ELGA water purification system (Vivendi
Water Systems Ltd., UK). Glass-microfiber filters (GF/A) were from Whatman (Maidstone, UK). Econofilters of regenerated cellulose (0.45 µm) were from Agilent (Germany). OtaCLEAN immunoaf-finity columns were from LCTech GmbH (Dorfen, Germany), and Oasis MAX extraction cartridges were purchased from Waters (Waters, Ireland).
Samples of maize flour were obtained from domestic markets.
Apparatus
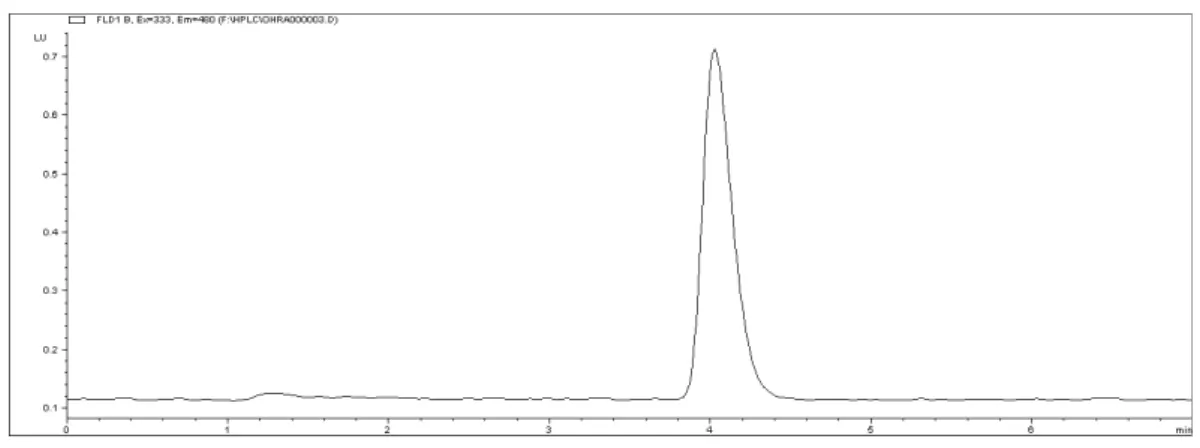
For HPLC analysis, an Agilent 1100 liquid chromato-graph, equipped with a fluorescence detector (FLD), was used. Data were analyzed with ChemStation A.10.02(1757) Agilent Technologies 2003 software. Separation was performed on a Waters Symmetry C-18 column (150 mm · 4.6 mm · 5 μm) at 40°C. A mixture of acetonitrile and 2% acetic acid (60:40, v/v) at a 1-mL/min flow-rate was used as the mobile phase. Quantification of OTA was performed by measuring its peak area with the aid of a calibration curve calculated from standard solutions. Excitation and emission wavelengths were 333 and 480 nm, respectively.
Clean-up with an SPE column
Two hundred milliliters of chloroform and 25 ml of phosphoric acid 0.1 M were added to an Erlenmeyer
flask containing 20 g of a maize sample. The mix-ture was magnetically stirred for 30 min and then transferred into a 500-ml separatory funnel. Fifty milliliters of the lower layer were transferred to a round-bottom flask and evaporated to dryness on a rotary evaporator. The residue was dissolved in 5 ml of hexane and 5 ml of methanol/water mixture (1:1, v/v). The solution was transferred to a 50-ml separa-tory funnel and shaken gently. The lower phase was collected in a 25-ml Erlenmeyer flask and the upper phase extracted twice more with 5 m- of the metha-nol/water mixture (1:1, v/v) used to rinse the round-bottom flask containing the residue. All the lower phases were combined and added at a flow rate of 1 ml/min to a MAX column previously conditioned with 5 ml of methanol and 5 ml of methanol/water mixture (1:1, v/v). The column was then washed with 8 ml of methanol/water mixture (3:1, v/v) and 3 ml of methanol at a flow rate of 2 ml/min. These washes were discarded and ochratoxin A was eluted with 2 x 5 ml of methanol/formic acid mixture (98:2, v/v) at a flow rate of 2 ml/min. Both solutions were combined and evaporated to dryness under nitrogen and the residue dissolved in 500 μl of the mobile phase and injected into the HPLC system.
Clean-up with an immunoaffinity column
Ten grams of a maize sample was extracted with 40 ml of methanol/water mixture (80:20, v/v) in a blender jar at high speed for one minute. The extract was filtered through a glass-microfiber filter, and an aliquot of 4 ml was added to 46 ml of PBS buffer (pH 7.2). The diluted extract was passed through an OtaCLEAN column. A gentle vacuum or overpres-sure can be used in all steps involving passage of liquid through the column. The column was washed with 10 ml of distilled water and carefully dried. Ochratoxin A was eluted at least two times with 1 ml of methanol. The combined solutions were then evaporated to dryness under a gentle stream of nitrogen. The residue was resolved in 500 µl of the mobile phase and injected into the HPLC system.
RESULTS AND DISCUSSION
resolution was satisfactory, while the retention time of OTA was 4.0 min.
Linearity studies
Linearity testing was performed over a concentra-tion range of from 2.5 to 100 ng of OTA/ml. For preparation of standard solutions containing 2.5, 4.0, 5.0, 10.0, 20.0, 50.0, and 100 ng of OTA/ml, a mobile phase consisting of a mixture of acetonitrile and 2% acetic acid (60:40, v/v) was used as a solvent. Each standard solution was chromatographed in two rep-etitions. The resulting calibration curve, obtained by processing of all calibration data, showed good linearity over the range of tested concentrations (y = 0.72728x-0.10871). The correlation coefficient was 0.9984 and RSD was 0.48288, which fulfills the linearity requirement of the method.
Recovery studies
Recovery studies were carried out by spiking maize (10 or 20 g), depending on the extraction procedure, with known volumes of the appropriate working standard solutions. Table 1 presents the results of spiking maize with OTA. The IAC clean-up method showed the best recoveries. Average recoveries were 100.6 to 101.7%, and RSD (%) ranged from 0.99 to 3.93.
Limit of detection (LOD) and quantification (LOQ) From the regression line obtained, the limit of detec-tion (LOD) was estimated as the OTA concentra-tion giving a signal equal to b+3Sb, where b is the
intercept and Sb is the standard error of the estimate (assumed to be noise). The LOD value for OTA was 0.5 ng/ml, and LOQs were 0.25 and 1.00 μg/kg for the IAC and SPE clean-up procedures, respectively.
Comparison of IAC and SPE sample preparation procedures
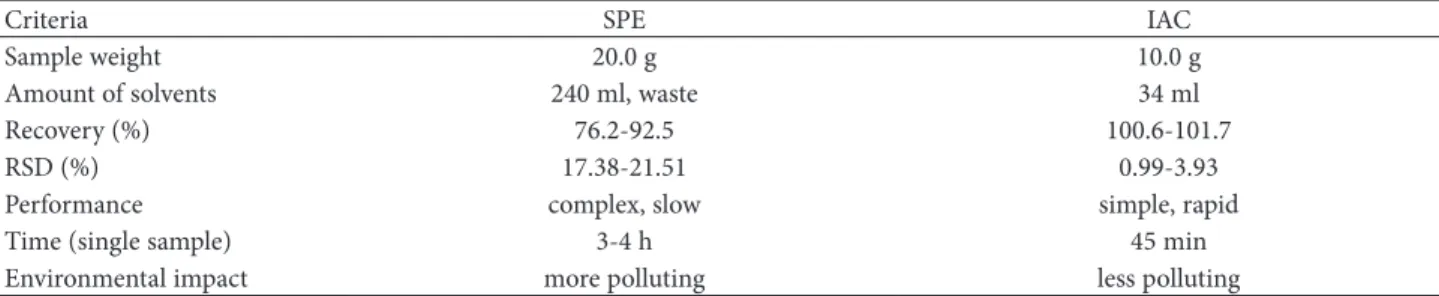
Samples were analyzed using both clean-up proce-dures (with IAC and SPE, alternatively). The corre-sponding basic characteristics and analytical param-eters of these procedures are listed in Table 1. The IAC procedure gave better recoveries and RSD % in comparison with SPE. Figures 2 and 3show HPLC chromatograms of samples prepared by IAC. Table 2 shows that the IAC procedure has many advantages over the SPE procedure: smaller amounts of the sample and organic solvent are needed; the method gives higher recovery; it is more reliable, easier, and faster (extraction and purification require only one step); and it is also more environment-friendly. The number of peaks appearing in Fig. 3 is smaller than the number of peaks in Fig. 2, without doubt due to the high specificity of IAC clean-up. All these data (Table 1, Figs. 2 and 3) clearly indicate that the two procedures provide acceptable results in terms of recovery, as stated above, but LOQ is lower for the IAC method, which may be due to better purifica-tion of the sample and high specificity of the IAC columns. Furthermore, samples with high fat con-tent showed poor recoveries when the MAX SPE clean-up procedure was used.PE and IAC clean-up procedures (recovery and RSD testing).
Table 1. Comparison of SPE and IAC clean-up procedures (recovery and RSD testing).
Ochratoxin A conc (ng/ml)
SPE IAC
Recovery RSD (%) Recovery RSD (%)
(%) (n = 3) (%) (n = 3)
10 76.2 21.51 101.7 0.99
25 84.3 18.71 100.6 3.93
50 92.5 17.38 101.0 1.29
Fig. 2. Chromatogram of maize spiked to contain inal concentration of 25 ng OTA/ml obtained by SPE clean-up procedure.
Fig. 3. Chromatogram of maize spiked to contain inal concentration of 25 ng OTA/ml obtained by IAC clean-up procedure.
Table 1. Multiple comparison of SPE and IAC clean-up procedures (general characteristics).
Criteria SPE IAC
Sample weight 20.0 g 10.0 g
Amount of solvents 240 ml, waste 34 ml
Recovery (%) 76.2-92.5 100.6-101.7
RSD (%) 17.38-21.51 0.99-3.93
Performance complex, slow simple, rapid
Time (single sample) 3-4 h 45 min
Both the SPE procedure and the IAC procedure were successfully used to extract OTA from maize flour. Pretreated samples were cleaned up by a MAX SPE cartridge and IAC OtaCLEAN columns, and analyzed by HPLC using an FL detector. The recovery rates and relative standard deviation were 76.2-92.5% (17.38-21.51 %RSD) for SPE and 100.6-101.7% (0.99-1.29 %RSD) for IAC, respectively. The limits of quantification were 1.0 μg/kg for the SPE method and 0.25 μg/kg for the IAC method. The SPE clean-up procedure could only be used on non-fatty samples because MAX cartridges and this SPE clean-up procedure showed very poor recoveries for fatty samples. The preferred IAC method is faster, easier, more reliable, and more inexpensive (in the long term). It is suitable for use by governmental agencies, laboratories, and manufacturers in moni-toring the quality of commercial maize, maize flour, and related cereal products.
Acknowledgments — This work was supported by the Ministry of Science of the Republic of Serbia through Project TR-20051.
REFERENCES
Anonymous (2005). Commission Regulation (EC) 123/2005 of 26 January 2005 Amending Regulation (EC) 466/2001 as regards ochratoxin A. Off. J. Eur. Commun. L25/3 (Jan 28).
Benford, D., Boyle, C., Dekant, W., Fuchs, R., Gaylor, D. W., Hard, G., McGregor, D. B., Pitt, J. I., Plestina, R., Shephard, G., Solfrizzo, M., Verger, P. J. P., and R. Walker (2001). Ochratoxin A, In: Safety Evaluation of Certain Mycotoxins in Food. WHO Food Additives Series47 (Ed. E. Heseltine), 281-415.
Berente, B., Móricz, A., Otta, C., Záray, G., Lékó, L., and L. Rácz (2005). Determination of ochratoxin A in Hungarian
wines. Microchem. J.79(1-2), 103-107.
Blesa, J., Berrada, H., Soriano, J. M., Moltó, J. C., and J. Mañes (2004). Rapid determination of ochratoxin A in cere-als and cereal products by liquid chromatography. J. Chromatogr. A1046, 127-131.
Gilbert, J., and E. Anklam (2002). Validation of analytical meth-ods for determining mycotoxins in fometh-odstuffs. TrAC-Trend. Anal. Chem. 21, 468-471.
Harwig, J., Kuiper-Goodman, T., and P. M. Scott (1995). Microbial food toxicants: ochratoxins, In: Handbook of Food-Borne Diseases of Biological Origin (Ed. I. M. Rechcig), 193-238. CRC Press, Boca Raton, FL, USA.
Hult, K., Hokby, E., Sellyey,G., Rutqvist, L., and S. Gatenbeck (1992). Ochratoxin A occurrence in slaughter-pigs in Sweden and its use as a tool for feed screening programs. J. Environ. Pathol. Toxicol. Oncol. 11, 103-104.
Kuiper-Goodman, T., and P. M. Scott (1989). Risk assessment of the mycotoxin ochratoxin A. Biomed. Environ. Sci.2,
79-248.
Medina, A., Valle-Algarra, F. M., Gimeno-Adelantado, J. V., Mateo, R., Mateo, F., and M. Jiménez (2006). New method for determination of ochratoxin A in beer using zinc acetate and solid-phase extraction silica cartridges. J. Chromatogr. A1121(2), 178-183.
Pelegri,J. M., Velázquez, C., Sanchís, V., and R. Canela (1997). Solid phase extraction on sax columns as an alternative for ochratoxin A analysis in maize. Rev. Iberoam. Micol.
14, 194-196.
Petkova-Bocharova, T., Chernozemsky, I. N., and M. Castegnaro (1988). Ochratoxin A in human blood in relation to Balkan endemic nephropathy and urinary system tumors in Bulgaria. Food Addit. Contam.5, 299-301.
Størmer, F. C. (1992). Ochratoxin A – a mycotoxin of cancer, In: Handbook of Applied Mycology. Mycotoxins in Ecological Systems (Eds. D. Bhatnagar, E. B. Lillehoj, and D. K. Arora), 403-432. Marcel Dekker Inc., New York.
ПОРЕЂЕЊЕ ДВЕ МЕТОДЕ ЗА ПРИПРЕМУ УЗОРАКА ЗА HPLC ОДРЕЂИВАЊЕ ОХРАТОКСИНА А
ГОРИЦА Љ. ВУКОВИЋ1, СНЕЖАНА Ђ. ПАВЛОВИЋ2 и М. С. РИСТИЋ2
1Институт за јавно здравље, 11000 Београд, Србија
2Институт за проучавање лековитог биља „Др Јосиф Панчић“, 11000 Београд, Србија
У процесу припреме узорака за хроматограф-ско одређивање охратоксина А (ОТА), коришће-на су два типа колокоришће-на за пречишћавање узорака (SPE и имуноафинитетне колоне). Прва метода се састојала од течно-течне екстракције смешом хлороформа и фосфорне киселине, праћене пре-чишћавањем на јоноизмењивачкој Waters Oasis MAX колони. Друга метода састојала се од екс-тракције смешом вода-метанол, праћене пречи-шћавањем на LCTech OtaCLEAN имуноафини-тетној колони. Ефикасност оба поступка одређи-вана је на три нивоа концентрација, у три