Research Paper
Pattern recognition of lipase-catalyzed or chemically
interesterified fat blends containing n-3 polyunsaturated fatty acids
Ana Sofia Pires1, Natália M. Osório2, 3, Ana Cláudia Nascimento3, Frederik van Keulen1,M. Manuela R. da Fonseca1, Suzana Ferreira-Dias3
1Instituto Superior Técnico, CEBQ-IBB – Institute for Biotechnology and Bioengineering, Technical University of Lisbon, Lisbon, Portugal
2Instituto Piaget, Núcleo de Investigac¸ão em EngaAlimentar e Biotecnologia, ISEIT de Almada, Almada, Portugal
3Instituto Superior de Agronomia, DAIAT, Centro de Estudos de Engenharia Rural, Technical University of Lisbon, Lisbon, Portugal
The feasibility to discriminate among samples of different fat blends prior and after inorganic or lipase-catalyzed interesterification, via pattern recognition techniques [principal component analysis (PCA) and discriminant analysis (DA)], was investigated. Blends I and II, consisting of mixtures of palm stearin, palm kernel oil and a concentrate of triacylglycerols (TAG) rich in n-3 polyunsaturated fatty acids (EPAX 4510TG or EPAX 2050TG) were used. These blends, prior (64 samples) and after interesterification, catalyzed by an immobilized Thermomyces lanuginosa lipase (Lipozyme TL IM, 54 samples) or by sodium methoxide (10 samples), were characterized by their acylglycerol profiles (25 chromatographic peaks) and solid fat content (SFC) at 10, 20, 30 and 35 7C. PCA on the multivariate data (i) showed that the initial samples were characterized by higher SFC and higher contents of high-melting TAG and (ii) sug-gested two separate clusters of initial and interesterified samples. DA was performed on the multivariate data to determine which of the 29 variables have discriminative power. When the 124 samples, char-acterized by their acylglycerols, were grouped into (i) initial and interesterified samples of blends I or II (four groups) or (ii) also by the catalyst used (six groups), 98.4% of the samples were correctly classified. Keywords: Acylglycerol profile / Interesterification / Pattern recognition / Solid fat content / Thermomyces lanuginosa
lipase
Received: August 15, 2007; accepted: March 27, 2008 DOI 10.1002/ejlt.200700270
1 Introduction
Interesterification (ester interchange also called transester-ification) is a route to improve certain physical, sensory and nutraceutical properties of natural fats. These changes result from the rearrangement of the molecular structure of tria-cylglycerols (TAG), leading to a modification of the acylglyc-erol profile.
By interesterification among TAG, it is possible to obtain a new product with improved nutritional (digestion and adsorption), biochemical and physical properties [e.g. crys-tallization, melting point, solid fat content (SFC)], without modifying the fatty acid composition. In fact, conversely to what occurs in hydrogenation, the original content of poly-unsaturated fatty acids (PUFA), namely essential fatty acids, is maintained and no formation of trans fatty acid isomers is observed. This is of much interest for applications in marga-rine, confectionary and bakery industries as well as for phar-maceutical and cosmetics purposes [1]. By mixing inter-esterified blends in different proportions with natural liquid oils and fats, it is possible to formulate a wide range of con-sumer table margarines and spreads, bakery margarines and even frying shortenings [1].
Correspondence: Suzana Ferreira-Dias, Instituto Superior de
Agrono-mia, DAIAT, Centro de Estudos de Engenharia Rural, Technical University of Lisbon, Tapada da Ajuda, 1349-017 Lisbon, Portugal.
E-mail: [email protected] Fax: 1351 21 3653200
In the food industry, the chemical interesterification reac-tion of fat blends is currently carried out at temperatures ranging from 50 to 120 7C, for less than 2 h, using metal alkylates or alkali metals (e.g. sodium methoxide and sodium) as catalyst. The interchange of the acyl groups proceeds at random. In addition, the final products may remain con-taminated by residual catalyst, and the formation of consider-able amounts of side products may occur, with a subsequent decrease in yield [2].
Currently, the time course of the interesterification of fat blends is indirectly assessed by the measurement for the per-centage (wt-%) of the solid fraction at different temperatures, known as SFC. The knowledge of the SFC of a fat helps to decide about the suitability of a fat for further processing. The SFC values at 10, 20, 30 and 35 7C (SFC10 7C, SFC20 7C, SFC30 7C and SFC35 7C, respectively) are related to the rheological behavior of fats at storage, packaging, bakery in winter and summer, and consumption temperatures, respec-tively. The SFC10 7Cis an indicator of the hardness of the final product at refrigerator conditions. The SFC at 35 7C is par-ticularly important for table margarines since it is related to the extent of melting in the mouth. The SFC35 7Cvalues of the interesterified fats must be smaller than their original coun-terparts, and as low as possible to avoid a sandy and coarse texture of the margarine.
The growing consumer demand for natural and healthy foods has become a challenge for the food industry. In this context, the current trend includes the replacement of chemi-cal catalysts by biocatalysts, recognized as natural, and the search for new formulations with nutraceutical properties. New products enriched in n-3 polyunsaturated fatty acids (n-3 PUFA), especially in eicosapentaenoic acid (EPA, 20:5n-(n-3) and docosahexaenoic acid (DHA, 22:6n-3), have a great potential due to their known benefits in human health, namely the prevention and treatment of heart diseases by increasing high-density lipoprotein cholesterol levels in serum, and the reduction of inflammatory conditions [3]. Since the majority of diets do not include adequate amounts of fish rich in n-3 PUFA, the incorporation of these fatty acids in food products more readily available for consumption such as vegetable oils and margarines may be an option.
In the field of oils and fats, the replacement of inorganic catalysts by lipases (acylglycerol acylhydrolases, EC 3.1.1.3) has been attempted in the last years, due to the benefits of the enzymatic route relative to chemical processes [4]. Lipases are enzymes that catalyze, in aqueous media, the hydrolysis of esters, but when in organic media at low water activity, they can also catalyze esterification and interesterification reac-tions. In addition, the use of 1,3-selective lipases permits to maintain the fatty acids in the internal position of the acylglycerols, which is nutritionally desirable and not possible by inorganic catalysis. The 1,3-regioselectivity presented by some lipases has been explored in order to obtain, usually from low-cost raw materials, high-added-value “structured lipids” with novel important medical, nutraceutical and food
applications [3]. Lipase-catalyzed interesterification of fat blends has been carried out, in batch or continuous mode, either in the presence of organic solvents or in solvent-free media [5–22].
The present work deals with chemically or lipase-catalyzed interesterified blends prepared from palm stearin, palm kernel oil and n-3 PUFA-rich triacylglycerols, for use in nutraceu-tical applications, particularly as margarine fat bases [15, 23]. Due to the high sensitivity of n-3 PUFA to thermal oxidation, these interesterified blends should be preferably used to be incorporated in table margarines and spreads or dressings and not used for the production of bakery margarines or frying shortenings.
The aim of this study was to evaluate the feasibility to dis-criminate among samples of different fat blends, prior to and after inorganic or 1,3-regioselective lipase-catalyzed inter-esterification in solvent-free medium, on the basis of their acylglycerol profile and their SFC values at different tem-peratures. It is expected that the lipase-catalyzed inter-esterified blends will present higher nutraceutical values than their chemically catalyzed counterparts since, due to the 1,3-regioselectivity of the lipase used, the PUFA at position 2 will be preserved.
Chemometrics, via pattern recognition techniques, namely principal component analysis (PCA) and dis-criminant analysis (DA), was the chosen tool to handle the multivariate data on acylglycerol profile and SFC values.
2 Materials and methods
2.1 MaterialsPalm stearin and palm kernel oil were supplied by FIMA/VG, Produtos Alimentares, Portugal; two commercial concentrates of triacylglycerols rich in n-3 PUFA, “EPAX 2050TG” [20% EPA (20:5n-3) and 50% DHA (22:6n-3)] and “EPAX 4510TG” (45% EPA and 10% DHA), were a gift from EPAX AS, Lysaker, Norway. The fatty acid composition of these fats has previously been published [15]. The free fatty acid content (FFA, %) of palm stearin, palm kernel oil, and EPAX 4510T were 0.58, 0.28, and 0.28, and their peroxide values were 10, 10, and 5 meq/kg, respectively [15].
The commercial immobilized thermostable 1,3-regiose-lective lipase from Thermomyces lanuginosa, Lipozyme™ TL IM, was a gift from Novozymes A/S, Bagsvaerd, Den-mark. Lipozyme™TL IM is a food-grade granulated silica-immobilized lipase preparation adequate for the inter-esterification of fats in solvent-free media.
Tripalmitin, tristearin, triolein, diolein and monoolein standards were from Sigma-Aldrich, Germany; 2’,7’-dichloro-fluorescein standard was from Fluka; powdered sodium meth-oxide 95% was from Sigma-Aldrich, Germany, and silica-gel G60 thin-layer chromatography (TLC) plates were supplied by Merck. HPLC-grade acetone, from Fisher Scientific, UK, and
acetonitrile for HPLC, gradient grade, from Sigma-Aldrich, Germany, were used. Ethyl ether, n-hexane and glacial acetic acid p.a. were obtained from various sources.
2.2 Methods
2.2.1 Lipase-catalyzed interesterification
Interesterification reactions were performed in 100-mL ther-mostated cylindrical batch reactors, under magnetic stirring. The reaction media consisted of two different blend types of three fats with a total mass of 60 g: type I (palm stearin, palm kernel oil and EPAX 4510TG) and type II blends (palm stearin, palm kernel oil and EPAX 2050TG). A load of 5 wt-% of the immobilized lipase was used.
For each blend type tested, a central composite rotatable design (CCRD) corresponding to 27 experiments was per-formed as previously described [15] and is presented in Table 1. At the end of each experiment, 5-mL samples were taken and the biocatalyst was removed by paper filtration at approximately 70 7C. Initial and interesterified samples were stored at – 18 7C for subsequent analysis.
2.2.2 Chemical interesterification
For each type of fat blend (type I and type II containing EPAX 4510TG or EPAX 2050TG, respectively), five different sam-ples, with the formulations used in the lipase-catalyzed experi-ments nos. 21–25 (Table 1), were submitted to chemical inter-esterification as previously described [23]. At the end of the experiments, the catalyst (powdered sodium methoxide) was removed by paper filtration at approximately 70 7C [23]. All samples (ten initial blends and ten upon chemical inter-esterification) were stored at – 18 7C for subsequent analysis. 2.2.3 Assay for acylglycerol profile
The changes in acylglycerol profile, occurring by the inter-esterification reaction, were evaluated by non-aqueous reverse-phase HPLC using a Merck Hitachi (Germany) chromato-graph equipped with a reverse-phase column (100 Superspher 100-RP-18; 25064 mm i.d., 5 mm particle size) and a refrac-tive index detector. The following conditions were used: mobile phase of acetone/acetonitrile (63.5 : 36.5, vol/vol), at a flow rate of 0.8 mL/min; oven temperature of 40 7C; injection of 10mL of a solution of the fat sample (2% wt/vol) in HPLC-grade acetone. The total HPLC run time was 35 min.
The samples (62 of initial blends, 10 samples after inor-ganic interesterification and 52 lipase-catalyzed interesterified samples) were assayed for their acylglycerol profile without any pretreatment.
For each blend type, up to 25 peaks corresponding to the various groups of acylglycerols were separated according to their equivalent carbon number (ECN). The ECN value is defined as [24]:
Table 1. CCRD followed in the lipase-catalyzed experiments as a
function of reaction time, temperature, palm oil stearin (PS) and “EPAX 4510TG” (blend I) or “EPAX 2050TG” (blend II) concentra-tions used [15]. Experimental points Experi-ment no. Time [min] Tempera-ture [7C] Palm stearin [%] EPAX [%] Factorial points 1 37.5 60 55 10 2 37.5 60 55 20 3 37.5 60 75 10 4 37.5 60 75 20 5 37.5 70 55 10 6 37.5 70 55 20 7 37.5 70 75 10 8 37.5 70 75 20 9 82.5 60 55 10 10 82.5 60 55 20 11 82.5 60 75 10 12 82.5 60 75 20 13 82.5 70 55 10 14 82.5 70 55 20 15 82.5 70 75 10 16 82.5 70 75 20 Star points 17 15 65 65 15 18 105 65 65 15 19 60 55 65 15 20 60 75 65 15 21 60 65 45 15 22 60 65 85 15 23 60 65 65 5 24 60 65 65 25 Center points 25 60 65 65 15 26 60 65 65 15 27 60 65 65 15 ECN = C – 2n
where C is the number of carbon atoms in the fatty acids chains of the acylglycerols and n is the number of double bonds in these fatty acid residues. The relative amount of each peak is given in area percentage.
A tentative identification of the various peaks separated under the HPLC conditions followed in this study was attempted (i) using a limited number of TAG standards (tri-palmitin, tristearin and triolein), (ii) by comparison with chromatograms obtained with similar fats as previously reported [6, 9, 11, 25], and (iii) was based on the fatty acid composition of the individual fats used in each blend [15]. Peak identification for EPAX 4510TG and EPAX 2050TG was not possible due to the lack of standards and of available information about the TAG composition of these oils.
Also, in order to investigate whether some peaks with lower ECN were TAG or mixtures of monoacylglycerols
(MAG), diacylglycerols (DAG) and TAG with the same ECN, partial acylglycerols were separated by TLC for sub-sequent HPLC analysis. Samples were diluted in n-hexane (10%, wt/vol) and spotted on silica gel TLC plates (in con-tinuous bands of 200mL). Elution was carried out using a solution of n-hexane/ethyl ether/acetic acid (70 : 30 : 1.5, vol/ vol/vol) as the mobile phase. Plates were sprayed with 2% (wt/vol) 2’,7’-dichlorofluorescein in 95% ethanol (vol/vol) and observed under UV light at 366 nm. The individual bands corresponding to the various groups of compounds (MAG, DAG and TAG) were identified by comparison with standards (monoolein, diolein and triolein, respectively). MAG, DAG (the double band of 1,2- and 1,3-DAG) and TAG bands were removed separately from the plates and washed off from the silica with n-hexane (three times 25 mL). The solutions were recovered by paper filtration, concentrated in a rotavapor at 30 7C under reduced pressure and assayed by HPLC.
2.2.4 Data analysis
A total of 124 samples (62 initial blends, 62 interesterified blends) was characterized by (i) their acylglycerol profile (25 variables corresponding to the 25 peaks that can appear in the chromatograms) and (ii) the previously reported SFC values at 10, 20, 30 and 35 7C assayed by NMR [15, 23]. Thus, a data matrix with 124 lines (samples) and 29 rows (variables) was obtained.
PCA and DA were performed using the software Statis-tica™, version 6, from Statsoft, Tulsa, USA.
2.2.4.1 Principal component analysis
In this study, PCA [26–28] was carried out, aimed at (i) the reduction of the original hyperspace of the samples to a smal-ler-dimension space without considerable loss of information, (ii) the identification of the most important variables to char-acterize the different types of samples, and (iii) the identifica-tion of possible clusters of samples. By PCA, the search for eventual relationships among the acylglycerol profile and SFC values at different temperatures (10, 20, 30 and 35 7C) for the various samples before and after interesterification was also attempted.
PCA was performed on the whole matrix containing 124 samples and also on the following smaller matrices: chemical interesterification matrix containing the samples from blend types I and II, prior and after chemical esterification (20629; samples A and B); enzymatic inter-esterification matrix containing the initial and lipase-cata-lyzed samples of blend type I (with EPAX 4510TG; 52629; samples C); and enzymatic interesterification matrix containing the initial and lipase-catalyzed samples of blend type II (with EPAX 2050TG; 52629; sam-ples D).
2.2.4.2 Discriminant analysis
After the clustering of samples suggested by PCA, a DA was used to determine which variables discriminate among these groups a priori defined and also to confirm their existence.
The basic underlying idea is to see whether groups differ with regard to the mean of a variable and then use that variable to predict group membership [27, 28]. The procedure is identical to the one-way analysis of variance or to the multi-variate analysis of variance if several variables are used [28].
The models of discrimination were built step by step, and a forward stepwise analysis was performed using the following options: tolerance of 0.010; F to enter equal to 1.00 and F to remove equal to 0.00. In each step, the variable that would contribute most to the discrimination between groups was selected. The maximum number of discriminant functions (or canonical roots) will be equal to the number of groups minus one or to the number of variables in the analysis, whichever is smaller. The best combination of variables for DA includes variables that represent independent measures of product similarities and differences.
In addition, the classification functions can be used to determine to which group each case most likely belongs. The classification matrix shows the number of cases that were correctly classified and those that were misclassified.
DA was performed on the whole matrix containing 124 samples and considering subgroups of initial and inter-esterified samples a priori defined. A first DA was carried out only considering the initial and interesterified samples as a function of the blend type used, and independently of the type of catalyst used for the interesterification reaction. Thus, only four groups of samples were a priori defined: group of the initial samples of blend type I (Ai), group of the initial samples of blend type II (Bi), and groups of the interesterified samples of blend type I and II (Afand Bf, respectively).
In a second DA, the effect of both fat blend type and cat-alyst used was considered. Therefore, the following six groups of samples were a priori defined: group of the initial samples of blend type I (Ai), group of the initial samples of blend type II (Bi), groups of the chemically interesterified samples of blend type I (Af) and of blend type II (Bf), and groups of the lipase-catalyzed interesterified samples of blend type I (Cf) and of blend type II (Df).
3 Results and discussion
3.1 Acylglycerol profilesEach fat used in the formulations of blends I and II was first analyzed separately. Palm stearin mainly contains high-ECN peaks (Table 2: peaks 17–25; ECN 46–52) due to high amounts of palmitic (ca. 60%) and oleic (ca. 25%) acids; palm kernel oil is a lauric fat characterized by the presence of lower-ECN TAG (lower-ECN lower than 46) due to the presence of high
Table 2. Tentative identification of the individual peaks observed in the chromatograms, as a function of their ECN and fatty acid
com-position (fatty acids: C, capric (10:0); Ca, caprylic (8:0); D, docosahexaenoic, DHA (22:6); E, eicosapentaenoic, EPA (20:5); L, linoleic (18:2); La, lauric (12:0); Ln, linolenic (18:3); M, myristic (14:0); O, oleic (18:1); P, palmitic (16:0); S, stearic (18:0); DAG, diacylglycerols; PS, palm stearin; PK, palm kernel oil; T0= initial sample; Tf= interesterified sample).
Blend type I Blend type II (PS1 PK 1 EPAX 4510TG) (PS1 PK 1 EPAX 2050TG)
Peak no. ECN T0 Tf T0 Tf
1 ? EPAX1 DAG EPAX1 DAG DAG DAG
2 28 LaCaCa1 DAG LaCaCa1 DAG 1 EDCa EPAX/LaCaCa1 DAG EPAX/LaCaCa1 DAG1 EDCa 3 28 CCCa1 DAG CCCa1 DAG CCCa1 DAG CCCa1 DAG
4 30 CCC1 DAG 1 EEE, DDD, EED, DDE
CCC1 DAG 1 EEE 1 DDD 1 EED1 DDE EEC 1 (C22:5) ECa
EEE1 DDD 1 EED 1 DDE CCC1 DAG
CCC1 DAG 1 EEE 1 DDD 1 EED 1 DDE 1 EEC 1 (C20:4) DCa1 (C22:5) ECa
5 32 LaCC1 CaLaLa DAG1 LaCC 1 CaLaLa 1 LnDC LaCC1 CaLaLa 1 EPAX LaCC1 CaLaLa 1 EPAX 1 DAG 1 LnDC
6 34 LaLaC1 CLaM DAG1 LaLaC 1 LDC 1 LnLaE LaLaC LaLaC1 DAG 1 LDC1 LnLaE 7 36 LaLaLa DAG1 LaLaLa 1 DOC 1 ELLa LaLaLa LaLaLa1 DAG 1 DOC 1 ELLa 8 38 LaLaM LaLaM1 EOLa 1 PLaD 1 SDC 1
MMD
LaLaM LaLaM1 EOLa 1 PLaD 1 SDC 1 MMD
9 40 LaLaO LaLaO1 LaES LaLaO LaLaO1 LaES
10 40 LaMM LaMM1 PEM LaMM LaMM1 PEM
11 42 LaOM LaOM LaOM LaOM
12 42 LaPM LaPM LaPM LaPM
13 44 LaOO LaOO LaOO LaOO
14 44 LaOP LaOP LaOP LaOP
15 44 LaPP1 MOM LaPP1 MOM LaPP1 MOM LaPP1 MOM 16 46 MOO1 OOL 1 PLO MOO1 OOL 1 PLO MOO1 OOL 1 PLO MOO1 OOL 1 PLO 17 46 MOP1 PLP MOP1 PLP MOP1 PLP MOP1 PLP
18 48 OOO OOO OOO OOO
19 48 POO POO POO POO
20 48 POP POP POP POP
21 48 PPP PPP PPP PPP
22 50 OOS OOS OOS OOS
23 50 POS POS POS POS
24 50 PPS PPS PPS PPS
25 52 SOS SOS SOS SOS
amounts of short- and medium-chain saturated fatty acids (ca. 44% lauric and 15% myristic acids) and also about 10% pal-mitic acid. The concentrates EPAX 4510TG and EPAX 2050TG have the lowest-ECN species due to the presence of long-chain polyunsaturated fatty acids: 63 and 88% of n-3 PUFA from a total of 67 and 91% PUFA content, respectively [15]. Thus, the content of Table 1 is a feasible approach based on the original composition of the fats and oils used and on the predictable formation of new acylglycerols. Only the use of other powerful analytical techniques such as mass spectros-copy could allow a correct identification of the 25 peaks appearing in the initial and interesterified fat blends.
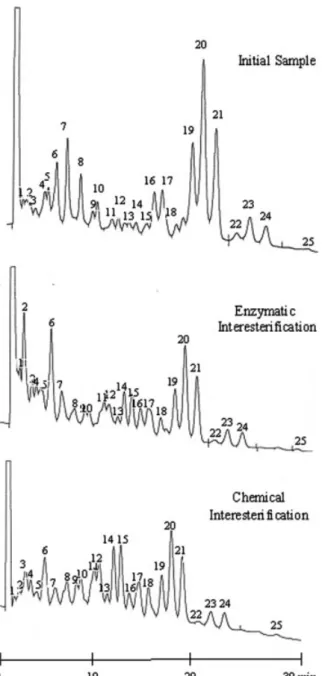
As an example, Fig. 1 shows the chromatograms of (i) the initial sample of blend type I corresponding to the center point of the experimental design followed (65% palm stearin1 20% palm kernel oil1 15% EPAX 4510TG; Table 1) and (ii) of
the same sample after enzymatic (at 65 7C for 60 min) or (iii) chemical interesterification. For both fat blends used, noticeable modifications on their acylglycerol profiles were observed upon either inorganic or lipase-catalyzed inter-esterification reaction (Fig. 1).
In the vast majority of samples, it was observed that a de-crease in the amounts of peaks with high ECN (e.g. peaks 20 and 21, ECN = 48), which are present in large amounts in palm stearin, is accompanied by an increase of lower-ECN peaks [e.g. peaks 6 (ECN = 34), 14 (ECN = 44) and 15 (ECN = 44)]. The decrease in ECN values for the inter-esterified TAG is likely a result of the increased unsaturation of these TAG compared to palm stearin and palm kernel oil TAG. In the lipase-catalyzed interesterified samples, a signifi-cant increase in peak 2 (ECN = 28) was observed for both fat blends used.
Figure 1. HPLC chromatograms of the acylglycerol profiles of the
initial blend sample containing 65% palm stearin, 20% palm kernel oil and 15% EPAX 4510TG (blend I), and upon interesterification catalyzed by Lipozyme TL IM, for 60 min at 65 7C, or chemical interesterification.
The consumption of TAG species with high ECN, accompanied by the increase of acylglycerol species of lower ECN, has also been observed (i) during the 1,3-selective lipase-catalyzed interesterification of fat blends of palm stearin with coconut oil [11], palm kernel oil [16] and canola oil [29], and (ii) during the chemical interesterification of ternary blends of palm, palm kernel and sunflower oils [25] and palm stearin, palm kernel and sunflower oils [30].
Since species of low ECN may be TAG or partial acylglycerols with the same ECN, the initial samples corre-sponding to the center points of the experimental designs (Table 1) and these samples after enzymatic interesterification were submitted to TLC analysis, both for fat blends I and II. The TLC analysis showed an increase of the DAG bands (visual observation) in the interesterified samples, while the presence of MAG was not detected. The double bands corre-sponding to 1,3- and 1,2-DAG and the TAG band were ana-lyzed by HPLC (c.f. 2.2.3.). The chromatograms obtained for the various fractions confirm the presence of DAG together with TAG with the same ECN, either in the initial or in the interesterified samples (Fig. 2).
The increase of DAG levels, by lipase-catalyzed inter-esterification of palm stearin with palm kernel oil [9], palm stearin and coconut oil [11, 16], flaxseed oil with palm olein or palm stearin [13], palm stearin with canola oil [29], and olive oil with fully hydrogenated palm oil [21], was also reported. 3.2 Principal component analysis
PCA was performed on the data concerning acylglycerol composition and SFC values of both the initial fat blend sam-ples and upon chemical or lipase-catalyzed interesterification. As referred earlier, the description of the interesterification experiments and the SFC values of these samples have been published previously [15, 23]. In all the experiments, the interesterification catalyzed either by Lipozyme™TL IM or by sodium methoxide promoted a decrease in the SFC values of the fat blends at 10, 20, 30 and 35 7C. The variation ranges for the SFC values assayed at each test temperature were similar for both blend types used: SFC10 7C varied from 49 to 68, SFC20 7Cvaried from 28 to 57, SFC30 7Cranged from 15 to 40, and the SFC35 7Cvalues from 11 to 33 [15, 23]. The highest SFC values correspond to the samples containing higher amounts of palm stearin. Upon interesterification, a decrease in all the SFC values was observed. The SFC variation ranges for the interesterified samples were similar for both blend types, whatever the catalyst type used: SFC10 7Cvaried from 28 to 60, SFC20 7Cvaried from 19 to 39, SFC30 7Cvaried from 7 to 24, and the SFC35 7Cvalues from 0.5 to 18 [15, 23].
The sensory attribute of “coolness” is connected with the content in saturated TAG. The SFC values at 30 and 35 7C are principally determined by this content [1]. At consump-tion of a margarine, the sensaconsump-tion of “coolness” and the melt-ing speed have both been reported to increase with the differ-ence between the SFC20 7C and the SFC30 7C values of the interesterified fat blend, as referred by G. Langsbergen (at http://www.fatsforfoods.com, 2008). The values for (SFC20 7C – SFC30 7C) obtained for the interesterified blends, containing either EPAX 4510TG (blends I) or EPAX 2050TG con-centrates (blends II), varied between 10 and 19. At 25 wt-% of both types of EPAX, the values of (SFC20 7C– SFC30 7C) of the interesterified blends still fulfill the technological requirements for the production of table margarines [15].
Figure 2. Acylglycerol profiles of
the whole sample of Fig. 1, prior to and after lipase-catalyzed inter-esterification, and the chromato-grams of the respective TAG and DAG fractions, separated by TLC.
The results concerning PCA of the various data matrices are presented in Table 3. The initial 29-dimensional hyper-space can be highly reduced to a 7-dimensional hyper-space, for the chemical matrix, or to 6-dimensional spaces (eigenvalues greater than 1) for both enzymatic matrices, which account for more than 90, 85 and 84% of the original information (variance), respectively.
When all the initial and interesterified samples (chemical and enzymatic matrices) are analyzed together, the original information can be visualized in a 6-dimension space, explaining 77% of the information contained in the original data (data not shown).
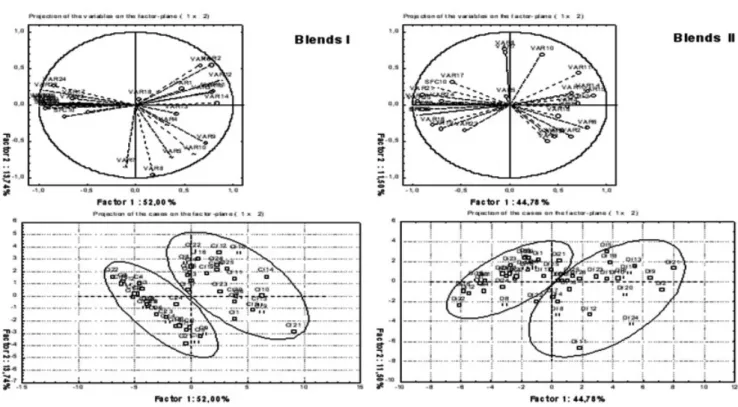
Figure 3 is a plot in the reduced space, defined by the first and the second significant principal components, of the sam-ples of both blend types, prior and after lipase-catalyzed interesterification, and variable loadings (i.e. the correlations between the original variables and the principal components). For every matrix, the first principal component (Factor 1, F1) is positively correlated with medium- and low-ECN peaks and negatively correlated with the variables corresponding to the acylglycerols with higher ECN (46, 48 and 50) and the
SFC values at 10, 20, 30 and 35 7C. As previously reported, a decrease in all SFC blend values was observed upon lipase-catalyzed as well as upon chemical interesterification [15, 23]. In fact, high SFC values are ascribed to the presence of TAG with long-chain saturated fatty acids, i.e. of high ECN.
When the samples were plotted on the plane formed by the first and the second principal components, F1F2(Fig. 3), and also on the plane F1F3 for the chemical matrix (figure not shown), two clusters become evident: a cluster of initial sam-ples, defined by higher SFC values and higher amounts of TAG of high ECN, and a cluster of interesterified samples, showing increased amounts of lower-ECN acylglycerol spe-cies and lower SFC values. A translation of the initial group of samples from the left to the right side of the graphs is observed upon interesterification, regardless of the interesterification method and of the initial blend composition used. These pro-jections are in accordance with the analysis of the chromato-grams and of the SFC values of these samples [15, 23]. In fact, a decrease of TAG of ECN 46–50 is observed, either by chemical or enzymatic interesterification. This decrease is accompanied by an increase in the amount of acylglycerols
Table 3. PCA eigenvalues and variances explained by the first 20 principal components extracted from the various data matrices of
samples defined by the acylglycerol profile and SFC values (SFC10 7C, SFC20 7C, SFC30 7Cand SFC35 7C), prior to and upon chemical or enzymatic interesterification.
Chemical interesterification matrix Enzymatic interesterification matrices
Blend types I and II Blend type I (EPAX 4510TG) Blend type II (EPAX 2050TG) Principal component Eigenvalue Variance [%] Cumulative variance [%] Eigenvalue Variance [%] Cumulative variance [%] Eigenvalue Variance [%] Cumulative variance [%] 1 13.25 45.70 45.70 15.08 52.00 52.00 12.99 44.78 44.78 2 3.51 12.10 57.80 3.99 13.74 65.74 3.34 11.50 56.28 3 2.57 8.86 66.66 2.39 8.24 73.98 3.23 11.14 67.42 4 2.23 7.69 74.34 1.28 4.42 78.40 2.55 8.80 76.22 5 1.83 6.31 80.65 1.17 4.05 82.45 1.36 4.70 80.92 6 1.59 5.48 86.13 1.00 3.44 85.89 1.04 3.57 84.49 7 1.35 4.66 90.78 0.79 2.73 88.62 0.77 2.65 87.14 8 0.86 2.96 93.74 0.78 2.68 91.31 0.66 2.28 89.42 9 0.63 2.16 95.90 0.64 2.22 93.53 0.65 2.23 91.65 10 0.37 1.28 97.18 0.51 1.76 95.29 0.41 1.40 93.05 11 0.31 1.07 98.25 0.28 0.98 96.26 0.40 1.37 94.42 12 0.20 0.70 98.95 0.23 0.80 97.07 0.29 1.01 95.43 13 0.11 0.38 99.33 0.22 0.76 97.82 0.25 0.86 96.29 14 0.09 0.30 99.63 0.15 0.53 98.35 0.23 0.79 97.08 15 0.04 0.14 99.77 0.11 0.39 98.74 0.21 0.73 97.81 16 0.03 0.09 99.86 0.08 0.29 99.03 0.16 0.54 98.35 17 0.02 0.06 99.92 0.08 0.26 99.28 0.12 0.42 98.76 18 0.01 0.05 99.97 0.06 0.21 99.50 0.12 0.41 99.17 19 0.01 0.03 100.00 0.05 0.16 99.66 0.07 0.26 99.43 20 0.00 0.00 100.00 0.03 0.10 99.75 0.05 0.18 99.61
Figure 3. PCA projections of all the variables (VAR1–VAR25: chromatographic peaks; SFC10 7C, SFC20 7C, SFC30 7Cand SFC35 7C) and of (Blends I) the initial samples, Ci, of blends type I and upon lipase-catalyzed interesterification (Cf) and (Blends II) of the initial samples Diof blends type II and upon lipase-catalyzed interesterification (Df), on the plane F1F2defined by the first and the second principal components.
and/or the formation of new acylglycerols of lower ECN (28– 44). Some of these new species are DAG (peaks 1–7; ECN equal or lower than 36), as confirmed by TLC.
When the 124 samples were analyzed together, the pro-jection of such a large number of samples does not allow for a clear identification of separate groups (figure not shown). 3.3 Discriminant analysis
The PCA of the various samples suggested the presence of groups of samples in the original hyperspace containing these samples. Thus, DA was performed on the original data in order to (i) assess the existence of the clusters suggested by PCA and (ii) to identify the variables that in fact discriminate among these groups a priori defined. In both DA performed, samples were characterized (i) only by their acylglycerol pro-file, (ii) only by their SFC values, and also (iii) by the acyl-glycerol profile together with their SFC values.
Considering the DA as a function of the blend type used, 122 of the 124 samples (98.4%) defined only by their acyl-glycerol profile were correctly classified (Table 4). The corre-sponding classification functions (not shown) excluded the following five peaks of the chromatograms since they showed no discriminant power among sample groups: peak 9 (LaLaO), peak 15 (LaPP1 MOM), peak 19 (POO), peak 20 (POP) and peak 24 (PPS). It is worthy of notice that when the samples were characterized only by their SFC values, just about 51% of the samples were correctly classified (data not shown).
When the SFC values and the acylglycerol profiles were used simultaneously to characterize the samples, the SFC values showed to discriminate among the sample groups. However, the same percentage of correctly classified samples (98.4%), as obtained if only the acylglycerol profiles were considered, was achieved (data not shown), indicating that for sample characterization, the acylglycerol profile is sufficient. This may be explained by (i) a relatively low discriminant power of the SFC values and (ii) by a weak relationship be-tween the SFC values and the acylglycerol profiles.
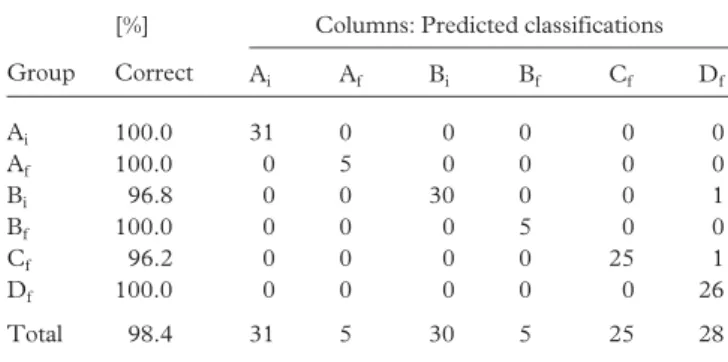
With respect to the DA as a function of both blend and catalyst types (six groups a priori defined), the results obtained in terms of percentage of samples correctly classified were similar to those obtained in the previous DA where only four groups were a priori defined (98.4%), either when only the acylglycerol profiles or when the SFC values were con-sidered together with the acylglycerol profiles (Tables 4, 5). To discriminate among the six groups, all the peaks except peak 24 of the chromatogram, corresponding to the TAG PPS, have to be considered. Thus, the peaks 9 (LaLaO), 15 (LaPP1 MOM), 19 (POO) and 20 (POP) must be included to be able to discriminate among enzymatically and chemically interesterified samples.
Interestingly, except for peak 9, all these additional TAG present oleic acid at the sn-2 position, which will be not avail-able for the action of the sn-1,3-selective Thermomyces
lanugi-Table 4. DA classification matrix for the groups of initial and
inter-esterified samples defined by the blend type used (samples A: blend I with EPAX 4510TG; samples B: blend II with EPAX 2050TG) before (Aiand Bi) and after (Afand Bf) interesterification (chemical or enzymatic). Samples were characterized by their acylglycerol profiles.
[%] Columns: Predicted classifications Group Correct Ai Af Bi Bf Ai 100.0 31 0 0 0 Af 96.8 0 30 0 1 Bi 96.8 0 0 30 1 Bf 100.0 0 0 0 31 Total 98.4 31 30 30 33
Table 5. DA classification matrix for the six groups of samples
defined by the blend type (samples A and C: blend I with EPAX 4510TG; samples B and D: blend II with EPAX 2050TG) and cata-lyst type used. Samples prior to (Ai and Bi,) and upon inter-esterification (chemical: Af and Bf; enzymatic: Cf and Df) were characterized by their acylglycerol profiles.
[%] Columns: Predicted classifications Group Correct Ai Af Bi Bf Cf Df Ai 100.0 31 0 0 0 0 0 Af 100.0 0 5 0 0 0 0 Bi 96.8 0 0 30 0 0 1 Bf 100.0 0 0 0 5 0 0 Cf 96.2 0 0 0 0 25 1 Df 100.0 0 0 0 0 0 26 Total 98.4 31 5 30 5 25 28
nosa lipase. Thus, the 1,3-regioselectivity of this lipase is confirmed by the acylglycerol profiles of the lipase-catalyzed interesterified samples. Also, peaks 9 and 15 correspond to TAG containing lauric acid at external positions. A high af-finity of Lipozyme TL IM towards lauroyl residues was also observed in the production of structured TAG containing conjugated linoleic acid at the sn-2 position and lauric acid at external positions, in solvent-free media [22].
With regard to the SFC values, all of them showed dis-criminant power among the six groups of samples. However, only 51.6% of the samples were correctly classified into the six groups a priori defined (data not shown). Again, when a DA was performed considering the samples defined both by their acylglycerol profile and SFC values, the classification predic-tion was not improved.
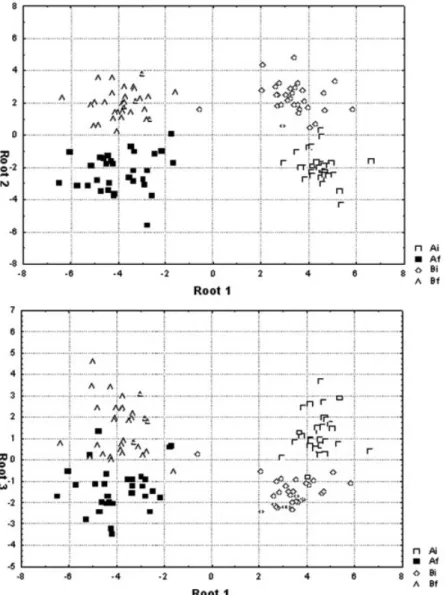
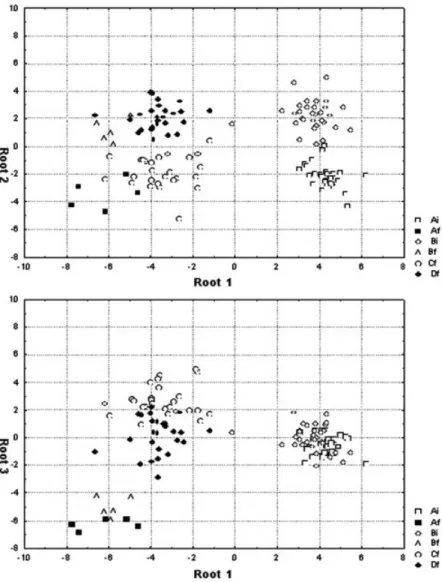
Figures 4 and 5 show the projections of the samples, characterized by the acylglycerol profiles, on the planes defined by the canonical roots 1 and 2 and 1 and 3, respec-tively when four or six groups were a priori defined. In both
Figure 4. DA-plot of the groups of initial samples
of blends I (Ai) and II (Bi) and upon interesterifica-tion (Afand Bf), on the planes defined by the cano-nical roots 1 and 2, and 1 and 3. Samples were defined by all the variables.
cases, the clustering of the samples into the groups previously defined is well illustrated. Similarly to the PCA plots, a trans-lation of the groups of the initial samples is observed upon interesterification.
4 Conclusions
The obtained results showed that PCA is a useful exploratory tool that can be used to study lipase-catalyzed and chemical interesterification of fat blends, in order to give global infor-mation on the changes occurring in the acylglycerol compo-sition and SFC values.
The final SFC values at the different temperatures of the interesterified fat blends indicate that these blends can be used to prepare typical base stocks for margarine blends enriched with n-3 PUFA [15]. The margarine manufacturer will choose
the correct proportions of natural liquid oils and fats and interesterified basestock, which will be dictated by the SFC values of the available interesterified fat blends, to formulate the requested type of margarine.
The DA allows for the correct identification of samples via the knowledge of their acylglycerol profiles. In fact, the knowledge of the acylglycerol profile of an unknown fat blend sample is enough (i) to predict the blend type used in its for-mulation, (ii) to know if the sample has been previously interesterified or not, and (iii) in the case of an interesterified sample allows predicting the type of catalyst used. Also, DA was able to confirm the 1,3-regioselectivity of Lipozyme TL IM solely on the basis of the acylglycerol profiles of the interesterified samples.
The SFC values on their own are not sufficient to correctly predict the group to which a sample most likely belongs. When considered together with the acylglycerol profile, the
Figure 5. DA-plot of the groups of initial samples
of blends I (Ai) and II (Bi) and after chemical (Afand Bf) or lipase-catalyzed interesterification (blend I: Cf; blend II: Df) on the planes defined by the canonical roots 1 and 2, and 1 and 3. Samples were defined by all the variables.
SFC values did not increase the level of correct classification prediction.
The aim of this work was thus accomplished, i.e. both chemically and lipase-catalyzed interesterified samples could be distinguished from native oils and their blends by applying PCA and DA to simple HPLC chromatograms, overcoming the use of expensive equipment for the identification of indi-vidual compounds. In addition, this study indicates that chemometrics is an extremely useful tool to predict results regarding the interesterification of fat blends.
Acknowledgments
This work was supported by a research project funded by FEDER and Fundac¸ão para a Ciência e Tecnologia, Portugal (POCTI/ 39168/AGR/2001). The authors are grateful to Novozymes A/S, Denmark, and EPAX, AS, Norway, for the gift of the enzyme and
“EPAX” samples, respectively, and FIMA/VG, Produtos Ali-mentares, Lda., StaIria de Azóia, Portugal, for the supply of the vegetable fats and the use of NMR facilities.
Conflict of interest statement
The authors have declared no conflict of interest.
References
[1] L. Faur:Margarine technology. In: Oils and Fats Manual. Vol. 2. Eds. A. Karleskind, J.-P. Wolff, Lavoisier Publishing, Technique & Documentation, Paris (France) 1996, pp. 951–1000. [2] M. D. Erickson: Interesterification. In: Practical Handbook of
Soybean Processing and Utilization. Ed.D. R. Erickson, AOCS
Press and United Soybean Board, Champaign, IL (USA) 1995, pp. 277–296.
[3] H. T. Osborn, C. C. Akoh: Structured lipids – Novel fats with medical, nutraceutical, and food applications. Compr Rev Food
Sci Food Saf. 2002, 3, 93–103.
[4] X. Xu: Production of specific-structured triacylglycerols by lipase-catalyzed reactions: A review. Eur J Lipid Sci Technol. 2000, 102, 287–303.
[5] J. M. Muderhwa, M. Pina, D. Montet, P. Feuillard, J. Graille: Interestérification enzymatique régioselective 1-3 en milieu fondu et en réacteur continu: Valorisation de l’huile de palme.
Oléagineux. 1989, 44, 36–43.
[6] H. M. Ghazali, S. Hamidah, Y. B. Che Man: Enzymatic transesterification of palm olein with nonspecific and 1,3-specific lipases. J Am Oil Chem Soc. 1995, 72, 633–639. [7] S. Ghosh, D. K. Bhattacharyya: Utilization of high-melting
palm stearin in lipase-catalyzed interesterification with liquid oils. J Am Oil Chem Soc. 1997, 74, 589–592.
[8] V. Seriburi, C. C. Akoh: Enzymatic transesterification of trio-lein and stearic acids and solid fat content of their products. J
Am Oil Chem Soc. 1998, 75, 511–516.
[9] Z. Zainal, M. S. A. Yusoff: Enzymatic interesterification of palm stearin with palm kernel olein. J Am Oil Chem Soc. 1999,
76, 1003–1008.
[10] N. M. Osório, S. Ferreira-Dias, J. H. Gusmão, M. M. R. da Fonseca: Response surface modelling of the production of
ø-3 polyunsaturated fatty acids enriched fats by a commercial immobilized lipase. J Mol Catal B Enzym. 2001, 11, 677–686. [11] H. Zhang, X. Xu, J. Nilsson, H. Mu, J. Adler-Nissen, C.-E. Hoy: Production of margarine fats by enzymatic inter-esterification with silica-granulated Thermomyces lanuginosa lipase in a large-scale study. J Am Oil Chem Soc. 2001, 78, 57– 64.
[12] C. F. Torres, F. Munir, R. M. Blanco, C. Otero, C. G. Hill Jr.: Catalytic transesterification of corn oil and tristearin using immobilized lipases from Thermomyces lanuginosa. J Am Oil
Chem Soc. 2002, 79, 775–781.
[13] K. Long, I. Zubir, A. B. Hussin, N. Idris, H. M. Ghazali, O. M. Lai: Effect of enzymatic transesterification with flaxseed oil on the high-melting acylglycerols of palm stearin and palm olein. J Am Oil Chem Soc. 2003, 80, 133–137.
[14] T. Yang, M.-B. Fruekilde, X. Xu: Applications of immobilized
Thermomyces lanuginosa lipase in interesterification. J Am Oil Chem Soc. 2003, 80, 881–887.
[15] A. C. Nascimento, C. S. R. Tecelão, J. H. Gusmão, M. M. R da Fonseca, S. Ferreira-Dias: Modelling lipase-catalysed transesterification of fats containing n-3 fatty acids monitored by their solid fat content. Eur J Lipid Sci Technol. 2004, 106, 599–612.
[16] H. Zhang, P. Smith, J. Adler-Nissen: Effects of degree of enzymatic interesterification on the physical properties of margarine fats: Solid fat content, crystallization behavior, crystal morphology and crystal network. J Agric Food Chem. 2004, 52, 4423–4431.
[17] N. M. Osório, J. H. Gusmão, M. M. da Fonseca, S. Ferreira-Dias: Lipase-catalysed interesterification of palm stearin with
soybean oil in a continuous fluidised-bed reactor. Eur J Lipid
Sci Technol. 2005, 107, 455–463.
[18] T. H. Rønne, L. S. Pedersen, X. Xu: Triglyceride selectivity of immobilized Thermomyces lanuginosa lipase in interesterifica-tion. J Am Oil Chem Soc.2005, 82, 737–743.
[19] N. M. Osório, M. M. da Fonseca, S. Ferreira-Dias: Opera-tional stability of Thermomyces lanuginosa lipase during fats interesterification in continuous-packed-bed reactors. Eur J
Lipid Sci Technol. 2006, 108, 545–553.
[20] C. Otero, A. López-Hernandez, H. S. Garcia, E. Hernández-Martín, C. G. Hill Jr.: Continuous enzymatic transesterifica-tion of sesame oil and fully hydrogenated fat: Effects of reac-tion condireac-tions on product characteristics. Biotechnol. Bioeng. 2006, 94, 877–887.
[21] M.Criado, E. Hernández-Martin, C. Otero: Optimized inter-esterification of virgin olive oil with a fully hydrogenated fat in a batch reactor: Effect of mass transfer limitations. Eur J Lipid
Sci Technol. 2007, 109, 474–485.
[22] P. Villeneuve, N. Barouh, B. Baréa, G. Piombo, M. C. Fig-ueroa-Espinoza, F. Turon, M. Pina, R. Lago: Chemoenzy-matic synthesis of structured triacylglycerols with conjugated linoleic acids (CLA) in central position. Food Chem. 2007,
100, 1443–1452.
[23] J. C. Rodrigues, A. C. Nascimento, A. Alves, N. M. Osório, A. S. Pires, J. H. Gusmão, M. M. R. da Fonseca, S. Ferreira-Dias: Calibration of near infrared spectroscopy for solid fat content of fat blends analysis using nuclear magnetic reso-nance bata. Anal Chim Acta. 2005, 544, 213–218.
[24] M. P. Purdon: Application of HPLC to lipid separation and analysis: Mobile and stationary phase selection. In: Analyses of
Fats, Oils and Derivatives. Ed. E. G. Perkins, AOCS Press,
Champaign, IL (USA) 1993, pp. 166–192.
[25] H. M. D. Noor Lida, K. Sundram, W. L. Siew, A. Aminah, S. Mamot: TAG composition and solid fat content of palm oil, sunflower oil, and palm kernel olein blends before and after chemical interesterification. J Am Oil Chem Soc. 2002, 79, 1137–1144.
[26] J. C. Miller, J. N. Miller: Statistics for Analytical Chemistry. Ellis Horwood and Prentice Hall, New York (USA) 1993, pp. 169– 203.
[27] V. J. Bofinger: An introduction to some multivariate tech-niques with applications in field experiments. In: Developments
in Field Experiment Design and Analysis. Eds. V. J. Bofinger, J.
L. Wheeler, Commonwealth Agricultural Bureaux, Oxford (UK) 1975, pp. 73–83.
[28] D. R. Burgard, J. T. Kuznicki:Chemometrics: Chemical and
Sensory Data. CRC Press, Boston, MA (USA) 1990, pp. 135–
185.
[29] W. L. Siew, K. Y. Cheah, W. L. Tang: Physical properties of lipase-catalyzed interesterification of palm stearin with canola oil blends. Eur J Lipid Sci Technol. 2007, 109, 97–106. [30] H. M. D. Noor Lida, K. Sundram, I. Nor Aini: Effect of
chemical interesterification on triacylglycerol and solid fat contents of palm stearin, sunflower oil and palm kernel olein blends. Eur J Lipid Sci Technol. 2007, 109, 147–156.