João Bruno Canelas Cascão
Master’s of Science in Bioorganic
Application of NMR RDC’s, Relaxation and
Self-Diffusion for the Study of Dynamic
Processes of Small Molecules in Solution
Dissertation to achieve a Master’s Degree in Bioorganic
Adviser: Doutor Eurico José da Silva Cabrita, Professor Auxiliar, FCT-UNL
Jury:
President: Doutora Ana Maria Ferreira da Costa Lourenço, Professora Auxiliar FCT-UNL Examinor: Doutor Eurico José da Silva Cabrita, Professor Auxiliar, FCT-UNL
Application of NMR RDC’s, Relaxation and Self-Diffusion for the Study of Dynamic Processes of Small Molecules in Solution
Copyright © João Bruno Canelas Cascão, Faculdade de Ciências e Tecnologias da Universidade Nova de Lisboa
Agradecimentos
Gostaria de agradecer ao meu orientador Prof. Eurico Cabrita por me permitir desenvolver a tese de mestrado no seu laboratório.
Os meus agradecimentos estendem-se também aos meus colegas de laboratório Dr. Ângelo Figueiredo, Dr. Filipa Marcelo, Dr. Marta Corvo, Dr. Ana Sofia, por todas as discussões construtivas. Não esquecendo os juniores quero também agradecer ao, Micael Silva, João Silva, Ricardo Martinho e Tiago Paiva.
Um agradecimento a todos os colegas e amigos, em especial aos que mais me apoiaram directamente nesta jornada, sem os quais tal não teria sido possível, de seu nome: André Dias, Catarina Fernandes, Carmen Gómez, Fausto Queda, Helena Coelho, João Lino, Joaquim Fonseca, Pedro Henriques, Tiago Pascoa e Válter Frade.
Em último lugar, e de tudo o mais importante, quero expressar a minha gratidão à minha família pelo apoio e suporte.
Resumo
Relaxação “spin-lattice”, coeficientes de difusão e acoplamentos residuais dipolares (RDC'S) são a base da bem estabelecida técnica de ressonância magnética nuclear para o estudo físico-químico de moléculas pequenas (geralmente compostos orgânicos e produtos naturais com MW <1000 Da), por terem provado ser uma potente e complementar fonte de informação sobre os processos dinâmicos estruturais em solução. O trabalho desenvolvido nesta tese consiste na aplicação das técnicas de RMN anteriormente mencionadas para explorar, analisar e sistematizar padrões de comportamento dinâmico molecular de pequenas moléculas selecionadas em condições experimentais particulares. Dois sistemas foram escolhidos para investigar o comportamento dinâmico molecular por estas técnicas: a dinâmica de formação de par-iónico e interação de iões em líquidos iónicos (LI) e a dinâmica de reorientação molecular quando as moléculas são colocadas em fases orientadas (meios de alinhamento).
A aplicação de medições de relaxação “spin-lattice” e difusão de RMN foram utilizadas para estudar a dinâmica molecular de rotação e de translação do LI: 1-butil-3-metilimidazólio tetrafluoroborato [BMIM] [BF4]. O estudo da dinâmica catião-anião em solução pura e misturas IL-água foi sistematicamente investigada por uma combinação de técnicas multinucleares de relaxação de RMN com os dados de difusão (usando espectroscopia de RMN de H1, C13 e F19). As experiências de tempo de relaxação “spin-lattice” (T1), coeficientes de difusão e efeito nuclear Overhauser foram combinadas para determinar as condições que favorecem a formação de pares-iónicos de longa duração de [BMIM][BF4] em água. Para este efeito, e utilizando os coeficientes de difusão de catiões e de aniões como sonda, diferentes composições de LI-água foram verificadas (a partir do LI puro até infinito de diluição) para encontrar as condições em que ambos catião e anião apresentassem coeficientes de difusão iguais (fração de água 8% a 298 K). Esta condição, bem como o LI puro e a diluição infinita foram, em seguida, ainda estudados através de RMN de relaxação de 13C, a fim de determinar os tempos de correlação (c) para o movimento de reorientação molecular, usando um procedimento matemático iterativo e dados experimentais obtidos num intervalo de temperatura entre os 273 e 353 K. O comportamento dos dados de difusão e relaxação obtidos nas nossas experiências apontam para os parâmetros combinados fracção molar de 8% e temperatura de 298 K como a condição mais favorável para a formação de pares-iónicos de longa duração.
Abstract
Spin-lattice Relaxation, self-Diffusion coefficients and Residual Dipolar Couplings (RDC’s) are the basis of well established Nuclear Magnetic Resonance techniques for the physicochemical study of small molecules (typically organic compounds and natural products with MW < 1000 Da), as they proved to be a powerful and complementary source of information about structural dynamic processes in solution. The work developed in this thesis consists in the application of the earlier-mentioned NMR techniques to explore, analyze and systematize patterns of the molecular dynamic behavior of selected small molecules in particular experimental conditions. Two systems were chosen to investigate molecular dynamic behavior by these techniques: the dynamics of ion-pair formation and ion interaction in ionic liquids (IL) and the dynamics of molecular reorientation when molecules are placed in oriented phases (alignment media).
The application of NMR spin-lattice relaxation and self-diffusion measurements was applied to study the rotational and translational molecular dynamics of the IL: 1-butyl-3-methylimidazolium tetrafluoroborate [BMIM][BF4]. The study of the cation-anion dynamics in neat and IL-water mixtures was systematically investigated by a combination of multinuclear NMR relaxation techniques with diffusion data (using by H1, C13 and F19 NMR spectroscopy). Spin-lattice relaxation time (T1), self-diffusion coefficients and nuclear Overhauser effect experiments were combined to determine the conditions that favor the formation of long lived [BMIM][BF4] ion-pairs in water. For this purpose and using the self-diffusion coefficients of cation and anion as a probe, different IL-water compositions were screened (from neat IL to infinite dilution) to find the conditions where both cation and anion present equal diffusion coefficients (8% water fraction at 25 ºC). This condition as well as the neat IL and the infinite dilution were then further studied by 13C NMR relaxation in order to determine correlation times (c) for the molecular reorientational motion using a mathematical iterative procedure and experimental data obtained in a temperature range between 273 and 353 K. The behavior of self-diffusion and relaxation data obtained in our experiments point at the combining parameters of molar fraction 8 % and temperature 298 K as the most favorable condition for the formation of long lived ion-pairs.
Table of Contents
Agradecimentos ...V Resumo ...VII Abstract ...IX Table of Contents ...XI Index of Figures ...XIII Abbreviations, Acronyms and Symbols ... XXI Objectives... XXIII
Chapter 1 - Introduction ... 1
1.1 – NMR Spectroscopy ... 1
1.2 – Motional Studies with NMR ... 2
1.2.1 – NMR Relaxation ... 4
1.2.2 – NMR Diffusion-Ordered Spectroscopy (DOSY) ... 14
1.3 – Configurational and Conformational Determination with NMR ... 16
Chapter 2 – Study of Ion-Pair Dynamics in BMIM-BF4 ... 19
2.1 – Introduction ... 19
2.1.1 – Ionic Liquids and Ion Pairing ... 19
2.1.2 – Ionic Liquids ... 19
2.1.3 – NMR Studies of ILs Structure and Dynamics... 20
2.2 – Experimental Section ... 27
2.2.1 – Materials ... 27
2.2.2 – NMR measurements ... 27
2.3 – Results and Discussion ... 29
2.3.1 – Translational Dynamics - BMIM-BF4 ... 29
2.3.2 – Rotational Dynamics - BMIM-BF4 ... 59
2.4 – Conclusions and Future Work ... 101
Chapter 3 – Exploring Diffusion in Alignment Media ... 103
3.1 – Introduction ... 103
3.1.1 – NMR Residual Dipolar Coupling (RDC) and Alignment Media ... 103
3.1.2 – Alignment Media ... 107
3.1.3 – Measurement Methods ... 114
3.1.4 – RDCs in Structure Determination ... 114
3.2 – Experimental Section ... 119
3.2.1 – Materials ... 119
3.2.2 – Poly(methyl methacrylate) (PMMA) Gel Preparation ... 119
3.2.4 – CpCl-Liquid Crystal Preparation ... 120
3.2.5 – Disodium Cromoglycate Preparation ... 121
3.2.6 – NMR experiments ... 121
3.3 – Results and Discussion ... 123
3.3.1 – Integrity, Characterization and Experimental Features of Alignment Media ... 123
3.3.2 – Diffusion in Alignment Media ... 135
3.3.3 – Conformation in Alignment Media ... 141
3.4 – Conclusion and Future Works ... 147
Chapter 4 – Conclusions and Future Perspectives ... 149
Annexes ... 151
A.1 – NMR Relaxation ... 151
A.1.1 - Relaxation Measurement Methods ... 151
A.1.2 – Diffusion-Ordered Measurement Methods ... 153
A.2 – NMR in alignment media ... 156
A.2.1 – NMR Direct Dipole-Dipole Coupling ... 156
A.2.2 - Measurement of RDCs ... 162
Index of Figures
Figure 1 – Representation of the most important NMR timescales. Reproduced from reference 4. ... 3
Figure 2 - The effects of motion time-scale on the nuclear spin dynamics. Reproduced from reference 4. ... 4
Figure 3 – Representation of the Zeeman effect in the energy states separation in NMR spectroscopy. ... 5
Figure 4 - Net magnetic moment on thermal equilibrium along the external magnetic field. ... 6
Figure 5 - Returning of the longitudinal magnetization. ... 6
Figure 6 - The build-up of longitudinal spin magnetization, after the magnetic field is turned on. Reproduced from reference4. ... 7
Figure 7 - The decay of longitudinal spin magnetization, after the magnetic field is turned off. Reproduced from reference 4. ... 8
Figure 8 - Precession of the transverse magnetization. ... 9
Figure 9 - Rotation of a spin around the y-axis. Reproduced from reference 4. ... 9
Figure 10 – Effect of different transverse relaxation processes on NMR signal aspect. ... 10
Figure 11 - Decay and oscillation of the transverse magnetization. Reproduced from reference 4. .... 11
Figure 12 – Representation of the local dipolar field by molecular motion.4 ... 12
Figure 13 - Representation of the chemical shift interaction by molecular rotation.4 ... 13
Figure 14 - Wobbling of the total local field.4 ... 13
Figure 15 – Representation of translational dislocation of different spins along a NMR tube. ... 15
Figure 16 –1H pulsed field gradient spin echo spectra (500 MHz) for a mixture of acetone, choline, DSS (2,2-dimethyl-2-silapentane-5-sulfonate sodium salt) in D2O.9 ... 15
Figure 17 - DOSY spectrum calculated from the data of figure 13.9 ... 16
Figure 18 - Nanoscopic structural organization of [BMIM][BF4] deduced from MD simulations. The relevant white square shows the ion-pair. The following colour code is used: H (white), C (light gray), N (light blue), F (goldenrod) and S (sulphur yellow).20 ... 21
Figure 19 - The electronic structure and numbering of the ring atoms in 1-alkyl-3-methylimidazolium ions.20 ... 22
Figure 21 - [BMIM][BF4] diffusion coefficient values for the total water molar fraction range from 0 (neat) to 93 %, exhibiting the exponential progression of the diffusion with increasing amount of water. ... 32 Figure 22 - [BMIM][BF4] diffusion flux values for the total water molar fraction range from 0 (neat) to
93 %, exhibiting, by the graphical differences to the previously represented figure 18, the
influence of the concentration in the diffusion coefficients. ... 33 Figure 23 - [BMIM][BF4] corrected diffusion Dion / Ddioxane values for the total water molar fraction range from 0 (neat) to 93 %, highlighting the relative diffusional evolution progression of the two ions in relation to the dioxane diffusion evolution and the diffusion coefficients cross-value at 8 %. ... 36 Figure 24 - [BMIM][BF4] hydrodynamic radius ratio (aion / adioxane) values for the total water molar
fraction range from 0 (neat) to 93 %, highlighting the relative diffusional evolution progression of the two ions in relation to the dioxane diffusion evolution and the diffusion coefficients cross-value at 8 %... 38 Figure 25 - Diffusion difference between ion species for the total water molar fraction range from 0
(neat) to 93 %, highlighting the ions diffusion coefficients detachment at approximately 20 %. .. 39 Figure 26 - Hydrodynamic radius calculation for the two ions for the total water molar fraction range.97
... 40 Figure 27 - [BMIM][BF4] neat diffusion coefficient values for the temperature variation range from 273
to 353 K, exhibiting the exponential progression of the two species diffusion with increasing temperature. ... 42 Figure 28 - [BMIM][BF4] neat apparent cationic transference number values for the temperature
variation range from 273 to 353 K, highlighting the progressive decreasing of the cation diffusion coefficient in relation to the total ionic diffusion coefficient (Dcation + Danion). ... 43 Figure 29 - [BMIM][BF4] neat activation energy calculation for the temperature variation range from
273 to 353 K, with 38.437 KJ/mol for the cation and 39.365 KJ/mol for the anion (R2 = 0.9918 for the cation and R2 = 0.9926 for the anion). ... 44 Figure 30 - [BMIM][BF4] neat diffusion flux values for the temperature variation range from 273 to 353
K, exhibiting, by the graphical similarity to the previously represented figure 23, the same
progression as the species diffusion coefficient... 45 Figure 31 - [BMIM][BF4] neat corrected diffusion values for the temperature variation range from 273
Figure 35 - [BMIM][BF4] ionic-pair activation energy calculation for the temperature variation range from 273 to 353 K, with 35.487 KJ/mol for the cation and 36.439 KJ/mol for the anion (R2 = 0.9944 for the cation and R2 = 0.9943 for the anion). ... 50 Figure 36 - [BMIM][BF4] ionic-pair diffusion flux values for the temperature variation range from 273 to
353 K, exhibiting, by the graphical similarity to the previously represented figure 28, the same progression as the species diffusion coefficient... 51 Figure 37 - [BMIM][BF4] ionic-pair corrected diffusion values for the temperature variation range from
273 to 353 K, highlighting the relative diffusional evolution progression of the two ions in relation to the dioxane diffusion evolution and the attachment of the two species diffusion during the temperature range from 293 to 303 K. ... 52 Figure 38 - [BMIM][BF4] ion-pair hydrodynamic radius ratio (aion / adioxane) values for the temperature
range from 273 to 353 K. ... 53 Figure 39 - [BMIM][BF4] infinite dilution diffusion coefficient values for the temperature variation range from 273 to 353 K, exhibiting the almost linear progression, from 273 to 343, of the two species diffusion, higher for the anion, with increasing temperature. ... 55 Figure 40 - [BMIM][BF4] infinite dilution apparent cationic transference number values for the
temperature variation range from 273 to 353 K, highlighting the oscillating progression of the cation diffusion coefficient in relation to the total ionic diffusion coefficient (Dcation + Danion). ... 56 Figure 41 - [BMIM][BF4] infinite dilution activation energy calculation for the temperature variation
range from 273 to 353 K, with 25.367 KJ/mol for the cation and 25.335 KJ/mol for the anion (R2 = 0.96 for the cation and R2 = 0.9486 for the anion). ... 57 Figure 42 - [BMIM][BF4] infinite dilution diffusion flux values for the temperature variation range from
273 to 353 K, exhibiting, by the graphical similarity to the previously represented figure 33, the same progression as the species diffusion coefficient. ... 57 Figure 43 - [BMIM][BF4] infinite dilution corrected diffusion values for the temperature variation range
from 273 to 353 K, highlighting the relative diffusional evolution progression of the two ions in relation to the dioxane diffusion evolution and the free-motion regime of the two species. ... 58 Figure 44 - [BMIM][BF4] infinite dilution hydrodynamic radius ratio (aion / adioxane) values for the
temperature range from 273 to 353 K. ... 59 Figure 45 - [BMIM]+ structure and numbering of the ion atoms. ... 60 Figure 46 - Dependence of T1 and T2 upon c, according to the simplified theory in which all
interactions are assumed to have the same correlation time.88 ... 65 Figure 47 - Experimental total spin-lattice relaxation time values for the neat IL of the 8 [BMIM]+
carbons for the temperature range 273 to 353 K, highlighting the extreme narrowing regime limit for the imidazolium ring carbons (C2, C4 and C5) at 283 K, associated with the minimum value. ... 66 Figure 48 - Experimental total spin-lattice relaxation rate values for the neat IL of the 8 [BMIM]+
Figure 49 - Calculated neat CSA spin-lattice relaxation rate values of the 8 [BMIM]+ carbons for the temperature range 273 to 353 K, highlighting its high contribution for the imidazolium ring carbons (C2, C4 and C5) total relaxation rate at lower temperatures. ... 69 Figure 50 - Calculated neat dipolar spin-lattice relaxation rate values of the 8 [BMIM]+ carbons for the
temperature range 273 to 353 K, highlighting the displacement of the imidazolium ring carbons (C2, C4 and C5) extreme narrowing regime limit from 283 to 313 K taking into account the total relaxation rate represented in figure 41. ... 70 Figure 51 - Experimental NOE factor values for neat IL of the 8 [BMIM]+ carbons for the temperature
range 273 to 353 K, highlighting the permanent increasing with increasing temperature. ... 72 Figure 52 - Calculated maximum NOE factor values for neat IL of the 8 [BMIM]+ carbons for the
temperature range 273 to 353 K, highlighting the complementary with the dipolar relaxation rate reasoned by the mathematical iterative process, presenting a minimum value at 313 K for the imidazolium ring carbons (C2, C4 and C5). ... 73 Figure 53 - Calculated correlation times (root1) values for neat IL of the 8 [BMIM]+ carbons for the
temperature range 273 to 353 K, highlighting the correspondence with the dipolar relaxation rate reasoned by the mathematical iterative process, presenting a maximum value at 313 K for the imidazolium ring carbons (C2, C4 and C5). ... 75 Figure 54 - Calculated correlation times (root2) values for neat IL of the 8 [BMIM]+ carbons for the
temperature range 273 to 353 K, highlighting the symmetric correspondence with the dipolar relaxation rate reasoned by the mathematical iterative process, presenting a relative minimum value at 313 K for the imidazolium ring carbons (C2, C4 and C5)... 77 Figure 55 - Calculated correlation times (simpler methodology) values for neat IL of the 8 [BMIM]+
carbons for the temperature variation range from 273 to 353 K, highlighting the correspondence with the total relaxation rate reasoned by the mathematical procedure utilized, presenting a maximum value at 283 K for the imidazolium ring carbons (C2, C4 and C5). ... 79 Figure 56 - Experimental total spin-lattice relaxation rate values for the ion-pair composition of the 8
[BMIM]+ carbons for the temperature range 273 to 353 K, highlighting the extreme narrowing regime limit for the imidazolium ring carbons (C2, C4 and C5) at 283 K, associated with the maximum value. ... 81 Figure 57 - Calculated CSA spin-lattice relaxation rate values for the ion-pair composition of the 8
[BMIM]+ carbons for the temperature range 273 to 353 K, highlighting its high contribution for the imidazolium ring carbons (C2, C4 and C5) total relaxation rate at lower temperatures. ... 82 Figure 58 - Calculated dipolar spin-lattice relaxation rate values for the ion-pair composition of the 8
Figure 61 - Calculated correlation times (root1) values for the ion-pair composition of the 8 [BMIM]+ carbons for the temperature range 273 to 353 K, highlighting the correspondence with the dipolar relaxation rate reasoned by the mathematical iterative process, presenting a relative minimum value at 293 K for the imidazolium ring carbons (C2, C4 and C5)... 87 Figure 62 - Calculated correlation times (root2) values for the ion-pair composition of the 8 [BMIM]+
carbons for the temperature range 273 to 353 K, highlighting the symmetric correspondence with the dipolar relaxation rate reasoned by the mathematical iterative process, presenting a relative maximum value at 293 K for the imidazolium ring carbons (C2, C4 and C5). ... 89 Figure 63 - Calculated correlation times (simpler methodology) values for the ion-pair composition of
the 8 [BMIM]+ carbons for the temperature range 273 to 353 K, highlighting the correspondence with the total relaxation rate reasoned by the mathematical procedure utilized, presenting a maximum value at 283 K for the imidazolium ring carbons (C2, C4 and C5). ... 90 Figure 64 - Total spin-lattice relaxation rate values for the infinite dilution sample of the 8 [BMIM]+
carbons for the temperature range 273 to 353 K, highlighting the progressive value decreasing associated with increasing molecular mobility. ... 92 Figure 65 - CSA spin-lattice relaxation rate values for the infinite dilution sample of the 8 [BMIM]+
carbons for the temperature range 273 to 353 K, highlighting its high contribution for the
imidazolium ring carbons (C2, C4 and C5) total relaxation rate at lower temperatures. ... 93 Figure 66 - Dipolar spin-lattice relaxation rate values for the infinite dilution sample of the 8 [BMIM]+
carbons for the temperature range 273 to 353 K, highlighting the almost permanent decreasing values, except for the relative maximum at 298 K that is caused by the mathematical relation with the experimental NOE values in the iterative process. ... 94 Figure 67 - Experimental NOE factor values for the infinite dilution sample of the 8 [BMIM]+ carbons
for the temperature range 273 to 353 K, highlighting the relative maximum observed at 298 K that also matches the calculated dipolar relaxation rate maximum. ... 95 Figure 68 - Calculated maximum NOE factor values for the infinite dilution sample of the 8 [BMIM]+
carbons for the temperature range 273 to 353 K, highlighting the complementary with the dipolar relaxation rate reasoned by the mathematical iterative process, presenting a relative minimum value at 298 K for the imidazolium ring carbons (C2, C4 and C5)... 96 Figure 69 - Calculated correlation times (root1) values for the infinite dilution sample of the 8 [BMIM]+
carbons for the temperature range 273 to 353 K, highlighting the correspondence with the dipolar relaxation rate reasoned by the mathematical iterative process, presenting a relative maximum value at 298 K for the imidazolium ring carbons (C2, C4 and C5)... 97 Figure 70 - Calculated correlation times (root2) values for the infinite dilution sample of the 8 [BMIM]+
carbons for the temperature range 273 to 353 K, highlighting the symmetric correspondence with the dipolar relaxation rate reasoned by the mathematical iterative process, presenting a relative minimum value at 298 K for the imidazolium ring carbons (C2, C4 and C5). ... 98 Figure 71 - Calculated correlation times (simpler methodology) values for the infinite dilution sample
of the 8 [BMIM]+ carbons for the temperature range 273 to 353 K, highlighting the
Figure 72 – The two cones covering the possible orientations of the vector connecting the spins I and S, which corresponds to one value of RDC for a given distance rIS. For one bond RDCs, this is equal to the possible orientations of the bond I-S.108 ... 104 Figure 73 – Idealized representation of the molecular arrangement in nematic liquid crystal phases.107
... 105 Figure 74 – Representation of the methodological process for the structure stereochemical acquisition using strain-induced alignment in a gel, namely PMMA.125 ... 105 Figure 75 – Representation of the differential ordering effect for two enantiomers dissolved in PBLG
liquid crystal phase.152 ... 107 Figure 76 – Representation of the SAG method by using cross-linked polymer gels. In the figure: at
left the dry gel into a 5mm-NMR sample tube; followed by the dry gel outside the tube; the swelled gel outside the tube; and the swelled gel into the tube. At right is placed a ruler showing the different length of the gels.167 ... 109 Figure 77 –Representation at left of a typical solid “liquid crystal” into a 5mm-NMR sample tube and
at right the lyotropic liquid crystal obtained after preparation ready for use as orienting media.167 ... 110 Figure 78 – Representation of the reversible gel compression/stretching experimental setup. At the
left (A) the gel is placed into the tube surrounded by solvent and with compression preventing vertical stretching; followed by (B) fitting of the gel on the tube walls due to swelling process; and finally (C and D) the regulation of vertical stretching using a Shigemi plunger allowing the
alignment degree selection, followed by 2H quadrupolar coupling splitting.162 ... 111 Figure 79 – Representation of 2H NMR spectra of a deuterated solvent illustrating the homogenization
process after liquid crystals preparation. From the top to the bottom is observed the central isotropic hump disappearing and the intensity increasing of the anisotropic phase signals.108.. 113 Figure 80 – Representation of cis and trans diastereoisomers of a dihydropyridone (bottom) and
and chair three dimensional structures of the 4,6-O-ethylidene-D-glucopyranose (top), indicating the possibility of solving the structures by distinction based on similarity of RDCs.108 ... 115 Figure 81 – Comparison of two different relations between Dcalc and Dobs using computational trial
structures. At left a good agreement between observed and calculated, and at right a worse agreement between the two.108 ... 116 Figure 82 –2H spectrum representation of a defective prepared PMMA gel, showing intense isotropic
Figure 85 – Representation of several 1H spectrums showing the effect of the successive washings with CDCl3 with stretching and compressing procedure. It is possible to observe the progressive decreasing of the MMA monomer polymerization signals, and the maintenance of the broad polymer signals. ... 129 Figure 86 – Representation of the structure of the cetylpyridinium chloride ion-pair... 130 Figure 87 – Representation of the CpCl/n-hexanol/brine micellar formation in lyotropic liquid crystal
solution. ... 130 Figure 88 - Representation of the CpCl/n-hexanol/brine lamellar formation in lyotropic liquid crystal
solution due to the presence of the external magnetic field. ... 131 Figure 89 –2H spectrums of different defective liquid crystal gels. ... 132 Figure 90 - 2H spectrums of the same liquid crystal before (top) and after (bottom) the addition of
substrate (glucose). ... 133 Figure 91 - Representation of the structure of the disodium cromoglycate ion-pair (DSGC). ... 134 Figure 92 – Representation of the alignment process of methyl--D-galactopyranoside in the cromolyn
oriented phase. ... 135 Figure 93 – Structure representation of the different substrates studied in the CpCl/n-hexanol/brine
alignment media. ... 136 Figure 94 – Representation of the logarithmic relation between the substrates diffusion coefficients
and the respective molecular weights in water. A linear regression is established with a R2 = 0.9841. ... 137 Figure 95 – Representation of a defective decay (of cellotetraose) in a CpCl/n-hexanol/brine liquid
crystal. ... 139 Figure 96 - Representation of effective decay (of BMIM+) in water. ... 140 Figure 97 – Representation of the exponential relation between the substrates diffusion coefficients
and the molecular weight in the two CpCl/n-hexanol/brine liquid crystal preparations (5 and 7.5 %). ... 140 Figure 98 - Representation of the logarithmic relation between the substrates diffusion coefficients
and the respective molecular weights in the two CpCl/n-hexanol/brine liquid crystal preparations (5 and 7.5 %). Two linear regressions are established with R2 = 0.9994 for 5 % and R2 = 0.9983 for 7.5 %. ... 141 Figure 99 – Representation of the relation between the quadrupolar splitting progression with the
temperature variation. ... 141 Figure 100 – Representation of sucrose numbering and expected conformation. ... 143 Figure 101 - Representation of -glucotetraose (G4G4G3G) numbering and expected conformation.
Figure 98 – Inversion-recovery spectra. ... 153
Figure 105 – Pulsed field gradient pulse sequence. ... 154
Figure 106 – No diffusion situation. ... 154
Figure 107 – Diffusion situation. ... 155
Figure 108 – Dipolar coupling.4 ... 156
Figure 109 – Internuclear spin vector.4 ... 157
Figure 110 – Polarized magnets.4 ... 158
Figure 111 – Many dipolar coupled spins.4 ... 158
Figure 112 – Energy diagram of eigenstates.4 ... 159
Figure 113 – Internuclear spin vector with respect to the external magnetic field.4 ... 160
Figure 114 – Sphere surface representation of the area element for orientations equal probability.4 161 Figure 115 – Parallel and perpendicular orientations.4 ... 161
Figure 116 – Dipolar coupling in liquid crystals... 162
Figure 127 – Representation of a HSQC spectra. a) ordinary decoupled; b) coupled in the direct dimension; c) coupled in the indirect dimension.167 ... 163
Abbreviations, Acronyms and Symbols
CSA Chemical Shift Anisotropy
B0 Magnetic field
CPMG Carl-Purcel-Meiboom-Gill
DC Dipolar Coupling
DD Dipolar Coupling
FID Free Inducing Decay
FT Fourier Transform
HSQC Heteronuclear Single Quantum Coherence
IL Ionic Liquid
INEPT Insensitive Nuclei Enhanced by Polarization
Transfer
LLC Lyotropic Liquid Crystal
NMR Nuclear Magnetic Resonance
PFG Pulsed Field Gradient
PFGSE Pulsed Field Gradient Spin Echo
QC Quadrupolar Coupling
RDC Residual Dipolar Coupling
RTIL Room-Temperature Ionic Liquid
SAG Strain Induced Alignment in a Gel
SM Small Molecules
SR Spin Rotation
T1 Longitudinal Relaxation
Objectives
The aim of this work is to explore the use of advanced NMR techniques to determine, analyze and systematize patterns of molecular dynamics of small molecules in solution. For this purpose two different systems have been chosen as study object to probe molecular dynamic processes such as translation, rotation and conformational variability: ionic liquids and alignment media (liquid crystals and gels). The systems were chosen due to their properties, both dynamical and spectroscopic, that make them suitable to better explore the spectroscopic technique elected (NMR spectroscopy).
The study is organized around three main objectives:
The study of the dynamics of ion-pairing for one ionic liquid, 1-buthyl-3-methyl imidazolium tetrafluoroborate, BMIMBF4: the neat IL and water mixtures were studied using for this purpose self-diffusion, spin-lattice relaxation (T1) and spin-spin relaxation (T2) measurements;
The characterization of different types of alignment media, used for the determination of residual dipolar couplings, namely liquid crystals and cross-linked polymer gels, associated with different solvents, namely water and chloroform;
The study of the relation between the alignment properties of the media and the translational properties of selected molecular standards (saccharides markers and aromatic markers) achieved by the determination of their diffusion coefficients in different alignment media and conditions;
Chapter 1 - Introduction
1.1
–
NMR Spectroscopy
Nuclear magnetic resonance spectroscopy (NMR spectroscopy), based on the discovery and development of Nuclear Magnetic Resonance1 by the end of 1930s-beginning of 1940s, consists in a powerful and widely recognized research technique that makes use of the interaction between nuclear spins (I ≠ 0) and electromagnetic radio frequency (RF) pulses to permit the “visualization” and consequent study of molecules at atomic scale (< angstrom)2,3; which process of development has been awarded with three Nobel prizes in physics (one in 1944 for Rabi, and two in 1952 for Bloch and Purcell) in the last century. In this way, as the research progressed, it became possible to determine physicochemical properties of the atoms and molecules, as well as detailed information about structure, dynamics, reactions state and chemical environment, making use of different NMR parameters and techniques governed by quantum theory.4
Historically Rabi, Purcell and Bloch observed that magnetic nuclei such as 1H, 13C and 31P could absorb RF energy when placed in a magnetic field when the RF was of a frequency specific to the identity of the nuclei. When this absorption occurs, the nucleus is described as being in resonance. Different atomic nuclei within a molecule resonate at different radio frequencies for the same magnetic field strength. The resonant frequency, energy of the absorption and the intensity of the signal are proportional to the magnetic field strength. Theoretically the possibility to distinguish between different “elements” (atomic nucleus) and regions of molecules arise from the fact that atoms and molecules are composed of electrons and these inevitably generate an electric and a magnetic field by their movement which will be different depending on the position in the molecule, causing that each has an individual frequency of resonance and thus giving access to the electronic structure of a molecule and frequently its identity.4
(including solutions and solids) and the acquiring of large amounts of information that couldn’t be done by other techniques and methodologies.4
A known disadvantage is related with the fact that NMR timescale is relatively long and thus it is not appropriate for observing fast phenomena, producing only an averaged spectrum. Another drawback of this spectroscopy is related with impurities, since NMR is inherently not very sensitive and so it is never assured the purity level.4
The NMR tools used in this work that allowed the verification and determination of the expected results were the spin-lattice relaxation time (T1), spin-spin relaxation time (T2), self-diffusion and the residual dipolar couplings (RDC’s). The relaxation and self-diffusion measurements to study molecular rotational and translational motions in solution are well established procedures. Measurement of dipolar couplings applied to small molecules (residual dipolar couplings), supported by the achievement of weak alignment media has emerged as a recent advance that allows the configurational and conformational study of these compounds in solution. The combination of these techniques gives a plethora of information that can be used to understand, characterize and systematize nearly all the molecular behaviour in solution.
1.2
–
Motional Studies with NMR
As have been uncovered previously, NMR spectroscopy represents nowadays a fairly understood and explored tool in the study of all kinds of molecules. Since its basic assumption is the multiple I ≠ 0 nuclei detection by the use of radiofrequencies, at the foreground infinitude of nuclei features may be considered to explore. Subsequently, since nucleus are included in complex and highly variable structures called molecules, another infinitude of added features may be regarded using NMR, justifying its great significance and wide application in modern science.4
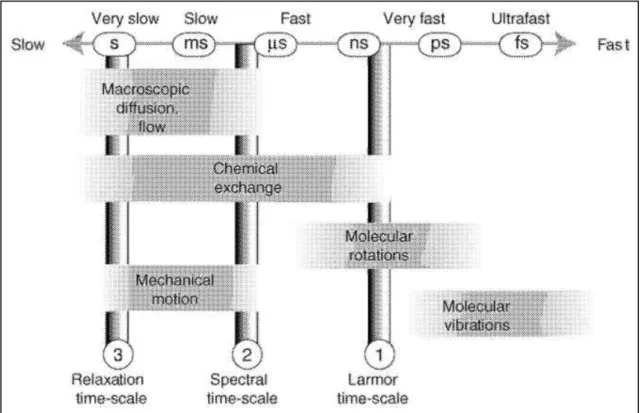
On the other hand, since motion occurs over time it only becomes a significant physicochemical property if it may be detected during this period. In that way, techniques and experiences had to be developed over the course of NMR evolution, based on the principle of detecting changes in the nuclear spin Hamiltonian, which enable the detection of different molecular motional effects that happen in distinct time-scale ranges. The range of time-scales that NMR spectroscopy is able to detect goes from the picoseconds (10-12 seconds) to several seconds (Figure 1). As can be imagined, different types of motion are associated with different time-scales, as for example: molecular rotation and microscopic diffusion (the two types of motion explored in this work) are detected normally (in liquids) in the range between several picoseconds to nanoseconds; while macroscopic diffusion, flow, mechanical motion and chemical exchange may be detected in the range of milliseconds to seconds (Figure 1).4
Figure 1 – Representation of the most important NMR timescales. Reproduced from reference 4.
are dependent of many conditions, such as the sample state, the isotope and physical parameters as the magnetic field and the temperature (Figure 1).4
to an isotropic situation. On contrary, in NMR the so-called thermal equilibrium corresponds to a situation where, in this case, the spin polarizations are distributed anisotropically along an external magnetic field.4
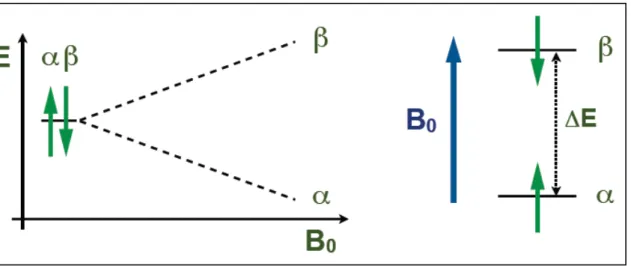
As pointed out earlier, relaxation consists in the time required for the recovery of spins to the thermal equilibrium position (Figure 4). This recovery, physically (in terms of spin states) corresponds to the imposed transition of spin population in the excited states (high energy, β) to the ground states (low energy, α) due to external magnetic field influence that holds a small difference between states, process which occurs in a very slow manner when comparing to other spectroscopic techniques (Figure 3).4
Figure 3 – Representation of the Zeeman effect in the energy states separation in NMR spectroscopy.
Figure 4 - Net magnetic moment on thermal equilibrium along the external magnetic field.
The two previously referred relaxation processes, namely lattice relaxation (T1) and spin-spin relaxation (T2), which in a simple way correspond to the longitudinal relaxation (relaxation in the z-axis) and to the transversal relaxation (relaxation in the x,y-plane), respectively, when considering the referential axis system where the external magnetic field is positioned along the z-axis, will be further introduced hereafter.4
1.2.1.1 - Longitudinal Relaxation Time (T1)
β) that holds a permanent small population difference between α and β. In NMR spectroscopy T1 is always associated with acquisition time, since it is the longest and slower event, being always superior or equal to T2.4
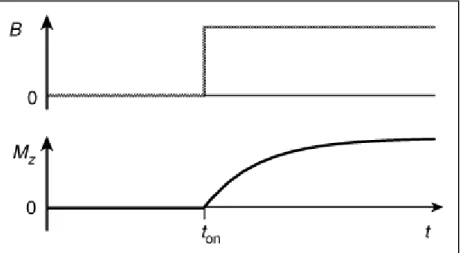
Considering now the building up process equation of the longitudinal magnetization, is given by equation 1:4
(1)
Mznuc is the anisotropic macroscopic nuclear magnetization pointing in z direction;
Meqnuc is the isotropic macroscopic nuclear magnetization;
T1 is the spin-lattice relaxation time;
t is the total time;
ton is the external magnetic field application moment.
In Figure 6 is possible to observe the common situation where the external magnetic field is turned on at ton and is verified the exponential progression of the build up curve of the anisotropic macroscopic nuclear magnetization (Mznuc), which relaxes coming from the isotropic state (Meqnuc).4
Figure 6 - The build-up of longitudinal spin magnetization, after the magnetic field is turned on. Reproduced from reference4.
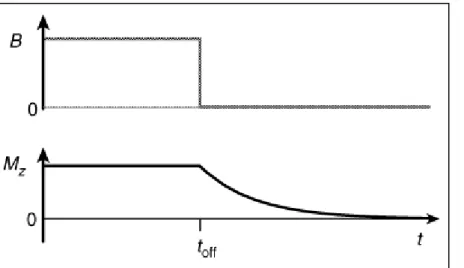
Considering now the decay process equation of the longitudinal magnetization, is given by equation 2:4
(2)
These two situations could be experienced and measured in a situation where first (Figure 6) it is inserted the sample on the NMR external magnetic field and later (Figure 7) the same is removed from the presence of the external magnetic field. 4
Figure 7 - The decay of longitudinal spin magnetization, after the magnetic field is turned off. Reproduced from reference 4.
As has already been uncovered, the characteristic longitudinal relaxation profile is influenced by many factores, among them viscosity and temperature, parameters that will be integral part of this work as it will be seen in Chapter 2 and 3. This relaxation process is normally comprehended in the time-scale between milliseconds to seconds, as also already referred, determining in this way the shortest possible time between NMR acquisitions.4
A description of the most common technique to measure T1 is presented in Annex 1.1.
1.2.1.2 - Transversal Relaxation Time Constant (T2)
Figure 8 - Precession of the transverse magnetization.
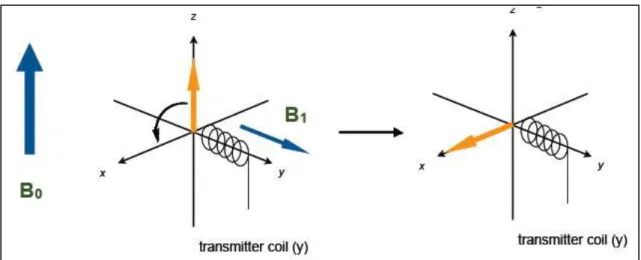
The magnetization rotation by /2 radians (Figure 9) from the z-axis to the x,y-plane is made through the application of a radiofrequency pulse (excitation), which orient the bulk magnetization in one major direction (x, y, -x or -y) by the physical principles of electric field rotation, consisting like the longitudinal magnetization in an imposed preferential orientation. Since this imposed preferential orientation is temporally restricted by spin dynamics, with time evolution is observed the loss of this bulk magnetization (Figure 8). This process of bulk magnetization loss with time corresponds to the so-called process of loss of phase coherence in the x,y-plane, which in turn corresponds to the transversal relaxation time (T2) (Figure 8). The bulk magnetization, or net magnetization, which has been represented in Figure 4, when placed in the x,y-plane corresponds to the transverse magnetization because of its perpendicular relation to the external magnetic field (Figure 8 and Figure 9).4
Figure 9 - Rotation of a spin around the y-axis. Reproduced from reference 4.
Figure 10 – Effect of different transverse relaxation processes on NMR signal aspect.
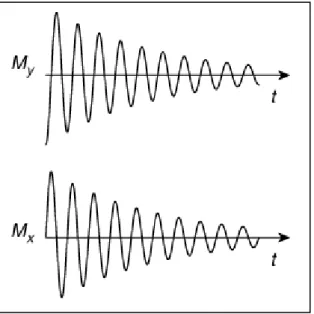
The transverse magnetization, which is composed by the several spin orientations that globally form a bulk directional magnetization in the x,y-plane, is known to be only effective during the RF pulse application time, and that subsequently spins relax transversely losing coherence. This transverse relaxation process, as represented in Figure 8, is gradually executed by the precessional motion of the bulk magnetization in both directions of the x,y-plane with time, consequence of the individual spins precession. Considering the precession of the individual spins that compose the bulk magnetization, it is known that its precession is performed at the nuclear Larmor frequency (ω0) (equation 3):4
(3)
Considering the bulk magnetization evolution during t after the /2 pulse on the different axes (x and y), is given by equations 5 and 6, respectively:4
systems and further, this transverse magnetization decay represents an irreversible process. In practice this process is observed in the NMR spectral acquisition and is explained by equation (4).4
Figure 11 - Decay and oscillation of the transverse magnetization. Reproduced from reference 4.
This transversal magnetization frequency dephasing process consists in a homogeneous process and in this way is called in NMR as homogeneous decay. Because it may possess many structural relevant information, as uncovered above, is crucial in NMR practice, namely in measuring spin-spin relaxation time T2 values.4
In liquid NMR samples of small molecules, T2 and T1 exhibit close relaxation time values, that in such cases is in the order of several seconds. This means that spins during this time execute, without losing synchrony, around tens of millions of Larmor precession cycles. However, in such a different situation as the macromolecular NMR or solid state NMR, the transverse relaxation time constant T2 comes to be as short as milliseconds.4
1.2.1.3 - Relaxation Mechanisms
As has been seen so far, relaxation plays a major role either in spin detection as in spin dynamics comprehension. It was uncovered earlier in this work the main features of the two types of nuclear spin relaxation, and has also been referred the importance and the possibility of studying by NMR the molecular dynamics, namely motion. It is crucial to refer that both are intrinsically connected in many ways. However, the relaxation mechanisms and its nature have not been explained and revealed yet.4
orientation, which in NMR is caused by RF pulses. Although it might seem a spontaneous process, relaxation of coupled spins implies many physical conditioning mechanisms, for example: dipolar coupling, chemical shift anisotropy, spin rotation and quadrupolar coupling in spins with I > ½.4
Dipolar coupling (Figure 12) consists in the through space interaction between two nucleus. This type of interaction is space dependent and increases with spins proximity, consisting in the predominant relaxation process of molecular spins (with I = ½) in liquid samples. Dipolar couplings may happen either by intramolecular via, when spins of the same molecule are coupled, or by intermolecular via, if spins of separated molecules are coupled. The source of relaxation in this case is related with the own magnetic field presented by each spin, which is consequence of nuclear electronic dynamic generated by orbiting electrons (Figure 12). Since each spin has its own magnetic field is logical to imagine that the interaction of two different spins, and consequently two different magnetic fields, will cause consequences in both spin states. However, not only the distance explains the relaxation phenomenon. Since dipolar couplings are also dependent on the angular relation with the magnetic field, and as is known already, because molecules are in permanent rotational motion in solution this factor will also contribute for the magnitude of the interaction.4
Figure 12 – Representation of the local dipolar field by molecular motion.4
Figure 13 - Representation of the chemical shift interaction by molecular rotation.4
When these local effects are considered in the interpretation of the external magnetic field effect, it is obtained that along the sample there are multiple magnetic field fluctuations (differences in value that change with time). These fluctuations are also related to another relaxation mechanism that consists in the spin rotation, which, as the previous two, is also related with molecular motion and consequently with spin dynamics. As molecule rotates the local magnetic field is influenced by circular motion of electrons, leading to changes in the magnitude of the same (Figure 14). Spin rotation has normally decreased importance, comparatively with CSA and dipolar coupling, with exception for small molecules in gases and non-viscous liquids.4
Figure 14 - Wobbling of the total local field.4
The normal order of relaxation processes for I = ½ is: first, the dipolar coupling; second, the CSA; and third the spin-rotation. Although this is the normal order, situations there are where one or more of these of these contributions are ineffective, leading to scale inversion.4
property i.e., dependent on the relative orientation, its magnitude will be greatly dependent on this factor. 4
In sum, it is possible to affirm that there are several relaxation mechanisms, also depending on the type of nuclei I, and these mechanisms are globally modulated by molecular reorientation or tumbling, since this motion is modulating orientation-dependent spin interaction energies. In this context, relaxation processes caused by orientation-dependent spin interaction energies over time may be visualized as the progressive summation of transitions between the nuclear spin states α and β. 4
1.2.2
–
NMR Diffusion-Ordered Spectroscopy (DOSY)
As have been already introduced, diffusion as one of the motional properties of molecules represents a significant dimension in molecular dynamics understanding. As also referred, NMR spectroscopy, differently to other spectroscopic techniques, has the ability of monitoring and study the molecular dynamics, including diffusion, through its multiple sequence possibilities and the already introduced relaxation phenomenon. The study of diffusion with NMR stills an actual and widely utilized method.
The study of diffusion with NMR has originated a technique, the so-called diffusion-ordered spectroscopy (DOSY), which through the use of pulsed field gradient spin echoes (PFGSE) or stimulated echo (STE) experiments is capable to provide diffusional data such as diffusion coefficients of individual signals in a spectrum that in this way become not just possible to determine translational motion but also to distinguish between signals of different compounds in a mixture. Although the practical application of PFGSE spectrum to analyse mixtures has appeared in 19816, the diffusion-ordered concept as technique have only been introduced in 19927.8,9
The NMR theoretical fundament of DOSY technique consists in the fact that supposedly diffusion acts as a contributor for the signal attenuation in spin echo measurements when this are performed in an inhomogeneous magnetic field. More specifically, the longitudinal spatial encoding along the sample associated with spins longitudinal dislocation (diffusion)(Figure 15) during spin echo experiments will inevitably lead to changes in signal phase and consequently to signal attenuation.8,9
Figure 15 – Representation of translational dislocation of different spins along a NMR tube.
The NMR practical fundament of DOSY technique consists in the acquisition of several spectral measurements using PFGSE, in which through the varying of the evolution time or of the gradient strength diffusion is observed as the attenuation (decay) of the signals (Figure 16). Diffusion coefficients are calculated by the fitting of the signal intensities as function of gradient pulse area (Figure 16).8,9
Figure 16 –1H pulsed field gradient spin echo spectra (500 MHz) for a mixture of acetone, choline, DSS (2,2-dimethyl-2-silapentane-5-sulfonate sodium salt) in D2O.9
using the previously determined chemical shift for each signal, diffusion coefficients calculated and a standard error that together allows the positioning a distribution of each signal corresponding diffusion in the new spectrum (Figure 17). Ideally, in such spectrum the signals corresponding to single specie appear in a horizontal line sharing the same diffusion coefficient, allowing the distinction between different species in solution (Figure 17). In any case, this technique is only fruitful when dealing with high resolution NMR spectroscopy, since without resolution in the chemical shift domain signals tend to overlap and no desired information is possible to achieve.8,9
Figure 17 - DOSY spectrum calculated from the data of figure 13.9
interactions COSY, TOCSY, HSQC and HMBC. For the determination of molecular three-dimensional arrangement the homonuclear dipolar coupling interactions NOESY and ROESY are normally employed.14
The use of 1H-1H and 1H-13C three-bond J couplings (3J) NMR data represents nowadays a widely used and consolidated way of studying molecular, mainly small molecules and natural products, relative stereochemistry and in some cases the major conformation in solution, such as for rigid molecules. Because of its inherent particularity, which is the detection of magnetization connecting through bond four sequential atoms, 3J values depend on the dihedral angle between these three bonds, uncovering subsequently part of the spatial arrangement of the molecule.15 In the analysis of 3J coupling constant of small molecules is nowadays widely used an empiric methodology16 based on the Karplus equation that includes several molecular parameters, including the electronegativity of the substituents.14
On the other hand, nuclear Overhauser effect (NOE), which pioneering application work dates from 1965,17 consists in one of the most significant and extensively employed NMR data given its ability of providing spatial and consequently also dynamic information, having in this way been used particularly in organic molecules configurational and conformational analysis. Nevertheless, NOE presents a major handicap that is its 1 / r6 dependence in certain cases, which represents a serious limitation on, for example, the information acquisition of the distance between remotely located protons.14
Chapter 2
–
Study of Ion-Pair Dynamics in BMIM-BF
42.1
–
Introduction
2.1.1
–
Ionic Liquids and Ion Pairing
As will be further developed, ionic liquids (ILs) represent a very important subject for science today, not just for fundamental physic,18 materials or chemistry,19,20 but also for industry21 and environment purposes.22
The physicochemical behavior (individual motion and aggregation) of ionic liquids, as neat or in solution, remains a mystic and widely discussed subject for many research groups.23–26 The classical concept of ion-pair existence for any kind of salt in solution, reasoned by the opposed charges attraction, seems pretty much changed and disturbed nowadays.27
As it will be seen forward in this thesis, one of the possibilities of the NMR spectroscopy is to execute different kind of motion research techniques2,6 which use relaxation as its basis, namely diffusion, inversion-recovery and spin-lock measurements. In this way, another main objective of this thesis is to do sufficient data acquisition through the previously referred techniques, and subsequent interpretation of the results so it is reasonable the discussion of the possible determination of ion-pairs in ionic liquids.
2.1.2
–
Ionic Liquids
In the last few years (since 90s) a great flush of research and development in ILs has began, leading to the establishment of wide range of applications in many distinct areas and purposes32, such as: analytical chemistry34–37, batteries and fuel cells18, electrochemical sensors and biosensors38, gas detection and electrosynthesis39, industrial chemistry21, materials (nano, porous, lubrificants)40, polymer science41, green solvents (in synthesis; catalysis; asymmetric synthesis; dissolution, depolymerization and functionalization of carbohydrates, halogenations, etc)42–58, supercritical fluid59, and so on; and further the related achievement of lots of spectroscopic information and computational predictions about ILs remarkable and particular physicochemical properties33, for: reactivity60,61, solubility62, solvation63, stability64, structural organization23–26, molecular dynamics19, fluorine-containing anions65, viscosity22, volatility and polarity66. Some recent studies indicate that some ILs are associated to certain levels of toxicity67, contradicting the former idea of pure green chemistry of this research area.
2.1.3
–
NMR Studies of ILs Structure and Dynamics
As previously introduced, ionic liquids characteristics consist nowadays in a wide spread and intense field of investigation, reasoned by its numerous possibilities. Justified by the impossibility of total experimental characterization of these substances family features, the spectroscopic route of determining molecular particularities and dynamics arises as fundamental tool, in order to achieve the sufficient understanding of it that allows rational design for different applications. Structure and dynamics presents to be some crucial features in this process.19
As also previously uncovered, NMR spectroscopic technique represents nowadays a solid and powerful experimental tool for this purpose, namely the structural and dynamics study of ILs. NMR spectroscopy by allowing the detection and dynamic evaluation of numerous nucleus, such as the spin-1/2 nucleus 1H, 13C, 15N or 19F, and even the quadrupolar (spin > 1/2) nucleus 2H, 11B, 14N or 35Cl, which frequently appear in ILs constitution and for this way represent an added value for information acquisition.20
common liquids and ILs, is that in the second is present a partial ordering caused by charge effects that consists in several types of interaction between the two ions, such as cation-cation, cation-anion and anion-anion, which may be observed by scattering data and MD simulations (Figure 18).68 Also differently from common liquids, charge-ordering in ILs extends over larger distances, positioning the ILs in terms of ordering between pure solids and pure liquids.20
One of the proposed features of such charge-ordering phenomena is the establishment of mesoscopic organization that results from the aggregation, in the nanometres scale, of hydrophilic and hydrophobic domains,69 which derive from polar heads of the cations mutual interaction and anion segregation from hydrophobic butyl chains. This in many ways observed nanoscopic order of ILs consists in its most curious structural feature, which conditions all of its properties and possible applications.20
Figure 18 - Nanoscopic structural organization of [BMIM][BF4] deduced from MD simulations. The
relevant white square shows the ion-pair. The following colour code is used: H (white), C (light gray), N (light blue), F (goldenrod) and S (sulphur yellow).20
Despite the fact that NMR spectroscopy experimental techniques, such as diffusion-ordered or relaxation, only allows the interpretation of local order insights, it was possible many times to interpret such results as charge-ordering effects and relate to the proposed formation of mesoscopic structures, namely by the spectral determination of H-bonds engaged in H-bonded networks. Although these assumptions are mainly speculative, it can be shown that local ion dynamics strongly suggest an aggregation process associated with structural motifs, which probably are engaged in building blocks that originates such mesoscopic organization.20
As earlier mentioned, one of major possibilities of the NMR application in ILs structural studies is related with the hydrogen bonding determination between ions. This feature appears in several interpretations of different NMR data parameters, such as in self-diffusion coefficients and relaxation times, the two tools employed in this study, and also in chemical shifts and nuclear Overhauser effects, which also take part of this work. In this NMR studies has been determined that expectedly the ability of donating H-bonds are mainly associated with the cation, while the anion normally acts as H-bond acceptor. The investigators belief consists that the H-bonding network formation leads ion-pairing and the establishment of aggregates and consequently mesoscopic structures.20
Even consisting in aprotic species, many IL cations present the possibility of establishing H-bonds with proton-accepting anions. One good example is the C-H∙∙∙anion bond of 1-alkyl-3-methylimidazolium salts. Comparing with other substances, such as the common molecular solvents, C-H bonds mainly represents no interest for H-bonding. On the other hand, in these aromatic imidazolium salt cations, a feature as the electronic structure gives rise to an acidic C-H bond at the position of carbon C2. In the aromatic ring, also the C4 and C5 carbons present a little acidic behaviour, inferior due to the structural positioning, since the acidity is related with the electro deficit in the two N-C-N bonds, as represented in the figure below (Figure 19). This C-H bonds acidity represents one crucial event for understanding the 1-alkyl-3-methylimidazolium cation ILs properties.20
Figure 19 - The electronic structure and numbering of the ring atoms in 1-alkyl-3-methylimidazolium ions.20
existence also includes the anionic nucleus, as for example the 35Cl.72 Nevertheless, this employed concept of H-bonding, at least for ILs, consists yet in a controversial subject.20
2.1.3.3 - Ion-Pairing
The previously introduced H-bonding particularity between the two ion species was a way to introduce a more important question that is the ion-pairing in the ILs. However, in neat systems in which ions are densely populated and cross-connected, the finding and attribution of ion-pairing consists in a difficult or even impossible task. Throughout time, different and dubious interpretations arisen for the explanation of ion-pairing with experimental results.20
One of the major evidences, related with conductivity studies, would be the existence of non-conducting ion stages consequent from the charge neutralization by the ion-pair formation. This fact is observed in experimental results that indicate lower electrical conductance by the ILs when compared with fully dissociated systems. A technique that has widely contributed for this question speculation has been the diffusion-ordered (DOSY) spectroscopy, which through the use of multinuclear PFGSE has provided valuable ionic diffusion coefficients that may be related with this ion-pairing problematic.7374–7677 The obtained results in this way have uncovered many other physicochemical phenomena related with structure and dynamics of the ions in different ILs.20
In any case, taking into account the mentioned studies is globally realized that the idealization of perfectly defined ion-pair verification may be unattainable. Even the verification of the main source of ion-pair investigation, which is the conductance reduction observation, has been impossible so far to determine the time-scale in which these events are happening. Suggestions mainly from MD simulations78 indicate nowadays that these cation-anion correlations only occur in the subpicosecond-to-picosecond time-scale, being in this way undetectable by spectroscopy methods so far. However, this scenario contradicts the intuitive picture of long-lived pairs, which are also supported by conductance behaviour.
Because NMR spectroscopy present limitations related with time-scale detection, other spectroscopic methods ranging different time-scales detection are necessarily considered. Experimental results on C-H vibrations coming from FT-IR spectroscopy indicates that ion-pair interactions may be observed at sub-picosecond time-scale.79 Other experimental results that come from dielectric relaxation spectroscopy indicates that no such interactions are detected above the nanosecond time-scale.80 Considering these results it is possible to conclude that the ion-pairing determination possibility only exists in the sub-picosecond time-scale, which, as already introduced, are time-scales out of the detection limits of NMR spectroscopy.20
However, no continuity has been given to these works recently, with exception of the intermolecular 1H-19F NOE study in BMIMBF4.87 The main reason the non-continuity with intermolecular NOE studies is related with the fact that to be observed a measurable intermolecular NOE the ion-pair needed to survive sufficient time to result in a notable probability for cross relaxation, condition that would imply that the process occurs at nanosecond time-scale. However, by the obtained NOE results it is proposed that contrary to the other previously referred spectroscopic data, the ion-pairs after all might be long enough to be detected.80
2.1.3.4 – Interactions Involving Aromatic Rings
The current perspective on the IL imidazolium aromatic rings-based cations suggests that the interactions between cations are established through three different mechanisms involving the ring, which are the ∙∙∙ stacking, the methyl∙∙∙ and the C2-H∙∙∙interactions in staggered spatial dispositions. The same principles may be applied to anions that present aromatic rings in its constitution. These interactions are mainly predicted by ILs crystal structures, taking into consideration that at least part of these structural patterns remains equal either in solids as in liquids.23 It was also possible by NMR 1H-1H NOESY to determine close cation-cation encounters by two different ring interactions, which are the ring stacking and T-shaped ring.81 However, in a subsequent NMR 1H-19F NOE study, in the same salt (BMIMBF4), have not been determined such interactions existence, uncovering the problems that may be found when using NOE data in structural interpretation.82
2.1.3.5 – Translational Dynamics
of diffusion and conductance data have been possible the characterization over eight orders of magnitude, from microscopic to macroscopic range.90
2.1.3.6 – Rotational Dynamics
Along with the increasing interest in translational dynamic motion of ILs, has emerged the increasing interest also on the reorientational dynamic motion, resulting mainly from the spin-lattice relaxation times T1 measurement. In this way, NMR, differently to other spectroscopic methods, offers the possibility specific-site reorientational studies through its numerous experiments, namely using different nucleus and/or different peak signals results.91
The possibility of studying molecular reorientation in solution NMR is related with the connection of the previously described relaxation times, which are experimental acquired, with the desired reorentational motion of the particles that is given through the calculation of rotational correlation times (c). Besides providing rotational motion, 13C NMR relaxation methods can also give insight on molecular interactions, becoming in this way so important in the present study of ILs.91
Considering now the large range of molecular motion, two extreme behaviours may be identified: one that corresponds to the fast molecular motion, and another that corresponds to slow molecular motion. The distinction between the two regimes is highlighted by the previously referred rotational correlation times (c), in which for slow molecular motion this parameter is typically in the range between nanoseconds to milliseconds, and for fast molecular motion this parameter is typically in the range between picoseconds to nanoseconds. The two regimes are traditionally designated as being “within the extreme narrowing region”, for the fast molecular motion, or on the other hand being “outside the extreme narrowing region”, for the slow molecular motion. This concept is normally employed to differentiate between small sized or non-viscous molecular rotation in solution, and high sized or viscous molecular rotation in solution.4,83 The rotational correlation time is normally thought of as being the time required for a nucleus to rotate an angle of one radian.4,84
purpose of separating the contribution of the two major relaxation mechanisms (dipolar and CSA) from the overall relaxation, an iterative mathematical approach combining several correlation functions has been devised.84
In this thesis such algorithm is explained in a stepwise manner in the experimental section of this chapter.84
2.1.3.7 – IL/Water Mixture Studies
As already introduced, ILs are thought to present many degrees of mesoscopic domains in solution. These mesoscopic domains, as already uncovered, are known to present a major role in ILs dynamics and properties, namely in the complex solvation dynamics. In this way, after the existence of cluster entities was first suggested,75 numerous experimental evidences were collected for structural heterogeneities that are verified over the scale of a few nanometres. As an example, these structural heterogeneities of IL/water mixtures have been recently investigated in BMIM-BF4/water compositions.85 Globally, have been possible to determine a correlation between the formation of water clusters and the already mentioned ILs organization into polar networks with hydrophobic tails segregation. With the increasing addition of water, ion-pair interactions are progressively broken, causing in this way the weakening of such structural organization.86 On the other hand, considering that segregation of the tails depend on the hydrophobic degree of the carbon chains, it is logical to suppose that segregation will progressively decrease as the chains polarity increases.69 Nevertheless, some questions afterwards appeared in relation to the really existence of such structural heterogeneities.87


![Figure 21 - [BMIM][BF 4 ] diffusion coefficient values for the total water molar fraction range from 0 (neat) to 93 %, exhibiting the exponential progression of the diffusion with increasing amount of water](https://thumb-eu.123doks.com/thumbv2/123dok_br/16489470.733092/56.892.112.779.120.412/diffusion-coefficient-fraction-exhibiting-exponential-progression-diffusion-increasing.webp)
![Figure 34 - [BMIM][BF 4 ] ionic-pair apparent cationic transference number values for the temperature variation range from 273 to 353 K, highlighting the progressive decreasing of the cation diffusion coefficient in relation](https://thumb-eu.123doks.com/thumbv2/123dok_br/16489470.733092/73.892.112.777.240.560/transference-temperature-variation-highlighting-progressive-decreasing-diffusion-coefficient.webp)
