Série Zoologia
Fundação Zoobotânica do Rio Grande do Sul Museu de Ciências Naturais
www.scielo.br/isz e-ISSN 1678-4766
Iheringia
Iheringia
Bird diversity in an urban ecosystem: the role of local habitats
in understanding the effects of urbanization
Aline Goulart Rodrigues
1 https://orcid.org/0000-0003-0759-0464Márcio Borges-Martins
2 https://orcid.org/0000-0001-9328-5794Felipe Zilio
3,* https://orcid.org/0000-0003-2207-93301. Curso de Ciências Biológicas, Universidade Federal do Rio Grande do Sul, Porto Alegre, RS, Brasil. ([email protected])
2.Laboratóriode Herpetologia, Departamento de Zoologia, Programa de Pós-Gradução em Biologia Animal, Universidade Federal do Rio Grande do Sul, Porto Alegre, RS, Brasil. ([email protected])
3. Setor de Ornitologia. Seção de Zoologia de Vertebrados, Museu de Ciências Naturais, Fundação Zoobotânica do Rio Grande do Sul, Porto Alegre, RS, Brasil. ([email protected])
*Corresponding author: Universidade Federal de Viçosa (UFV) – Campus Rio Paranaíba, Rodovia MG-230, km 8, s/n, Caixa Postal 22 , 38810-000, Rio Paranaíba, MG, Brasil. E-mail: [email protected]
Received 11 November 2016 Accepted 8 April 2018 Published 11 June 2018 DOI 10.1590/1678-4766e2018017
ABSTRACT. Urbanization causes environment changes that directly affect biotic diversity, and understanding the relationship between fauna and urban
features is a key aspect of urban planning. Birds are particularly affected by urbanization. Noise levels, for instance, negatively affect birds’ behavior and social communication, while the presence of green areas promotes bird diversity. The effects of urbanization could differ according with the level of urbanization, and our goal was to understand how bird species assemblages are related to urban features in an intermediate stage of urbanization (a city in Brazil with 2,470 inhabitants/km²). We used canonical correspondence analysis (CCA) and generalized linear models (GLM) analyses to assess how bird species assemblages are affected by urban features (e.g., noise level, abundance of buildings) as well as habitat features (e.g., vegetation cover). Despite we did not find a clear pattern of urbanization both the urban and habitat features had, even if weak, an effect on bird species distribution. Bird species distribution was spatially correlated, and we identified three groups: 1) grassland and wetland species; 2) forest species; 3) species tolerant to habitat degradation. Species richness was positively related to the proportion of trees, abundance of people and presence of buildings, and negatively affected by higher levels of noise. The abundance of species decreased as noise levels increased, but the proportion of green areas (open or forest vegetation) had a positive effect. Agreeing with previous research, our study shows that noise levels and vegetation cover seem to be the best predictors of diversity in urban areas. Nevertheless, the presence of particular habitats (wetlands, grasslands, woodlots), patchily distributed in the urban matrix, could buffer the effects of urbanization on birds. These habitats should thus be taken into account in urban planning.
KEYWORDS. Neotropic, urban noise, green spaces, species richness, bird assemblage.
RESUMO. Diversidade de aves em um ecossistema urbano: o papel dos habitat locais na compreensão dos efeitos da urbanização. A urbanização
resulta em alterações no ambiente que afetam diretamente a diversidade biótica, sendo fundamental a compreensão das relações entre a fauna e as características do ambiente urbano para o planejamento de uma cidade. O ruído, por exemplo, é uma característica do ambiente urbano que afeta negativamente o comportamento e comunicação social das aves, enquanto a presença de áreas verdes promove a diversidade. Os efeitos da urbanização sobre a fauna podem variar conforme o estágio de desenvolvimento urbano, assim, nosso objetivo foi analisar a distribuição da avifauna em uma área com estágio intermediário de urbanização (uma cidade brasileira com 2.470 habitantes/km²) e sua relação com a paisagem urbana. Nós realizamos uma análise de Correspondência Canônica (CCA) e Modelos Lineares Generalizados (GLM) para avaliar como a avifauna é afetada pelos componentes da paisagem urbana (e.g., nível de ruído, número de construções, cobertura vegetal). Apesar de não termos encontrado um padrão claro de urbanização, tanto
as características urbanas quanto as de habitat tiveram, mesmo que de forma branda, um efeito sobre a distribuição de espécies de aves. A distribuição das espécies foi espacialmente correlacionada, formando três grandes grupos: 1) espécies associadas aos ambientes campestres e úmidos; 2) espécies florestais; 3) espécies tolerantes aos ambientes degradados. A riqueza de espécies foi positivamente relacionada à proporção de árvores, à abundância de pessoas e à presença de prédios, porém teve efeito negativo com o aumento do nível de ruído. Áreas com maior nível de ruído apresentaram menor abundância de aves, enquanto as maiores abundâncias estiveram positivamente associadas à proporção de áreas verdes (vegetação campestre ou florestal). Nossos resultados concordam com estudos prévios que sugerem que o nível de ruído e a cobertura vegetal são as variáveis mais relevantes relacionadas à diversidade de aves em áreas urbanas. Contudo, a presença de habitat específicos (banhados, campos, matas), imersos na matriz urbana, poderiam amortizar os efeitos da urbanização sobre as aves, e estes deveriam ser considerados quando avaliado o planejamento urbano das cidades.
Urban ecosystems are complex, heterogenic and
dynamic, characterized mainly by dense agglomerations of
people living in the same place. The urbanization process
involves changes in the landscape, soil modifications, climate
changes, and biodiversity loss, resulting in a new, distinct
ecosystem (Pickett
et al
., 2011). City growth changes
the landscape – destroying natural habitats and creating
new ones – and native species are replaced by a pool of
a few species adapted to the urban environment (urban
exploiters), promoting biotic homogenization (Blair, 1996,
2004; Rolando
et al
., 1997; Clergeau
et al
., 1998; Tait
et al
., 2005; Chace
&
Walsh, 2006; McKinney, 2006;
Evans
et al.
, 2009; Pickett
et al
., 2011; Aronson
et al
.,
2014; Puga-Caballero
et al
., 2014; Beninde
et al.
, 2015;
Dallimer
et al
., 2015). However, cities are not homogeneous
environments, but rather have zoning according to the type
of activity in or usage given to certain areas (parks, industrial
zone, residential zone). Thus, in urban areas, bird species
distribution is both related to the local habitat features (tree
and shrub cover, density of houses and other buildings)
and the degree of urbanization of the city (Rolando
et al.
,
1997; Evans
et al.
, 2009; Pickett
et al.
, 2011; Fontana
et
al.
,
2011; Ortega-Álvarez
&
MacGregor-Fors, 2011;
Aronson
et al.
, 2014).
The availability of green areas and the level of noise
are two of the most important features affecting urban avian
species assemblages (Chace
&
Walsh, 2006; Evans
et al
.,
2009; Fontana
et al
., 2011; Toledo
et al
., 2012; Njoroge
et al
., 2013, Beninde
et al
., 2015; Sacco
et al
., 2015).
High bird diversity in urban landscapes has been associated
with high densities of trees and the presence of large green
spaces connected or near to each other (
i.e.
, not fragmented,
but connected by corridors or acting as stepping stones)
(Evans
et al
., 2009; Aronson
et al
., 2014, Beninde
et al
.,
2015). High densities of human dwellings – and people –
and high levels of noise are associated with lower levels of
bird diversity (Evans
et al
., 2009; Fontana
et al.
,
2011), but
higher bird abundances (Evans
et al
., 2009). This pattern of
continuous decline of diversity and increase in abundance is
exhibited along the rural-urban gradient (Blair, 1996; Chace
&
Walsh, 2006; McKinney, 2006; Puga-Caballero
et al
.,
2014; Bino
et al
., 2008; Ortega-Álvarez
&
MacGregor-Fors, 2011), although diversity could peak at intermediate
levels of disturbance, as in peri-urban areas (Blair, 1996,
2004; Tratalos
et al
., 2007).
Birds’ responses to living in urban centers and the
effects of disturbance in these areas have been studied for
decades in the northern hemisphere (
e.g.
, Marzluff
et al
.,
2001; Chace
&
Walsh, 2006; Evans
et al.
, 2009; Pickett
et
al.
, 2011; Davis
et al.
, 2012; Taylor
et al.
, 2013; Aronson
et al.
, 2014; Sol
et al
., 2014; Beninde
et al.
, 2015), but
are a relatively new research focus in South America (
e.g.
,
F
ontana
et al
.,
2011; Ortega-Álvarez
&
MacGregor-Fors, 2011; Toledo
et al
., 2012; Njoroge
et al
., 2013;
Puga-Caballero
et al
., 2014; Leveau
et al
., 2015; Sacco
et
al
., 2015). Although urban species assemblages in South and
North America show similar patterns, still there are several
gaps to be filled (
e.g.
, demographic patterns, physiological
responses, behavioral ecology, biotic homogenization;
Ortega-Álvarez
&
MacGregor-Fors, 2011). Our goal
was to evaluate how urbanization affects the bird species
assemblage (species richness and abundance) of a
medium-sized city in southern Brazil. We use features of the urban
landscape to test the predictions that (1) the degree of
urbanization affects bird species distribution, and intensely
urbanized areas have lower species richness and higher
species abundance than less urbanized areas; (2) both species
richness and abundance diminished in proportion to noise
level; (3) vegetation is an important component of the
urban landscape for birds, and bird diversity will increase
in proportion to the area of green space in the city (parks,
gardens, orchards).
METHODS
Study area.
Canoas (29°55’12”S, 51°10’48”W) is
part of the metropolitan area of Porto Alegre (the capital and
largest city of the state of Rio Grande do Sul, Brazil) known
as Greater Porto Alegre. Built in the Depressão Central
region (Central valley) on the Guaiba river basin, Canoas
is bordered by the dos Sinos and Gravataí rivers, and is in
the transition zone between Planície Costeira (Coastal Plain)
and the Planalto Meridional (Meridional Plateau) (www.
canoas.rs.gov.br). Climate is temperate (
Cfa
;
Köppen, 1918),
with a hot and humid summer. In the Bioma Pampa, which
spreads over 63% of Rio Grande do Sul political territory,
the municipality territory is classified as region of ecological
tension, where grass, shrub and wetlands are predominant
in surrounding areas of the urban zone. Currently Canoas
has no rural areas and the population of 323,827 inhabitants
is settled in an area of 131.1 km² (demography of 2,470.13
inhabitants/km²; IBGE, 2010). The city grew in a disordered
way, scattered in patches of neighborhoods and villages that
were settled in marshy and flooded areas. Industry had large
impact on the city demography, as well as the local economy
(Mayer, 2009). Despite the level of urbanization, Canoas
has 16.2 m² of green areas per capita, making a total of 5.49
km² in the city (Estado da Cidade, 2014).
Sampling design.
We randomly selected, 120 sites
based on 60 maps of the municipality of Canoas (www.geo.
canoas.rs.gov.br). Each map covers a 1.1 km² area, divided in
20 quadrants of 0.4 km². We randomly selected two quadrants
on each map and established one sample unit in the center
of each quadrant. Sample units were required to be a public
area (
i.e.
, street, sidewalk, square) and were moved to the
public location nearest the chosen center if necessary. Sample
units were at least 200 m apart to guarantee independence
between sampling units (Ralph
et al
., 1993). We used this
In each sample unit (50 m radius from a central point),
we measured the following variables related to the degree of
urbanization (descriptions of each variable are in Tab. I): 1)
Noise; 2) density of ‘Trees’; 3) density of ‘People’; 4) density
of ‘Pets’. We measured the percentage of ‘Vegetation cover’
and ‘Grass’ (open areas: grassland, gardens; Tab. I) – using
satellite images provided by Google Pro (for Canoas, the
images with the best available resolution were dated from
January/2009 to December/2013). We also measured the
abundance of buildings in each sample (number of ‘Houses’,
‘Buildings’, ‘Pavilions’, and ‘Other structures’; all but houses
later transformed into categorical variables; Tab. I).
We carried out bird surveys in September 2013, at
the beginning of the breeding season. We conducted 10-min
point-count surveys using a 50m fixed radius (Ralph
et al
.,
1993), starting at dawn and lasting for 4 h (until 10:00 AM).
We recorded all birds seen or heard, except birds flying
above 20 m over the area, which we ignored in order to
avoid double-counting during the census (annotated as an
occasional record to compose the list of birds of Canoas).
Tab. I.Explanatory variables (Ca, categorical; Co, continuous) measured on each sample unit in the urban area of Canoas, Rio Grande do Sul, Brazil.
Variables Class Description
Houses Co Number of houses
Buildings Ca, binary Number of buildings with more than two floors
Pavilions Ca, binary Number of large horizontal buildings typically for industrial purposes
Other structures Ca, binary Number of buildings with low flow of people (supermarkets, sports facilities, parking lots) People Co Number of persons passing by or standing at the point-count area
Pets Co Number of pets observed on the point-count area
Vegetation cover Co Percent of the sample unit covered by trees (aerial image)
Trees Co Number of trees higher than 3 m
Grass Co Percent of the sample unit covered by open areas (grassland, gardens)
Data analysis.
We first constructed three matrices:
1) species abundance (number of individuals per
point-count); 2) variables indicating the urban gradient (eight
non-collinear variables); and 3) a spatial matrix with the
geographical coordinates of each point-count (latitude and
longitude). To avoid multi-collinearity, we selected only
variables with Spearman correlation index below |0.6|: we
excluded ‘Traffic’ and ‘Pets’ from the analyses and instead
used the correlated variables ‘Houses’ (rho = 0.63) and
‘Noise’ (rho = 0.75). After the first investigation of data
we eliminated two samples. These samples were outliers
because they were located in an open, not urbanized area,
where the major source of disturbance was traffic noise from
the highway BR-386.
We tested the spatial correlation between species
distribution and urban variables using a Mantel test
(Legendre
&
Legendre, 1998), performed with R (R
Development Core Team, 2015) using
vegan
package
(Oksanen
et al
., 2015). The Spearman rho was used as
the correlation coefficient. We used 9999 iterations with
permutations of the matrix elements to calculate the P value
for the test statistic, assuming no correlation between matrices
as null hypothesis. The species distribution was spatially
correlated (P = 0.01), so we performed a partial Mantel test
to evaluate the correlation between species abundance and
urban variables, weighting the spatial correlation.
To analyze the relationships between bird species
assemblage and the urban variables, we performed a canonical
correspondence analysis (CCA) (Legendre
&
Legendre,
1998) using on CANOCO v4.5 (Ter Braak
&
Šmilauer,
2002). Variables were centralized and standardized and the
rare species were down-weighted to minimize their individual
effects. To test the correlation between species abundance
and urban variables, we used a Monte Carlo test with 9999
unrestricted permutations, assuming no correlation as the
null hypothesis (Ter Braak
&
Šmilauer, 2002).
Finally, we used generalized linear models (GLM)
to evaluate how urbanization affected bird species richness
and abundance. To model species richness, we used the
residuals of the linear regression of these variables as
the response variable and also used Gaussian error and
identity function. Because species richness is correlated
with abundance (because more birds are detected as
richness increased), we used the residuals as surrogate of
species richness. To model the abundance (logarithmically
transformed) we used the number of individuals in each
point-count as the response variable, and used Gaussian
error and identity function. We started by including eight
variables as predictors in each model, and searched for
the best subset using a backward stepwise procedure. We
used second-order Akaike’s Information Criterion (AICc)
to select competing models, assuming that models with
∆AICc ≤ 2 explain the data equally well. We performed
the GLMs with R (R Development Core Team, 2015),
using the
MuMIn
package (Barton, 2014) to build and
select models.
RESULTS
We recorded 2,897 individuals from 100 bird species
(13 only recorded occasionally, outside the point-count area)
and 38 families (Appendix 1). Most of these species inhabit
open habitats (grassland, shrublands and open areas; 46%),
and are omnivorous (36%) (Appendix 1). Sites outside the
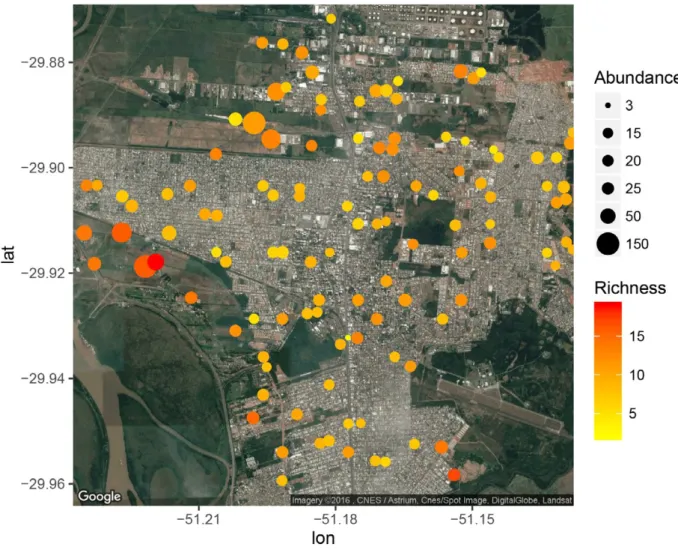
urban core had more species richness and abundance (Fig. 1).
These are dominated by grass and wetlands, where large
flocks of Shiny cowbird [
Molothrus bonariensis
(Gmelin,
1789); 85 individuals] and
Bare-faced ibis [
Phimosus
infuscatus
(Lichtenstein, 1823); 90 individuals], for instance,
were recorded.
Bird species distribution were spatially correlated
(Mantel test, p < 0.01), while urban variables were not
(Mantel test, p = 0.98). Species assemblages, in turn, were
not correlated with urban variables (partial Mantel test, p
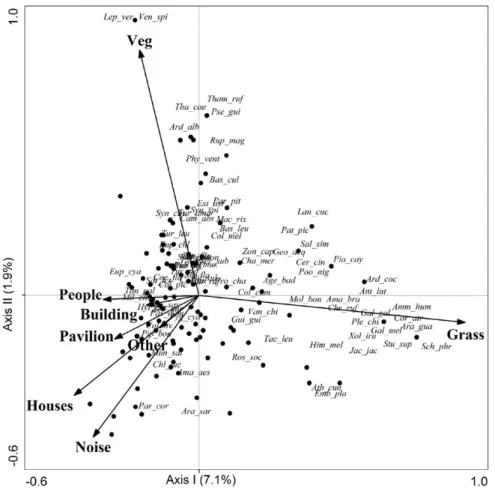
= 0.25). The canonical axes of CCA, despite significance
(p < 0.01) and the average correlation between species and
environmental variables (Pearson correlation, axis I = 0.75,
axis II = 0.66), explained only 13% of variability in the
data (axis I = 7.1%, axis II= 1.9%). Notwithstanding, CCA
separated more-urbanized areas from those that were less
urbanized, the latter having a larger proportion of open
vegetation cover (grass and wetlands) (left to right on
axis I) and wooded areas, with greater vegetation cover
(distinguished from other variables on axis II) (Fig. 2).
Synanthropic and/or exotic species [
e.g.
House sparrow
Passer domesticus
(Linnaeus, 1758), Rock dove (
Columba
livia
Gmelin, 1789), Blue-and-white swallow
Pygochelidon
cyanoleuca
(Vieillot, 1817)] were recorded more frequently
in more urbanized sites, characterized by higher densities of
people and houses; the presence of buildings, pavilions and
other structures; and higher levels of noise. Sites with greater
proportions of open vegetation, lower levels of noise, and
an absence or lower frequency of urban structures (house,
buildings) were dominated by wetland species [
e.g.
,
White-browed meadowlark
Sturnella superciliaris
(Bonaparte,
1850), White-faced ibis
Plegadis chihi
(Vieillot, 1817)
and Chestnut-capped blackbird
Chrysomus ruficapillus
(Vieillot, 1819)], and grass/shrubland species [
e.g.
, White
monjita
Xolmis irupero
(Vieillot, 1823),
Shiny cowbird].
Forested species, such as Variable antshrike (
Thamnophilus
caerulescens
Vieillot, 1816)
and
Golden-crowned warble
[
Basileuterus culicivorus
(Deppe, 1830)] were present and
more abundant in sites with a greater abundance of vegetation
cover (percentage cover and number of trees).
Fig. 2. Ordination diagram presenting the first two axes of the Canonical Correspondence Analysis (CCA) (percent of explained variability: axis I = 7.1%, axis II = 1.9%) based on the distribution of species abundance in 118 sample units (dots) in the urban area of Canoas, Rio Grande do Sul, Brazil, and its correlation with seven explanatory variables (arrows). The first axis shows the urbanization gradient (negatives values on left = more urbanized regions; positive values on right = less urbanized regions). All axes were significant (Monte Carlo test with 9,999 permutations: P < 0.001). Species names are given in full in Appendix 1. Variables are described in Tab. I.
Tab. II.Competing models (∆AICc < 2) for the influence of environmental variables in bird species richness (considering the residual of the linear regression of bird species richness and abundance). Variables with negative coefficients are indicated by a minus sign within the brackets. Variables retained in the best candidate model are in bold (df, degrees of freedom; AICc, corrected Akaike’s Information Criterion; ∆AICc, difference in AICc between the current model and the best model; w, Akaike weights).
Modelo df AICc ∆AICc Weight
(-Houses)+(-Noise)+Vegetation 5 531.21 0.00 0.46
(-Houses)+(-Noise)+Vegetation+People 6 532.84 1.63 0.20
(-Houses)+(-Noise)+Vegetation+(-Other) 6 533.17 1.96 0.17
(-Houses)+(-Noise)+Vegetation+Buildings 6 533.19 1.97 0.17
Tab. III.Competing models (∆AICc < 2) for the influence of environmental variables in bird species abundances. Variables with negative coefficients are indicated by a minus sign within the brackets. Variables retained in the best candidate model are in bold (df, degrees of freedom; AICc, corrected Akaike’s Information Criterion; ∆AICc, difference on AICc between the current model and the best model; w, Akaike weights).
Modelo df AICc ∆AICc Weight
Grass+(-Noise) 4 155.83 0.00 0.29
Grass 3 156.95 1.12 0.17
Grass+(-Noise)+(-Houses) 5 157.22 1.39 0.15
Grass+(-Noise)+Pavilions 5 157.35 1.52 0.14
Grass+(-Noise)+(-Buildings) 5 157.43 1.60 0.13
levels, abundance of houses and presence of other structures
have low species richness. We selected six models for analysis
of species abundance (Tab. III). Species abundance decreased
as noise levels increased (noise level was selected in all
models), and also decreased with the abundance of houses
and presence of buildings. The proportion of vegetation cover
(both open and arboreal) in a site had a positive effect on
bird abundance (as we can see in Fig. 1), as did the presence
of pavilions.
DISCUSSION
Our results suggest that the city of Canoas has a
rural-urban gradient similar to those of other rural-urban centers (Blair,
1996; Chace
&
Walsh, 2006; McKinney, 2006; Bino
et al
.,
2008; Ortega-Álvarez
&
MacGregor-Fors, 2011;
Puga-Caballero
et al
., 2014). The urbanized areas are in the core
of the city, surrounded by areas of grass, shrub and wetlands
(Fig. 1). Hence, the bird species assemblage varies along the
gradient from grass and wetland species (
e.g.
, Shiny cowbird,
Chestnut-capped blackbird, White-faced ibis) to urban-adapted
species, such the Gilded hummingbird [
Hylocharis chrysura
(Shaw, 1812)], Bananaquit [
Coereba flaveola
(Linnaeus, 1758)]
and Sayaca tanager [
Tangara sayaca
(Linnaeus, 1766)], which
are common in parks and gardens (Sick, 1997; Fontana
et al
.,
2011). Introduced species like the House sparrow, Rock dove
and Common waxbill [
Estrilda astrild
(Linnaeus, 1758)], also
dominate the urban landscapes (Blair, 2004; Bino
et al
., 2008;
Fontana
et al
., 2011; Ortega-Álvarez
&
MacGregor-Fors,
2011; Aronson
et al
., 2014).
Although some effects of urbanization on the bird
species assemblage were not so clear, the regression models
nonetheless showed well known effects of urbanization.
The proportion of arboreal vegetation cover was the most
important variable predicting an increase in species richness
in Canoas, corroborating the known role of green areas
as biodiversity enhancers in urban centers (Chace
&
Walsh, 2006; Evans
et al
., 2009; Fontana
et al
., 2011;
Ortega-Álvarez
&
MacGregor-Fors, 2011; Toledo
et al
., 2012; Njoroge
et al
., 2013; Aronson
et al
., 2014;
Beninde
et al
., 2015; Sacco
et al
., 2015). Open landscapes
prevail in the Canoas region, and the arboreal component
is characterized by gardens, squares and parks in the urban
area; this contrasts with cities with large forested areas on
the borders, for instance around Porto Alegre (Fontana
et al
., 2011). As observed in other studies, plots of open
vegetation (squares, gardens, golf courses) usually have
higher biodiversity (Evans
et al
., 2009; Aronson
et al
.,
2014; Beninde
et al
., 2015). Therefore, these areas are home
to particular bird species assemblages that are distinct from
rural and peri-urban avifauna.
On the other hand, the negative effects of urbanization
upon bird diversity are clearly showed in the relationships
between species richness and the level of noise and the density
of houses. Noise is a striking feature of urban centers, usually
related to low species richness and abundance (Fontana
et
al
., 2011; Pickett
et al
., 2011; Sacco
et al
., 2015). Together
with other human activities, noise may constrain species’
ability settle in urban centers, which leads to loss of diversity
and differentiation in bird species assemblages (Francis
et al
., 2009; Fontana
et al.
, 2011; Rolando
et al.,
1997;
Slabbekoorn
&
Peet, 2003; Bisson
et al.
, 2011; Pickett
et al
., 2011; Chávez-Zichinelli
et al
., 2013).
In addition to noise, the density of houses and presence
of buildings affected both species richness and abundance in
our study. Although both variables are related to urbanization,
they are not good indicators of urbanization, as their effects
are dependent on the scale analyzed and the particular process
of urbanization for each city (Evan
s
et al
., 2009). In Canoas,
the density of houses appears to indicate densely urbanized
areas, and adds to other urban features (noise, buildings) in
negatively affecting the avifauna. Although negatively related
to bird abundance, presence of buildings was positively
related to species richness, probably due to the occurrence
of aerial foragers (
e.g.
, Hirundinidae) and species that nest
or live in rocky habitats (
e.g.
, Apodidade) (Blair, 1996,
2004; Aronson
et al
., 2014).
Bird abundance tends to increase with urbanization,
which is an artifact of the higher density of a few urban
exploiters, often exotic species (Croci
et al
., 2008; Chace
&
Walsh, 2006; Bino
et al
., 2008; Ortega-Álvarez &
MacGregor-Fors, 2011; Aronson
et al
., 2014; Francis,
2015). Omnivores and synanthropic species [
e.g.
, Rock dove,
Rufous-bellied thrush (
Turdus rufiventris
Vieillot, 1818),
Great kiskadee
Pitangus sulphuratus
(Linnaeus, 1766)] were
very abundant in Canoas. These species are generalists in
diet and habitat use, and have great ecological plasticity:
they are more efficient at exploiting resources in urban areas
that are new to native species (Blair, 1996).
We found a high abundance of urban exploiters, like
House sparrows, Rock doves and Eared doves [
Zenaida
auriculata
(Des Murs, 1847)], in more urbanized areas, in
agreement with the pattern found in other studies (Blair,
2004; Chace
&
Walsh, 2006; Bino
et al
., 2008; Fontana
et al
., 2011; Ortega-Álvarez
&
MacGregor-Fors,
2011; Aronson
et al
., 2014; Puga-Cabalero
et al
., 2014).
However, his pattern of abundant urban exploiters does
not reflect a positive overall effect of urbanization on bird
abundance. In fact, pavilions were the only urban feature
positively related to abundance, probably because they offer
local resources for a few common species. On the other hand,
peri-urban areas of the city, which were used for agriculture
in past decades, showed high abundance of a few species
(
e.g.
, Bare- and White-faced ibises, Shiny cowbird). This
concentration of birds in peri-urban areas (Fig. 1) masks
the expected pattern seen along a rural-urban gradient:
increase in abundance from rural areas to urban centers
(Blair, 1996; Chace
&
Walsh, 2006; McKinney, 2006;
Bino
et al
., 2008; Ortega-Álvarez
&
MacGregor-Fors,
2011; Puga-Caballero
et al
., 2014).
habitats patchily distributed inside the city, buffering bird
species distribution from urban effects. The presence of
wetlands, grasslands (vacant lots, lawns and squares) and
woodlots (urban parks, gardens) offers habitats to species
less adapted to the urban environment (urban avoiders),
reducing the biotic homogenization and maintaining part of
the pre-urbanization pool of species. We agree with Fontana
et al
. (2011), that the level of noise seems to be the best
variable indicating the degree of urbanization. Along with
vegetation cover or related parameters (density of trees,
presence of green areas) (Chace
&
Walsh, 2006; Evans
et
al.
, 2009; Aronson
et al
., 2014; Beninde
et al
., 2015), the
level of noise would be the best variable to use in order to
recognize levels of urbanization.
Finally, given the increasing concern with sustainable
urban development, seeking environment-friendly urban
growth that preserves cities’ biodiversity (Pickett
et al
.,
2011; Aronson
et al
., 2014; Beninde
et al
., 2015), urban
planners need to take into account how the city works
ecologically (Pickett
et al
., 2011), for example, how the
biota responds to an urban environment. This is essential for
conservation and management purposes. The effects of the
level of noise and presence of green areas on urban-dwelling
birds, for instance, are well known (
e.g.
, Chace
&
Walsh,
2006; Evans
et al
., 2009; Aronson
et al
., 2014; Beninde
et al
., 2015), and should be considered in urban planning
policies. Supporting citizens in maintaining residential
vegetation (
e.g.
, private yards), and, hence, keeping areas
of native vegetation inside the urban area, is a simple example
of how to increase a city’s green areas and promote biological
conservation (Smith
et al
., 2014).
Acknowledgements.We thank Sandra M. Hartz and Jan K.
F. Mähler Jr for valuable contributions to first draft of the manuscript. We appreciate the improvements in English usage made by Jessica Barker through the Association of Field Ornithologists’ program of editorial assistance.
REFERENCES
Aronson, M. F. J.; La Sorte, F. A.; Nilon, C. H.; Katti, M.; Goddard, M. A.; Lepczyk, C. A.; Warren, P. S.; Williams, N. S. G.; Cilliers, S.; Clarkson, B.; Dobbs, C.; Dolan, R.; Hedblom, M.; Klotz, S.; Kooijmans, J. L.; Kühn, I.; MacGregor-Fors, I.; McDonnell, M.; Mörtberg, U.; Pyšek, P.; Siebert, S.; Sushinsky, J.; Werner, P.
& Winter, M. 2014. A global analysis of the impacts of urbanization on
bird and plant diversity reveals key anthropogenic drivers. Proceedings of the Royal Society B 281:20133330. DOI: 10.1098/rspb.2013.3330
Barton, K. 2014. MuMIn: Multi-model inference. R package version 1.10.5. Available at <http://CRAN.R-project.org/package=MuMIn>.
Accessed on 9 June 2015.
Beninde, J.; Veith, M. & Hochkirch, A. 2015. Biodiversity in cities needs
space: a meta-analysis of factors determining intra-urban biodiversity variation. Ecology Letters 18:581-592.
Bino, G.; Levin, N.; Darawshi, S.; Van Der Hal, N. & Reich-Solomon,
A. 2008. Accurate prediction of bird species richness patterns in an urban environment using Landsat-derived NDVI and spectral unmixing.
International Journal of Remote Sensing 29(13):3675-3700.
Bisson, I.-A.; Butler, L. K.; Hayden, T. J.; Kelley, P.; Adelman, J. S.; Romero, L. M. & Wikelski, M.C. 2011. Energetic response to
human disturbance in an endangered songbird. Animal Conservation 14:484-491.
Blair, R. B. 1996. Land use and avian species diversity along an urban gradient. Ecological Applications 6(2):506-519. DOI:10.2307/2269387
Blair, R. 2004. The effects of urban sprawl on birds at multiple levels of biological organization. Ecology and Society 9(5), 2. Available at:
<http://www.ecologyandsociety.org/vol9/iss5/art2/>
Chace, J. F. & Walsh, J. J. 2006. Urban effects on native avifauna: a review. Landscape and Urban Planning 74:46-69.
Chávez-Zichinelli, C. A.; Fors, I. M.; Quesada, J.; Rohana, P. T.; Romano, M. C.; Valdéz, R. & Schondube, J. E. 2013.How stressed are
birds in an urbanizing landscape? Relationships between the physiology of birds and three levels of habitat alteration. Condor 115(1):84-92.
Clergeau, P.; Savard, J. P. L.; Mennechez, G. & Falardeau, G. 1998. Bird
abundance and diversity a long an urban-rural gradient: a comparative study between two cities on different continents. Condor 100:413-425.
Croci, S.; Butet, A. & Clergeau, P. 2008. Does urbanization filter birds
on the basis of their biological traits? Condor 110(2):223-240.
Dallimer, M.; Davies, Z. G.; Diaz-Porras, D. F.; Irvine, K. N.; Maltby, L.; Warren, P. H.; Armsworth, P. R. & Gaston, K. J. 2015. Historical
influences on the current provision of multiple ecosystem services.
Global Environmental Change 31:307-317.
Davis, R. A.; Gole, C. & Roberts, J. D. 2012. Impacts of urbanisation on
the native avifauna of Perth, Western Australia. Urban Ecosystems 16:427-452.
Estado da Cidade. 2014. Um Retrato de Canoas/Prefeitura Municipal de Canoas: Instituto Canoas XXI. Available at <http://www.youblisher.
com/p/1312951-Estado-da-Cidade-2014/>. Accessed on 7 July 2016. Evans, K. L.; Newson, S. E. & Gaston, K. J. 2009. Habitat influences on
urban avian assemblages. Ibis 151:19-39.
Fontana, C. S.; Burger, M. I. & Magnusson, W. E. 2011. Bird diversity in
a subtropical South American city: effects of noise levels, arborisation and human population density. Urban Ecosystems 14:341-360.
Francis, C. D. 2015. Vocal traits and diet explain avian sensitivities to anthropogenic noise. Global Change Biology 21:1809-1820.
Francis, C. D.; Ortega, C. P. & Cruz, A. 2009. Noise pollution changes
avian communities and species interactions. Current Biology 19
:1415-1419.
IBGE. 2010. Contagem da população 2010 – Canoas/RS. Available at
<http://www.ibge.gov.br/cidades>. Accessed on 8 May 2013. Köppen, W. 1918. Klassifikation der Klimate nach Temperatur, Niederschlag
und Jahresablauf (Classification of climates according to temperature, precipitation and seasonal cycle). Petermanns Geographische Mitteilungen 64:193-203, 243-248.
Legendre, P. & Legendre, L. 1998. Numerical ecology. Amsterdam,
Elsevier Science B.V. 1006p.
Leveau, L. M.; Isla, F. I. & Bellocq, M. I. 2015. Urbanization and the
temporal homogenization of bird communities: a case study in central Argentina. Urban Ecosystems 18:1461-1476.
Marzluff, J. M.; Bowman, R. & Donnelly, R. 2001. Avian ecology and conservation in an urbanizing world. Boston, Kluwer Academic
Publishers. 600p.
Mayer, N. J. 2009. Memória Ambiental da cidade de Canoas: os impactos do processo de globalização a partir dos anos 60. Brasil,
Tecnicópias. 144p.
McKinney, M. L. 2006. Urbanization as a major cause of biotic homogenization. Biological Conservation 127:247-260.
Njoroge, J. B.; NdaNg’ang’a, P. K. & Natuhara, Y. 2013. The pattern
of distribution and diversity of avifauna over an urbanizing tropical landscape. Urban Ecosystems 17:61-75.
Oksanen, J.; Blanchet, F. G.; Kindt, K.; Legendre, P.; Minchin, P. R.; O’Hara, R. B.; Simpson, G. L.; Solymos, P.; Stevens, M. H. H. & Wagner, H. 2015. vegan: Community Ecology Package. R package version 2.3-0. Available at <http://CRAN.R-project.org/
package=vegan>. Accessed on 9 June 2015.
Ortega-Álvarez, R. & MacGregor-Fors, I. 2011. Dusting-off
the file: A review of knowledge on urban ornithology in Latin America. Lanscape and Urban Planning 101:1-10. DOI:10.1016/j.
landurbplan.2010.12.020.
Lima, L. M.; Pioli, D.; Schunck, F.; Amaral, F. R. do; Bencke, G. A.; Cohn-Haft, M.; Figueiredo, L. F. A.; Straube, F. C. & Cesari, E. 2015. Annotated checklist of the birds of Brazil by the Brazilian Ornithological Records Committee / Lista comentada das aves do Brasil pelo Comitê Brasileiro de Registros Ornitológicos. Revista Brasileira de Ornitologia 23(2):91-298.
Pickett, S. T. A.; Cadenasso, M. L.; Grove, J. M.; Boone, C. G.; Groffman, P. M.; Irwin, E.; Kaushal, S. S.; Marshall, V.; McGrath, B. P.; Nilon, C. H.; Pouyat, R. V.; Szlavecz, K.; Troy, A. & Warren,
P. 2011. Urban ecological systems: Scientific foundations and a decade of progress. Journal Environmental Management 93:331-362.
Puga-Caballero, A.; MacGregor-Fors, I. & Ortega-Álvarez, R. 2014.
Birds at the urban fringe: avian community shifts in different peri-urban ecotones of a megacity. Ecological Research 29:619-628.
R Development Core Team. 2015. R: A language and environment for statistical computing. Available at <http://R-project.org/>. Accessed
on 9 June 2015.
Ralph, C. J.; Geupel, G. R.; Pyle, P.; Martin, T. E. & DeSante, D. F.
1993. Handbook of field methods for monitoring landbirds. General Technical Report PSW-GTR-144-www. Albany, Pacific Southwest Research Station. 46p.
Rolando, A.; Maffei, G.; Pulcher, C. & Giuso, A. 1997. Avian community
structure along an urbanization gradient. Italian Journal of Zoology 64:341-349.
Sacco, A.; Rui, A. M.; Bergmann, F. B.; Müller, S. C. & Hartz, S.
M. 2015. Perda de diversidade taxonômica e funcional de aves em área urbana no sul do Brasil. Iheringia, Série Zoologia 105:276-287.
Sick, H. 1997. Ornitologia Brasileira. Rio de Janeiro, Nova Fronteira. 862p.
Slabbekoorn, H. & Peet, M. 2003. Birds sing at a higher pitch in urban
noise. Nature 424:267. DOI:10.1038/424267a.
Smith, A. C.; Francis, C. M. & Fahrig, L. 2014. Similar effects of
residential and non-residential vegetation on bird diversity in suburban neighbourhoods. Urban Ecosystems 17:27-44.
Sol, D.; González-Lagos, C.; Moreira, D.; Maspons, J. & Lapiedra, O.
2014. Urbanisation tolerance and the loss of avian diversity. Ecology Letters 17:942-950.
Tait, C. J.; Daniel, C. B. & Hill, R. S. 2005. Changes in species assemblages
within the Adelaide metropolitan area, Australia, 1836–2002. Ecological Applications 15(1):346-359.
Taylor, L.; Taylor, C. & Davis, A. 2013. The impact of urbanization on
avian species: The inextricable link between people and birds. Urban Ecosystems 16(3):481-498.
Ter Braak, C. J. L. & Šmilauer, P. 2002. Canoco for Windons Version 4.5. Wageningen, Plant Research International.
Toledo, M. C. B.; Donatelli, R. J. & Batista, G. T. 2012. Relation
between green spaces and bird community structure in an urban area in Southeast Brazil. Urban Ecosystems 15:111-131.
Tratalos, J.; Fuller, R. A.; Evans, K. L.; Davies, R. G.; Newson, S. E.; Greenwood, J. J. D. & Gaston, K. J. 2007. Bird densities are associated
Appendix 1.Species abundance (SA, number of individuals) and frequency of occurrence (Fr, number of points with where target species was recorded divided by the total of point-counts) recorded in 118 point-counts in the urban area of Canoas, Rio Grande do Sul, Brazil. Taxonomy and common names are listed according to the Brazilian Ornithological Records Committee (Piacentiniet al., 2015). Diets and foraging habitats are given according to Sick (1997). Species marked with a ‘X’ in SA column were those recoded only occasionally (i.e., outside the point-count limits). Diet: Omn, omnivore; Car, carnivore; Pis, piscivore; Ins, insectivore; Sca, scavenger; Gra, granivore; Fru, frugivore; Nec, nectarivore; Snail, snail. Habitat: Wet, wetland; Grass, grassland; For, forest; Wood, woodlots; Palm, palm forest; Shrub, shrublands; Marsh, marshes; Mang, mangroves; Water, river, lakes and/or coastal areas; Rice, rice fields; Urb, urban; Gen, generalists; Open, open areas.
Taxon Common name SA Fr Diet Habitat Species code
Anseriformes Anatidae
Callonetta leucophrys (Vieillot, 1816) Ringed Teal X Omn Wet Cal_leu
Amazonetta brasiliensis (Gmelin, 1789) Brazilian Teal 5 0.025 Omn Wet Ama_bra
Ciconiiformes Ciconiidae
Ciconia maguari (Gmelin, 1789) Maguari Stork X Car Wet Cic_mag
Suliformes
Phalacrocoracidae
Nannopterum brasilianus (Gmelin, 1789) Neotropic Cormorant X Pis Water Nan_bra
Pelecaniformes Ardeidae
Nycticorax nycticorax (Linnaeus, 1758) Black-crowned Night-Heron X X Car Water Nyc_nyc
Bubulcus ibis (Linnaeus, 1758) Cattle Egret 25 0.008 Ins Grass Bub_ibi
Ardea cocoi Linnaeus, 1766 Cocoi Heron 2 0.008 Car Water Ard_coc
Ardea alba Linnaeus, 1758 Great Egret 3 0.017 Car Water; Marsh Ard_alb
Syrigma sibilatrix (Temminck, 1824) Whistling Heron X X Car Grass; Rice Syr_sib
Threskiornithidae
Plegadis chihi (Vieillot, 1817) White-faced Ibis 98 0.051 Ins Wet; Rice Ple_chi
Phimosus infuscatus (Lichtenstein, 1823) Bare-faced Ibis 120 0.025 Omn Wet Phi_inf
Platalea ajaja Linnaeus, 1758 Roseate Spoonbill X Ins Wet; Mang Pla_aja
Cathartiformes Cathartidae
Coragyps atratus (Bechstein, 1793) Black Vulture 3 0.008 Sca Gen; Urb Cor_atr
Accipitriformes Accipitridae
Circus buffoni (Gmelin, 1788) Long-winged Harrier X Car Wet; Grass Cir_buf
Rostrhamus sociabilis (Vieillot, 1817) Snail Kite 4 0.025 snail Wet Ros_soc
Heterospizias meridionalis (Latham, 1790) Savanna Hawk 2 0.008 Car Grass Het_mer
Rupornis magnirostris (Gmelin, 1788) Roadside Hawk 1 0.008 Car Grass; For Rup_mag
Gruiformes Aramidae
Aramus guarauna (Linnaeus, 1766) Limpkin 1 0.008 Snail Wet Ara_gua
Rallidae
Aramides saracura (Spix, 1825) Slaty-breasted Wood-Rail 1 0.008 Omn For; Wet Ara_sar
Gallinula galeata (Lichtenstein, 1818) Common Gallinule 2 0.008 Omn Water Gal_gal
Porphyriops melanops (Vieillot, 1819) Spot-flanked Gallinule 1 0.008 Omn Water Por_mel
Charadriiformes Charadriidae
Vanellus chilensis (Molina, 1782) Southern Lapwing 83 0.263 Ins Wet, Grass Van_chi
Recurvirostridae
Himantopus melanurus Vieillot, 1817 White-backed Stilt 6 0.017 Ins Wet, Water Him_mel
Scolopacidae
Gallinago paraguaiae (Vieillot, 1816) South American Snipe X Omn Wet Gal_par
Jacanidae
Jacana jacana (Linnaeus, 1766) Wattled Jacana 17 0.051 Omn Wet Jac_jac
Columbiformes Columbidae
Columbina talpacoti (Temminck, 1810) Ruddy Ground-Dove 76 0.347 Gra Open; Wet Col_tap
Columbina picui (Temminck, 1813) Picui Ground-Dove 65 0.314 Gra Grass Col_pic
Columba livia Gmelin, 1789 Rock Pigeon 118 0.280 Gra Urb Col_liv
Patagioenas picazuro (Temminck, 1813) Picazuro Pigeon 4 0.025 Gra, Fru For; Wood Pat_pic
Taxon Common name SA Fr Diet Habitat Species code
Leptotila verreauxi Bonaparte, 1855 White-tipped Dove 1 0.008 Fru, Gra Grass; Shrub; For Lep_ver Cuculiformes
Cuculidae
Piaya cayana (Linnaeus, 1766) Squirrel Cuckoo 1 0.008 Car For Pia_cay
Crotophaga ani Linnaeus, 1758 Smooth-billed Ani X Car Open Cro_ani
Guira guira (Gmelin, 1788) Guira Cuckoo 8 0.025 Car Grass Gui_gui
Strigiformes Strigidae
Athene cunicularia (Molina, 1782) Burrowing Owl 1 0.008 Car Grass Ath_cun
Apodiformes Apodidae
Chaetura meridionalis Hellmayr, 1907 Sick’s Swift 4 0.025 Ins Grass; Urb Cha_mer
Trochilidae
Chlorostilbon lucidus (Shaw, 1812) Glittering-bellied Emerald 2 0.017 Nec Shrub; Urb Chl_luc
Hylocharis chrysura (Shaw, 1812) Gilded Hummingbird 17 0.127 Nec For; Shrub Hyl_chr
Piciformes
Picidae
Melanerpes candidus (Otto, 1796) White Woodpecker X Omn Grass Mel_can
Veniliornis spilogaster (Wagler, 1827) White-spotted Woodpecker 1 0.008 Ins For Vem_spi
Colaptes melanochloros (Gmelin, 1788) Green-barred Woodpecker 3 0.025 Ins For; Shrub; Open Col_mel
Colaptes campestris (Vieillot, 1818) Campo Flicker 22 0.110 Ins Grass Col_cam
Falconiformes
Falconidae
Caracara plancus (Miller, 1777) Southern Caracara 1 0.008 Omn Grass; Open Car_pla
Milvago chimachima (Vieillot, 1816) Yellow-headed Caracara 1 0.008 Omn Open Mil_chm
Milvago chimango (Vieillot, 1816) Chimango Caracara 2 0.017 Car Grass; Open Mil_chg
Falco sparverius Linnaeus, 1758 American Kestrel X Car Grass Fal_spa
Psittaciformes
Psittacidae
Myiopsitta monachus (Boddaert, 1783) Monk Parakeet 33 0.136 Fru Grass, Wood Myi_mon
Amazona aestiva (Linnaeus, 1758) Turquoise-fronted Parrot 2 0.008 Fru For, Palm Ama_aes
Passeriformes Thamnophilidae
Thamnophilus ruficapillus Vieillot, 1816 Rufous-capped Antshrike 2 0.008 Ins Grass; For Tha_ruf
Thamnophilus caerulescens Vieillot, 1816 Variable Antshrike 2 0.008 Ins For; Shrub Tha_cae
Furnariidae
Furnarius rufus (Gmelin, 1788) Rufous Hornero 154 0.712 Ins Open Fur_ruf
Schoeniophylax phryganophilus (Vieillot, 1817) Chotoy Spinetail 2 0.008 Ins Grass; Shrub Sch_phr
Certhiaxis cinnamomeus (Gmelin, 1788) Yellow-chinned Spinetail 9 0.051 Ins Open Cer_cin
Synallaxis cinerascens Temminck, 1823 Gray-bellied Spinetail 1 0.008 Ins For Syn_cin
Synallaxis spixi Sclater, 1856 Spix’s Spinetail 4 0.034 Ins For Syn_spi
Rhynchocyclidae
Phylloscartes ventralis (Temminck, 1824) Mottle-cheeked Tyrannulet 4 0.034 Ins For Phy_ven
Tyrannidae
Camptostoma obsoletum (Temminck, 1824) Southern Beardless-Tyrannulet 10 0.059 Omn For; Shrub Cam_obs
Elaenia flavogaster (Thunberg, 1822) Yellow-bellied Elaenia 27 0.152 Omn Grass; Shrub Ela_fla
Serpophaga subcristata (Vieillot, 1817) White-crested Tyrannulet 5 0.034 Ins Grass; Shrub Ser_sub
Pitangus sulphuratus (Linnaeus, 1766) Great Kiskadee 165 0.771 Omn Gen; Urb Pit_sul
Machetornis rixosa (Vieillot, 1819) Cattle Tyrant 5 0.025 Ins Grass Mac_rix
Satrapa icterophrys (Vieillot, 1818) Yellow-browed Tyrant 5 0.042 Ins For; Shrub Sat_ict
Xolmis irupero (Vieillot, 1823) White Monjita 5 0.042 Ins Grass; Shrubs Xol_iru
Vireonidae
Cyclarhis gujanensis (Gmelin, 1789) Rufous-browed Peppershrike X Omn For; Shrub Cyc_guj
Hirundinidae
Pygochelidon cyanoleuca (Vieillot, 1817) Blue-and-white Swallow 78 0.339 Ins Gen; Urb Pyg_cya
Progne chalybea (Gmelin, 1789) Gray-breasted Martin 38 0.161 Ins Gen; Urb Pro_cha
Tachycineta leucorrhoa (Vieillot, 1817) White-rumped Swallow 8 0.034 Ins Gen; Urb Tac_leu
Taxon Common name SA Fr Diet Habitat Species code
Troglodytidae
Troglodytes musculus Naumann, 1823 Southern House Wren 82 0.534 Omn Gen; Urb Tro_mus
Turdidae
Turdus leucomelas Vieillot, 1818 Pale-breasted Thrush 4 0.034 Omn Gen; Urb Tur_leu
Turdus rufiventris Vieillot, 1818 Rufous-bellied Thrush 119 0.636 Omn Gen; Urb Tur_ruf
Turdus amaurochalinus Cabanis, 1850 Creamy-bellied Thrush 5 0.042 Omn Gen; Urb Tur_ama
Mimidae
Mimus saturninus (Lichtenstein, 1823) Chalk-browed Mockingbird 16 0.076 Omn Open; Shrub Mim_sat Motacillidae
Anthus lutescens Pucheran, 1855 Yellowish Pipit 4 0.017 Omn Grass; Wet Ant_lut
Passerelidae
Zonotrichia capensis (Statius Muller, 1776) Rufous-collared Sparrow 13 0.093 Omn Grass; Open Zon_cap
Ammodramus humeralis (Bosc, 1792) Grassland Sparrow 2 0.017 Gra Grass Amm_hum
Parulidae
Setophaga pitiayumi (Vieillot, 1817) Tropical Parula 1 0.008 Ins For Set_pit
Geothlypis aequinoctialis (Gmelin, 1789) Masked Yellowthroat 8 0.059 Ins Wet; Shrub Geo_aeq
Basileuterus culicivorus (Deppe, 1830) Golden-crowned Warbler 7 0.042 Ins For Bas_cul
Myiothlypis leucoblephara (Vieillot, 1817) White-browed Warbler 2 0.017 Ins For Bas_leu
Icteridae
Amblyramphus holosericeus (Scopoli, 1786) Scarlet-headed Blackbird X Omn Wet Amb_hol
Chrysomus ruficapillus (Vieillot, 1819) Chestnut-capped Blackbird 19 0.034 Omn Wet Chr_ruf
Pseudoleistes guirahuro (Vieillot, 1819) Yellow-rumped Marshbird 2 0.008 Omn Wet Pse_gui
Agelaioides badius (Vieillot, 1819) Grayish Baywing 17 0.042 Omn Open Age_bad
Molothrus bonariensis (Gmelin, 1789) Shiny Cowbird 315 0.254 Omn Grass; Open Mol_bon
Sturnella superciliaris (Bonaparte, 1850) White-browed Meadowlark 2 0.008 Omn Grass Stu_sup
Thraupidae
Pipraeidea bonariensis (Gmelin, 1789) Blue-and-yellow Tanager 6 0.042 Fru For Pip_bon
Paroaria coronata (Miller, 1776) Red-crested Cardinal 3 0.008 Omn Grass; Shrub Par_cor
Tangara sayaca (Linnaeus, 1766) Sayaca Tanager 112 0.492 Fru Gen; Urb Tan_sy
Tangara palmarum (Wied, 1821) Palm Tanager 13 0.059 Omn For; Palm Tan_pal
Sicalis flaveola (Linnaeus, 1766) Saffron Finch 61 0.161 Gra Grass Sic_fla
Coryphospingus cucullatus (Statius Muller, 1776) Red-crested Finch 4 0.025 Omn For Lan_cuc
Coereba flaveola (Linnaeus, 1758) Bananaquit 99 0.627 Nec For Coe_fla
Sporophila caerulescens (Vieillot, 1823) Double-collared Seedeater 3 0.025 Gra Grass Spo_car
Embernagra platensis (Gmelin, 1789) Great Pampa-Finch 2 0.008 Omn Grass; Wet Bem_pla
Saltator similis d’Orbigny & Lafresnaye, 1837 Green-winged Saltator 1 0.008 Omn For Sat_sim
Poospiza nigrorufa (d’Orbigny & Lafresnaye, 1837) Black-and-rufous Warbling-Finch 2 0.017 Omn For Poo_nig Fringillidae
Euphonia chlorotica (Linnaeus, 1766) Purple-throated Euphonia 7 0.059 Fru For Eup_chl
Euphonia cyanocephala (Vieillot, 1818) Golden-rumped Euphonia 2 0.008 Fru For Eup_cya
Estrildidae
Estrilda astrild (Linnaeus, 1758) Common Waxbill 18 0.025 Gra Gen; Urb Est_est
Passeridae
Passer domesticus (Linnaeus, 1758) House Sparrow 568 0.881 Omn Gen; Urb Pas_dom