Programa de Pós-Graduação em Engenharia Elétrica
Decoding Passive Optical Network
Surveillance Based Upon Constraint
Management Techniques
Gerson Flávio Mendes de Lima
Decoding Passive Optical Network
Surveillance Based Upon Constraint
Management Techniques
Texto da tese apresentada ao Programa de Pós-Graduação em Engenharia Elétrica da Universidade Federal de Uberlândia, perante a banca de examinadores, como parte dos requisitos para a obtenção do título de Doutor em Ciências.
Área de concentração: Processamento da Informação, Computação GráĄca
Orientador: Prof. Edgard Lamounier,PhD Co-Orientador: Alexandre Cardoso,Dr
Dados Internacionais de Catalogação na Publicação (CIP) Sistema de Bibliotecas da UFU, MG, Brasil.
L732d
2014 Lima, Gerson Flávio Mendes de, 1969- Decoding passive optical network surveillance based upon constraint management techniques / Gerson Flávio Mendes de Lima. - 2014.
126 f. : il.
Orientador: Edgard Afonso Lamounier Júnior.
Tese (doutorado) - Universidade Federal de Uberlândia, Programa de Pós-Graduação em Engenharia Elétrica.
Inclui bibliografia.
1. Engenharia elétrica - Teses. 2. Fibras óticas - Teses. 3. Comunicação por fibra ótica - Teses. 4. Redes Ópticas Passivas - Teses. I. Lamounier Júnior, Edgard Afonso, 1964- II. Universidade Federal de Uberlândia. Programa de Pós-Graduação em Engenharia Elétrica. III. Título.
Decoding Passive Optical Network
Surveillance Based Upon Constraint
Management Techniques
Texto da tese apresentada ao Programa de Pós-Graduação em Engenharia Elétrica da Universidade Federal de Uberlândia, perante a banca de examinadores, como parte dos requisitos para a obtenção do título de Doutor em Ciências.
Área de concentração: Processamento da Informação, Computação GráĄca
Uberlândia, 10 de Setembro de 2014
Banca Examinadora:
Prof. Edgard Lamounier,PhD Ű FEELT/UFU
Alexandre Cardoso, Dr Ű FEELT/UFU
Gilberto Arantes Carrijo, PhD Ű FEELT/UFU
Keiji Yamanaka, PhD Ű FEELT/UFU
Sergio Barcelos,PhD Ű FIBERWORK
Lima, G. F. M. Passive Optical Networks Surveillance Decoding using Constraint-Based Techniques. 126 p. Ph.D. Thesis Qualify Ű Faculty of Electrical Engineering, Federal University of Uberlândia, 2014 .
Constraints techniques have been applied to a large amount of applications for En-gineering Design. In fact, the challenges imposed by graphics and equation constraints result in valuable features when considering - Computer Aided Design (CAD) / - Com-puter Aided Engineering (CAE) software, this include supporting faster decision process by engineers. On the other hand, Passive Optical Networks (PON) are progressively be-coming reality, while commercial deployments are reported worldwide. Operating these networks, however, requires adequate means for a cost effective monitoring. This includes troubleshooting faults with the possibility to remotely differentiate between an equipment failure and a Ąbre break and, subsequently, to localize it in the network. This is of great importance for Telecommunication Carriers. The use of Optical Time Domain Reflec-tometry (OTDR) techniques is widely used in point-to-point optical network topologies. However, it has major limitations in tree-structured PONs, where all backscattered traces merge at the Optical Line Terminal (OLT) location. Therefore, it is difficult to differenti-ate between the branches. As after splitters where the OTDR signals are superimposed. This work proposes a Constraints-based Differential Evolutionary algorithm that allows for the separation of the superimposed signal of a - Passive Optical Networks (PON) network and couple it with a - Fiber to The Home (FTTH) CAD design. This process intends on bringing compound an in-service PON management, considering the status of Ąber links and its geographical distribution branches of different lengths, with the capa-bility of localizing and quantifying several faults successively in the same or in different branches of a PON Network.
Lima, G. F. M. Decoding Passive Optical Network Surveillance Based Upon Constraint Management Techniques. 126 p. QualiĄcação de doutorado Ű Faculdade de Engenharia Elétrica, Universidade Federal de Uberlândia, 2014 .
O uso de técnicas de restrições são empregadas em uma grande escala de aplicações de engenharia. De fato os desaĄos impostos para as restrições gráĄcas e matemáticas resultam em características extremamente eĄcientes para os softwares de CAD / CAE, permitindo a criação de ferramentas de apoio a tomada de decisão muito eĄcazes. As redes FTTx (PON) estão se tornando progressivamente uma realidade comercial, e as suas implementações são relatadas em todo o mundo. Todavia, o funcionamento destas redes exige meios adequados para o monitoramento de baixo custo, especialmente, a possibilidade para detectar as falhas remotamente, assim como diferenciar entre uma falha de equipamento e uma ruptura de Ąbra, e subsequentemente, localizá-la geograĄcamente é de grande importância para as empresas de telecomunicações. O uso de técnicas de reflectometria óptica no domínio do tempo (OTDR) é amplamente utilizado nas redes de ópticas ponto-a-ponto. Entretanto esta técnica tem limitações quando utilizada em redes de topologias distribuidas, pois o sinal é dividido nos ramos da rede e são somados no Terminal de Linha Óptica (OLT), difícultando a diferenciação do sinal de cada ramo da rede separadamente onde os sinais (OTDR) são sobrepostos entre si. Este trabalho propoe um algoritmo de Evolução Diferêncial que permite a simulação matemática de divisores ópticos e a separação do sinal sobreposto de redes com divisores, integrando estes com o projeto CAD de uma rede FTTH, empregando técnicas de restrições. O resultado é apresentado em uma solução de acoplamento do mundo "optico" de sinais de reflectometria (OTDR)em redes PON com o mundo "Ąsico" do projeto em CAD, considerando as ligações de Ąbra e os seus ramos (divididos ou splitados).
Figure 1 Ű Proposed Methodology . . . 20
Figure 2 Ű Terrestrial Ąber-optic networks . . . 25
Figure 3 Ű Point-to-Point (P2P) optical networks . . . 26
Figure 4 Ű Variations of the access network architecture . . . 27
Figure 5 Ű P2MP single-splitter (tree-branched) PON . . . 28
Figure 6 Ű P2MP cascade-design PON . . . 28
Figure 7 Ű FTTH PON basic system architecture . . . 29
Figure 8 Ű a) Optical Cable perspective b) Optical Cable lateral view . . . 31
Figure 9 Ű Typical chromatic dispersion and spectral attenuation on FTTH PON Ąber (GIRARD, 2005) . . . 33
Figure 10 Ű Fiber attenuation . . . 34
Figure 11 Ű Bidirectional 1 x N PON splitter . . . 39
Figure 12 Ű Splitter design based on fused bi-conic tapered Ąber (FBT) . . . 40
Figure 13 Ű OTDR Block Diagram . . . 41
Figure 14 Ű Typical OTDR trace . . . 42
Figure 15 Ű Rayleigh Scattering . . . 43
Figure 16 Ű Fresnel Reflection . . . 44
Figure 17 Ű Attenuation and event dead zone . . . 45
Figure 18 Ű Graph representation of an Optical Cable and a Splitter. . . 47
Figure 19 Ű Algorithm results over a loud OTDR Signal (LIU; ZAROWSKI, 2001) . 49 Figure 20 Ű Schematic diagram of the proposed surveillance and protection scheme with centralized monitoring (AB-RAHMAN B NG, 2009) . . . 50
Figure 21 Ű Experimental setup for PON monitoring using periodic coding technol-ogy(RAD, 2010). . . 51
Ąber (URBAN et al., 2013) . . . 53
Figure 24 Ű Experimental Network Tested (Splitter conĄguration and branches) . . 55
Figure 25 Ű Physical principle of PON splitter . . . 59
Figure 26 Ű A heterodyne semiconductor laser optical phase-locked loop (SATYAN, 2011). . . 60
Figure 27 Ű Measured Signal (channel 1) x Signal Result using the Splitter Equation in one channel . . . 61
Figure 28 Ű Measured Signal (channels 5, 6, 7, 8) x Signal Result using the Equation in four channels . . . 62
Figure 29 Ű Measured Signal all channels x Signal Result using the Equation in all channels. . . 63
Figure 30 Ű OTDR signal simulation. . . 64
Figure 31 Ű Genetic Algorithm Block Diagram . . . 68
Figure 32 Ű Chromosome representation . . . 69
Figure 33 Ű Local solution candidates (Left) x Global solution Candidates (Right) . 70 Figure 34 Ű Differential Evolution (DE) representation (CHAKRABORTY, 2008) . 75 Figure 35 Ű Generating Mutant Solution Procedure (GUIMARAES, 2009) . . . 76
Figure 36 Ű GA x DE Comparative . . . 79
Figure 37 Ű Time (seconds) x Correlation Histogram . . . 80
Figure 38 Ű Boxplot of Correlation - 1000 tests . . . 80
Figure 39 Ű Results with correlation of 0.95126 . . . 81
Figure 40 Ű Plots of the separated channel (blue), simulated signal (green), mea-sured signal (red) . . . 82
Figure 41 Ű Plots of the separated channel (blue), simulated signal (green), mea-sured signal (red) . . . 82
Figure 42 Ű OTDR Signal separation Complete process . . . 85
Figure 43 Ű Signal Coupling Constraints Management . . . 85
Figure 44 Ű AutoCAD API (LIMA; JUNIOR, 2010) . . . 86
Figure 45 Ű Central Office Connection. . . 89
Figure 46 Ű Splitter Design symbology. . . 89
Figure 47 Ű Cable representation. . . 90
Figure 48 Ű Subscriber connection. . . 90
Figure 49 Ű PON Network . . . 91
Figure 50 Ű PON Network . . . 92
Figure 51 Ű Experimental arrangement . . . 107
Figure 54 Ű OTDR original signal and notch Ąlter . . . 111 Figure 55 Ű (a) Original OTDR signal (b) TEO signal T . . . 111 Figure 56 Ű Scatter plot of the TEO-OTDR results superposed to the OTDR
Table 1 Ű General non-linear effects and how they affect PONs. . . 35
Table 2 Ű Number of ports/Insertion loss relation . . . 40
Table 3 Ű Optical Cable Bobbin details connected in the branches . . . 55
Table 4 Ű Experimental tests with each separated channel. . . 56
Table 5 Ű Tests with combination 2 on 2 channels . . . 57
Table 6 Ű Tests with a crescent number of connections . . . 57
Table 7 Ű Simulated Signal in Function of sample index . . . 64
Table 8 Ű DE parameters . . . 78
Table 9 Ű GA parameters . . . 78
CAD - Computer Aided Design
CAE - Computer Aided Engineering
PON - Passive Optical Networks
FTTH - Fiber to The Home
OLT - Optical Line Terminal
CSV - Comma Separated Values
MDU - Multiple Dwelling Units
MTU - Multi Tenanted Units
STU - Single Tenanted Units
SFWU - Single Family Dwelling Units
NAP - Network Access Point
1 Introduction . . . . 17
1.1 Motivation . . . 17
1.2 Thesis Statement . . . 21
1.3 Objective and Research Goals . . . 21
1.4 Thesis Contribution . . . 22
1.5 Thesis Organization . . . 22
2 Fundamentals . . . . 24
2.1 Introduction . . . 24
2.2 FTTH PON Technology . . . 24
2.3 Passive Optical Components . . . 30
2.3.1 Optical Fiber Cable . . . 30
2.3.2 Optical Fiber Connectors . . . 38
2.3.3 Splitter . . . 39
2.4 OTDR Concepts . . . 41
2.4.1 Rayleigh Scattering . . . 42
2.4.2 Fresnel Reflection . . . 43
2.4.3 Dead Zones . . . 44
2.5 Constraint Management . . . 45
2.5.1 FTTH PON Design Constraints . . . 46
2.5.2 The Constraint Data Model for FTTH PON Network . . . 46
2.6 Concluding Remarks . . . 47
3 Related Work . . . . 48
3.1 Introduction . . . 48
3.2 Events Detection in Optical Fiber Networks . . . 48
3.3 Monitoring Techniques for PON . . . 50
4.2 Experimental Setup . . . 54
4.2.1 Test Sequence . . . 56
4.2.2 Splitter Equation . . . 58
4.3 OTDR Pulse Simulation . . . 64
4.4 Concluding Remarks . . . 66
5 Proposed solution: System Architecture . . . . 67
5.1 Introduction . . . 67
5.2 Initial implementation - Genetic Algorithm . . . 67
5.2.1 Genetic Algorithm - Block Diagram . . . 68
5.2.2 Chromosome Architecture . . . 68
5.2.3 Fitness function . . . 69
5.3 Parallelization of loops . . . 70
5.4 Differential Evolutionary Algorithm . . . 72
5.5 Differential Evolutionary Algorithm Variations . . . 77
5.6 GA x DE Results Comparison . . . 77
5.7 Results . . . 81
5.8 Concluding Remarks . . . 83
6 Results and Implementation Detail . . . . 84
6.1 Introduction . . . 84
6.1.1 An overall view . . . 84
6.1.2 Signal Coupling with Computer Graphics tool . . . 85
6.1.3 FTTH PON Network CAD Design . . . 89
6.1.4 Graphical User Interface (GUI) . . . 91
6.1.5 Concluding Remarks . . . 93
7 Conclusion and Future Work . . . . 94
7.1 Introduction . . . 94
7.2 Results Comparison . . . 94
7.3 Conclusion . . . 96
7.4 Future work . . . 96
APPENDIX A A TEO-Based Algorithm to detect events over OTDR
Measurements in FTTH PON Networks . . . 105
A.1 introduction . . . 105
A.2 The Teager Energy Operator (TEO) . . . 106
A.3 Experimental Arrangement . . . 107
A.4 Algorithm Description . . . 108
A.5 Conclusion . . . 112
APPENDIX B Routines to Genetic Algorithm . . . 113
Research Publications
Publications
1. Lima,G.F.M.;Lamounier,E.&Cardoso,A. A Constraint Techiniques to Sup-port Electronic TV Network Design. In: Published book - LAP - Lambert Academic Publishing AG & Co. KG, 2010.
2. Peretta, I. S.; Lima, G. F. M.; Tavares, J. A. & Yamanaka, K.A Spoken Word Boundaries Detection Strategy for Voice Command Recognition. Learning & Nonlinear Models, 2010.
3. Lima,G.F.M.;Peretta, I. S.;Tavares, J. A.; Lamounier,E.; Cardoso,A.& Yamanaka, K. Optimization of Lighting Design Usign Genetic Algorithms. In: 9
th IEEE/IAS International Conference on Industry Applications , 2010.
4. Tavares, J. A.;Peretta, I. S.;Lima,G.F.M.;Pais, M. S.;Yamanaka, K. Al-goritmo Baseado no Operador de Energia de Teager (TEO) para Segmentação de Linhas e Palavras em Textos Manuscritos e Impressos In: VII Workshop Compu-tational Vision, 2011, Curitiba p. 219-224.
5. LIMA, G. F. M. ; LAMOUNIER Junior, Edgard Afonso ; IGOR SAN-TOS PERETTA ; CARDOSO, A. ; Barcelos, Sergio ; MURAMOTO,
W. S. ; Rigon, Elso. A TEO-Based Algorithm to detect events over OTDR Measurements in FTTH PON Networks. In: 4TH IEEE LATIN-AMERICAN CONFERENCE ON COMMUNICATIONS 2012, 2012, CUENCA - ECUADOR.. LATINCOM 2012 - PROCEEDINGS, 2012.
Chapter
1
Introduction
Innovations in Telecommunications have produced a tremendous increase in communi-cation traffic and, consequently, a constant bandwidth demand and growth. This quickly led service providers to respond by bringing the optical Ąber closer and closer to the premises, and Ąnally directly into the home (GIRARD, 2005).
In this chapter, we present the motivation, statements and objectives for the present work presently under development.
1.1
Motivation
Fiber networks currently carry today data traffic over a thousand times higher than that of 10 years ago. It is believed that this traffic will grow much higher in the coming years due to the introduction of 100Gb/s transmission technologies. Besides, this scenario is related to the fast-paced market introduction of FTTH (Fiber-To-The-Home) broad-band access services (LIMA; LAMOUNIER; BARCELOS, 2012), (LIMA, 2013). Thus, carrierŠs customers are demanding ever-growing service downtime Ąnes in their Service Level Agreements - SLA. Nowadays, Ąber cuts have thus become very expensive to car-riers due to both lost revenue and tarnished business images. To reduce Ąber network downtime, improve network service availability and increase proĄtability, telecom carri-ers and utility companies must rely on automatic optical Ąber monitoring systems and efficient maintenance services (ALCATEL, 2009).
The application of optical technology in telecommunication systems such as local area networks, cable TV systems and Ąber-to-the home systems has been the subject of in-creased interest (GIRARD, 2005). Among the several kinds of optical network architec-tures, the passive branched type have been able to meet the needs for narrowing band customers as well as satisfy future upgrade requirements (URBAN et al., 2013). After the installation of such networks, it is important to be able to locate any Ąber link faults. As the capacity of passive optical networks (PONs) increases, allowing hundreds of clients to share the same infrastructure, the importance of performance monitoring increases. When a fault occurs, technicians must be dispatched to identify, locate and Ąx the failure. The time, efforts involved, and truck-roll for fault identiĄcation, dramatically, increase the op-erational expenditure and erode the proĄt margins for the Telecommunication Companies (RAD; FATHALLAH; RUSCH, 2010).
In addition, it is well known that optical-time-domain reflectometry (OTDR) is ef-Ącient for testing optical devices and point-to-point monitoring (YEH, 2005). However, it is not effective for point-to-multipoint (PMP) networks like PONs. The existing solu-tions for PON monitoring impose signiĄcant technical challenges, with most techniques presenting a limited capacity (IIDA et al., 2007), (HANN; YOO; PARK, 2006), (PARK et al., 2006). Service providers report that more than 80% of installed PON failures oc-cur within the Ąrst/last mile, i.e., within the distribution/drop segments of the network. Fiber-to-the home (FTTH) installations lack an efficient technology appropriate for the link quality monitoring of a PON (even the 1:32 BPON standard, ITU G.983) (RAD; FATHALLAH; RUSCH, 2010). Even with all PON deployments that are expected to take place in the next years, operators will repeatedly face the challenge that testing PONs poses (SIMARD, 2009).
Based on experience, the best PON-testing method that has emerged is derived from opti-cal time-domain reflectometry (OTDR) (GIRARD, 2005). The OTDR method has shown reliable results, while reducing the overall cost of testing. Since the OTDR method is a sin-gle ended method; it signiĄcantly reduces staff time, which is a key advantage (CHABOT, 2009). FTTH networks using PON technology can be characterized and maintained every step of the way using a Ąber-optic test and measurement equipment. OTDRs can also be used not only from the ONTs towards the coupler and - Optical Line Terminal (OLT) at the central office, but also, from the OLT towards the point to multipoint network. Mathematical splice loss predictions can be used to be more accurate and, consequently, to help to properly characterize the networks.
office building or warehouses (VAUGHN et al., 2004). Geographical distribution can vary from installation to installation and depends on a variety of parameters.
The standard for out-of-band optical time-domain reflectometry (OTDR), based on Rayleigh backscattering and power reflections used to monitor point-to-point links, is ineffective in point-to-multipoint TDM-PONs (ITU, 2005). The OTDR trace at the central office (CO) is a linear sum of the backscattered and reflected power from all the network branches. Therefore, it is difficult and even impossible for the CO manager to distinguish the events in one branch from others (URBAN et al., 2013).
Many FTTH management problems result from the very little information available to the CO manager concerning the network. This directly affects the quality of service and dramatically increases the administration, the maintenance, and the provisioning costs. For example, when two branches experience an equidistant failure event it becomes indis-tinguishable. Even when a Ąber fault results in an unambiguous event, the faulty branch is not identiĄed, requiring a truck-roll tour and outside intervention by technicians. Every branch must be checked separately from its end by means of an upstream power meter and/or OTDR transmission in order to identify that which is faulty. Moreover, when an optical network terminal (- Optical Network Terminal (ONT)) is not communicating with the CO, the manager cannot make a remote diagnosis and determine the cause, whether this is due to a Ąber cut or simply because the ONT is disconnected or turned off (RAD; FATHALLAH; RUSCH, 2010).
In Point to Multipoint Networks (PMP), the OTDR trace at the central office (CO) is a linear sum of the backscattered and reflected powers from all the network branches. It is difficult for the CO network manager to distinguish the events in one branch from those in others. The most important one is the difficulty in identifying a speciĄc broken branch in the PON tree architecture.(HANN; YOO; PARK, 2006). To guarantee quality of service through the PON, monitoring techniques should be provided under the in-service state through both fault diagnosis and maintenance (RAD; FATHALLAH; RUSCH, 2010).
OTDR
FTTH PON Design
CAD / GIS
Maps
Physical PON
Acquired Signal
DE / simulate
channels after
splitter
Fiber Lengthfor each channel
Figure 1 – Proposed Methodology
because the combined signatures of all N Ąbers on the branching side of the optical cou-pler are superimposed and this makes it very difficult (sometimes impossible) to associate events on the waveform with the speciĄc lines on which the events occur. This is prob-ably the most common problem faced by technicians when dealing with optical splitter. Some solutions arise, through Ąber faults monitoring techniques, as proposed by C.H. Yeh (YEH F.Y. SHIH; CHI, 2008) and the Ąber-break monitoring system as proposed by A.A.A. Bakar (BAKAR M.Z. JAMALUDIN; ABDULLAH, 2007).
However, in this work, we developed a set of constraint-based algorithms to build a sys-tem that controls optical network surveillance, integrating the graphical network design (CAD/GIS) with the OTDR measures from CO. In the same solution set, a Differential Evolutionary Algorithm (CHAKRABORTY, 2008) was implemented resulting in a signal separation of each branch of the network, associating events on the waveform with the speciĄc lines on which the events occur in a map. This work used an arrangement created speciĄcally to investigate a concept proof to determine an OTDR splitter relationship be-tween separated branches (superimpose mathematics equation) for In-service application using a FTTH optimized OTDR, placing onto the map of the separated OTDR signal af-ter the PON splitaf-ter. The motivation of this work is to separate the OTDR signal in order to plot over a map (CAD), the separated signal and use it to provide location based on information to improve maintenance procedures. Therefore, the signal separation is very important for providing an innovative tool that joins the OTDR Ąber signal separated after the splitter coupled with GIS information. This methodology is shown in Figure 1.
The algorithm will use the OTDR reflectometry technology to analyse the optical power signal, estimating the ĄberŠs length and overall attenuation, including splice and mated-connector losses, and coupling with a CAD network design relating each optical signal event with its relative geographic coordinates.
1.2
Thesis Statement
The purpose of this work is to investigate constraint-based techniques to support the the OTDR signal separation after a Splitter over a FTTH PON Network. In so doing, a solver based on Differential Evolutionary algorithms is proposed and evaluated through equations tested in laboratory. This methodology is applied as constraints into a CAD platform that couple the optical signal and network design creating an in-service PON management tool.
1.3
Objective and Research Goals
This work aims at evaluating a system based on the use of constraint techniques and computational intelligence algorithms to implement a solution to manage and monitor FTTH passive optical networks (Fiber-To-The-Home). This is achieved by using a set of techniques to evaluate networks in operation (in-service) and also by using a wavelength that does not interfere in the normal functioning of a telecommunication network, allow-ing the system to be monitored in real time. The system will be able to geographically analyse, locate and quantify (throughout the optical network and its coverage) several types of optical event. The main goal is to be able to separate the signal after a Splitter and locate it geographically on different branches of the network with complete accuracy. This will hopefully, eliminate the need for "Mirrors", or to be used as a "Bragg Grating" (HILL; MELTZ, 1997) accessory for Ąeld technicians.
This research also proposes a mathematical equation that allows one to computationally "Simulate" occurring events in the mixing reflectometry (OTDR) signals after the passive optical network splitters (PON) and thus provide the signal separation at each different branch of the splitter, using for this feature a speciĄcally developed evolutionary Algo-rithm (GOLDBERG, 1989).
The investigated technique is inspired on a common method known in literature as "Blind Source Separation", where the separation of a set of signals from a random mixed set of signals is used, without the aid of information (Or with very little information) about the original signals or the mixing process. This methodology is widely used in voice recogni-tion systems and for the separarecogni-tion of sound signal (ACHARYYA, 2008).
their subscribers served by telecommunication services. Therefore, this will provide an intelligent surveillance system for PON able to relate the physical components of the in-frastructure in the existing network events associated with the optical signal measured by reflectometry (OTDR) "Optical world", using an interface based on uses of Information Visualization techniques (LIMA; LAMOUNIER; CARDOSO, 2010) (LIMA et al., 2011) to provide efficacy and usability.
1.4
Thesis Contribution
After developing the research work, inspired on the goals and objectives outlined above, it is understood that this thesis makes the following contributions:
❏ An algorithm that allows for the analysis of the Reflectometry (OTDR) signal, and
detect events from within the loud signal;
❏ An ArtiĄcial Intelligence methodology to separate the mixed OTDR Signal after
the Optical Network Splitters;
❏ A Proposed Mathematical equation to simulate the Passive Optical Splitter.
❏ A Constraint-Based Database with Geographic Capabilities of FTTH PON network
in a GIS/CAD system allowing the user to view at the same time the physical network infrastructure and the Optical world "Signal" in real time in the same environment, using Information visualization techniques;
❏ Development of an experimental prototype that validates the items above;
1.5
Thesis Organization
❏ Fundamentals - Brief history about FTTH PON Technology, exploring the key
concepts of Optical Network components and Optical Time Domain Reflectome-ter (OTDR) signal characReflectome-teristics adopted in this thesis.
❏ Related Work - An Explanation for other similar and related works that inspired
this investigation.
❏ Experimental Methodology - A Detailed experimental arrangement created for
sim-ulation proposes, for performing a sequence of tests, a Splitter Equation and OTDR simulation.
❏ System Architecture - Detailed Genetic Algorithm implementation, Differential
❏ Results and Implementation Detail - Implementation detail of Signal Coupling with
CAD tool, explanation about the Graphics User Interface.
❏ Conclusion and Future Work - Results comparative, conclusion and advice on Future
Work.
❏ Bibliography
❏ Appendix A - A TEO-Based Algorithm to detect events over OTDR Measurements
in FTTH PON Networks.
❏ Appendix B - Routines to Genetic Algorithm - Matlab
Chapter
2
Fundamentals
2.1
Introduction
Wider deployment of Ąber over the last years has been driven by the increase in customer needs for higher communication capacity joint with a cost-efficient, fully reliable and accurate monitoring solution. Thus, supporting fault detection, identiĄcation, and localization in different Ąber access topologies will be a key part of such solutions (URBAN et al., 2013).
In this chapter, we present a technology overview of the key concepts of this research. The main idea is to allow for a deeper understanding of the experimental premises adopted in the development process. This chapter also presents a detailed review of FTTx technology giving an explanation as to its brief historical development to the current bandwidth usage worldwide, including network technologies and testing methods. The description of constraint management methodologies adopted in this research, is also explained.
2.2
FTTH PON Technology
Since the development of the optical Ąber, the personal computer and the Internet, bandwidth consumption has shown incessant growth worldwide. Eventual distinctions depend on many factors, such as culture, climate, local infrastructure new technologies of services as well as physical space or distance. The development of the single mode optical Ąber (with its almost unlimited bandwidth) has opened up opportunities to mas-sive deployment of long-haul and metropolitan point-to-point (P2P) Ąber-optic networks (HARAN GLEN KRAMER; RUO DING, 2007). The use of Ąber-optic cable, rather than copper cable, resulted in three important changes (GIRARD, 2005).
❏ Massive increase of capacity ;
❏ Great improvement on quality of service (QoS).
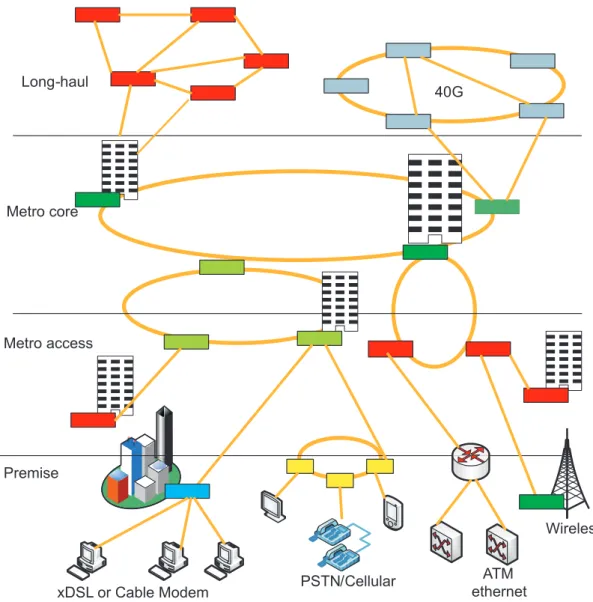
Figure 2 illustrates a typical network structure, while Figure 3 presents example of Ąber-optic P2P networks and shows some of the techniques that have been used to in-crease their capacity. Originally, a single channel was carried over each optical link. In turn, it was limited to approximately 100km with sufficient optical power. The advent of wavelength-division multiplexing (WDM) made it possible to carry many channels (using different wavelengths) over a single Ąber, without cross-interference. Next, dense wavelength-division multiplexing (DWDM) further increased this capacity, allowing for even more wavelength channels.
Long-haul
40G
Metro core
Metro access
Premise
xDSL or Cable Modem PSTN/Cellular
ATM ethernet
Wireless
Figure 2 – Terrestrial fiber-optic networks
one for downstream transmission and the other for upstream transmission. Metropolitan-area networks (MANs) are also Ąber-based and make use of lower-cost coarse wavelength-division multiplexing (CWDM) to transmit multiple channels (typically 18 over low-water-peak Ąber) per Ąber over relatively short P2P links. Although most access networks, serving small businesses and residential customers, are still copper-based, subscribers in some countries around the world have a P2P Ąber-optic connection to a central office (CO) (GIRARD, 2005).
As shown in Figure 3, this requires a dedicated optical line terminal (OLT) at the (CO). As well as a pair of optical Ąbers for each subscriber, where an optical network unit (ONU) is connected to the Ąber pair.
OLT Tx(λ1) Tx(λ2) Rx(λ2) ONT1 Tx(λ1) Tx(λ2) Tx(λ2) Access network Point-To-Point PON Subscribers CO OLT Tx(λ1) Tx(λ2) Rx(λ2) ONT1 Tx(λ1) Tx(λ2) Tx(λ2) 1 fiber pair
2 wavelengths 1310nm(voice/data)
1550nm(video)
20Km maximum distance
OLT Tx(λ1) Tx(λ2) Rx(λ2) ONT1 Tx(λ1) Tx(λ2) Tx(λ2) Up to: STM-16/OC-48
Figure 3 – Point-to-Point (P2P) optical networks
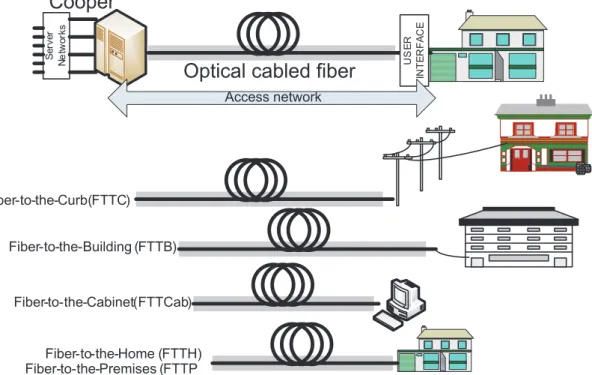
lean to prohibitive installation and maintenance costs, when compared to a traditional copper distribution network, which is getting very old and requires maintenance. Figure 4 shows different optical Ąber connections used on the access network.
Optical cabled fiber
US E R IN T E R F A C E S e rve r N e tw o rks
Cooper
Access network Fiber-to-the-Curb(FTTC) Fiber-to-the-Building (FTTB) Fiber-to-the-Cabinet(FTTCab) Fiber-to-the-Home (FTTH) Fiber-to-the-Premises (FTTPFigure 4 – Variations of the access network architecture
While also supporting P2P architecture, Ąber-to-the-home (FTTH) also known as Fiber To The Premises (FTTP) provides a point-to-multipoint (P2MP) connection that offers an attractive solution to these problems. Moreover, with FTTH P2MP PONs, there are no active components between the CO and each subscriber. This fact allows several subscribers to share the same connection. This is accomplished by using one or more passive splitters to connect, in some cases, up to 32 subscribers to the same feeder Ąber. This P2MP architecture dramatically reduces the network installation, management, and maintenance costs.
Figure 5 and Figure 6 show a P2MP PON. Each OLT at the CO is connected through a single feeder Ąber to a splitter, which in turn, is connected to all subscribers, sharing the available bandwidth. Each subscriber has a connection to a single Ąber and different wavelengths are used on this Ąber for upstream and downstream transmission of voice and data as well as downstream video transmission.
The parameters involved in the optical network design, in practice, are directly de-pendent on the spatial disposition of each optical component representation, inside the circuit, the network architecture or the topology. Different architectures exist for connect-ing a subscriber to a PON. However, each PON requires at least the followconnect-ing (Figure 7) (GIRARD, 2005):
OLT1
Tx(λ1)
Tx(λ2)
Rx(λ2)
Tree/Branch scheme
OLT2
Tx(λ1)
Tx(λ2)
Rx(λ2)
OLT3
Tx(λ1)
Tx(λ2)
Rx(λ2)
One splitter
S
p
lit
te
r
U
p
to
3
2
P
re
m
ise
s
..
..
Figure 5 – P2MP single-splitter (tree-branched) PON
OLT1 Tx(λ1) Tx(λ2) Rx(λ2) Cascade Scheme OLT2 Tx(λ1) Tx(λ2) Rx(λ2) OLT3 Tx(λ1) Tx(λ2) Rx(λ2) Different splitter combinations S p lit te r 1 x4 CO 1 x8 1 x8 1 x8 1 x8 U p to 3 2 P re m ise s
❏ Video distribution equipment also at CO;
❏ A feeder from the CO to a splitter in the P2MP PONs (The Ąber is part of a
multiĄber cable);
❏ One splitter per feeder Ąber (PONs can use multiple splitters in a cascade or tree
design topology);
❏ Distribution Ąbers and drop cables between the splitter branches and the optical
network terminals (ONTs);
❏ An ONT (ONU connected to the UNI) located at each subscriberŠs premises in
P2MP AND P2P PONs.
The feeder, splitter(s), distribution and drop cables form the optical distribution net-work (ODN) of the P2MP PON. Since PON, typically, provides service for up to 32 subscribers (BPON), many networks (each originating from the same CO) are usually re-quired to serve a community. The OLT at the CO is interfaced with the public switched telephone network (PSTN) and the internet (see Figure 7). Video signals enter the system from the cable television (CATV) head-end or from DBS satellite feed. The video sources can be converted to optical format by an optical video transmitter. Next, the signal is ampliĄed and coupled through a wide wavelength-division multiplexing (WWDM) cou-pler (not shown in Figure 7) to the optical signal form the OLT. Alternatively, the video signals can be interfaced with the OLT in digital form for IPTV or in analogue form for overlay. These signals are transmitted in upstream form to the ONTs.
Public house O N T U s e r N e tw o rk Internet ATM swith S e rv e r n e tw o rk s
CLEC Optical Cable Fiber
TV PSTN
TDM Swith Router
Figure 7 – FTTH PON basic system architecture
that point, one or more passive splitters (depending on the splitter topology) are used to connect customers. Each customer premises is provided with an ONT connected to one splitter branch. The ONT provides connections for the different services (voice, Ethernet, and video).
2.3
Passive Optical Components
The main passive components in a PON are:
❏ 1 x 2 WWDM coupler(s) (two couplers if analogue video is used in P2MP);
❏ 1 x N splitter (IN P2MP);
❏ Fiber-optic cables (feeder, distribution and drop);
❏ Connectors and cable assemblies
❏ Fiber management systems/enclosures
Details of each important component are explained in the following.
2.3.1
Optical Fiber Cable
The optical Ąber cable is another key component of a PON (P2P and P2MP). Fiber has an increased advantage over copper resulting from the physical transmission of photons instead of electrons (SALEH; TEICH, 2013). In glass, optical attenuation is much less than the attenuation of electrical signals in copper and much less dependent on signal frequency (SALEH; TEICH, 2013).
The light is "guided" down the center of the Ąber, called the "core". The core is surrounded by an optical material called the "cladding" which traps the light in the core, using an optical technique called "total internal reflection" (SALEH; TEICH, 2013). The Ąber itself is coated with a "buffer" aimed to protect the Ąber from moisture and physical damage (Figure 8).
Light Rays
Total internal Reflection
Core Cladding
Core
Cladding
Buffer
(a)
(b)
Figure 8 – a) Optical Cable perspective b) Optical Cable lateral view
2.3.1.1 Fiber Types: Multi-mode & Single-mode, Core/Cladding Size
Optic Ąber is found in two forms, multi-mode and single-mode. Within these cat-egories, Ąbers are identiĄed by their core and cladding diameters expressed in microns (one millionth of a meter), e.g. 50/125 micron multi-mode Ąber. Most Ąbers are 125 microns external diameter (a micron is one one-millionth of a meter and 125 microns is 0.005 inches- a slightly larger than the typical human hair).
Multi-mode Ąber has light travelling along the core in many rays, called modes. It has a larger core (usually 50 or 62.5 microns) which supports the transmission of multiple modes (rays) of light. Multi-mode is generally used with LED sources at wavelengths of 850 and 1300 nm for slower local area networks (LANs) and lasers at 850 (VCSELs) and 1310 nm (Fabry-Perot lasers) for networks running at gigabits per second or more.
Step index multi-mode was the Ąrst Ąber design (SALEH; TEICH, 2013). It has a higher attenuation and is too slow for many uses, due to the dispersion caused by the different path lengths of the various modes travelling in the core. Step index Ąber is not widely used. Actually, only POF and PCS/HCS (plastic or hard clad silica, plastic cladding covering a glass core) use a step index design today.
Graded index multi-mode fiber uses variations in the composition of the glass in the core to compensate for the different path lengths of the modes. It offers hundreds of times more bandwidth than step index Ąber - up to about 2 gigahertz. Two types are in use, 50/125 and 62.5/125, where the numbers represent the core/cladding diameter in microns (GIRARD, 2005).
Single-mode fiber shrinks the core down (so small) that the light can only travel in a single ray. This increases the bandwidth to almost inĄnity. However, is practically limited to about 100,000 gigahertz (which is still a considerable sum!). Single mode Ąber has a core diameter of 8-10 microns, speciĄed as "mode Ąeld diameter", the effective size of the core, and a cladding diameter of 125 microns.
Specialty Fibershave been developed for applications that require unique Ąber perfor-mance speciĄcations. Erbium-doped single-mode Ąbers are used in Ąber ampliĄers. These are devices used in extremely long distance networks for regenerating signals. Fibers are optimized for bandwidth at wavelengths appropriate for DWDM systems or to reverse chromatic dispersion. This is an active area of Ąber development.
Fiber Sizes and TypesFiber comes in two types, single-mode and multi-mode. Except for Ąbers used in special applications, single-mode Ąber can be considered as one size and type. If you deal with long haul telecom or submarine cables, it is necessary to work with special single-mode Ąbers. Multi-mode Ąbers, originally, came in several sizes, optimized for various networks and sources. However, the data industry standardized on 62.5 core Ąber in the mid-80s (62.5/125 Ąber has a 62.5 micron core and a 125 micron cladding. This is now called OM1 standard Ąber).
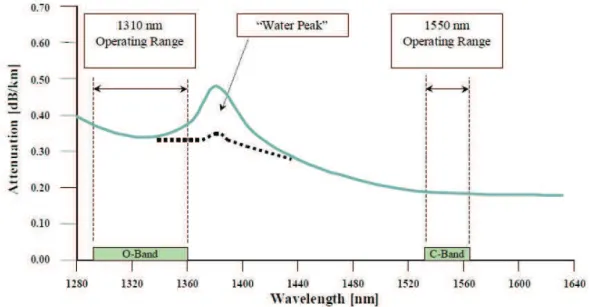
Figure 9 – Typical chromatic dispersion and spectral attenuation on FTTH PON fiber (GIRARD, 2005)
level of performance depends upon the design/operation priorities of the transmission network under consideration (YAMASAKI, 2011).
The limitations imposed by attenuation and chromatic dispersion have directly influ-enced the development of a variety of different single-mode optical Ąbers. Enhancements have been developed and have optimized performance in certain target applications. How-ever, improving the performance of one attribute, typically, places limitations on others (ALCATEL, 2009).
2.3.1.2 Fiber Specifications
The usual Ąber speciĄcations are size (core/cladding diameter in microns), attenuation coefficient (dB/km at appropriate wavelengths) and bandwidth (MHz-km), for multi-mode Ąber and chromatic polarization-multi-mode or dispersion for single-multi-mode Ąber. While manufacturers have other specs for designing and manufacturing the Ąber to industry standards, like numerical aperture (the acceptance angle of light into the Ąber), ovality (how round the Ąber is), concentricity of the core and cladding, etc., these specs do not generally affect users who specify Ąbers for purchase or installation.
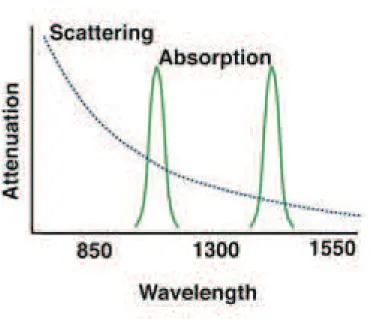
2.3.1.3 Attenuation
Figure 10 – Fiber attenuation
Primary absorbers are residual OH+(hydroxyl ions) and dopants used to modify the refractive index of the glass. This absorption occurs at discrete wavelengths, determined by the elements absorbing the light. The OH+ absorption is predominant and occurs most strongly around 1000 nm, 1400 nm and above 1600 nm (FATHALLAH; RUSCH, 2007).
The largest cause of attenuation is scattering. Scattering occurs when light collides with individual atoms in the glass and is anisotropic 1. Light which is scattered at angles
outside the numerical aperture of the Ąber will be absorbed into the cladding or trans-mitted back toward the source. Scattering is also a function of wavelength, proportional to the inverse fourth power of the wavelength of the light. Thus, if one doubles the wave-length of the light (SALEH; TEICH, 2013); The scattering losses are reduced by 2 to the 4th power or 16 times.
For example, the loss of multi-mode Ąber is much higher at 850 nm (called short wavelength) at 3 dB/km, while at 1300 nm (called long wavelength) it is only 1 dB/km. That means at 850 nm, half the light is lost in 1 km, while only 20% is lost at 1300 nm. Therefore, for long distance transmission, it is advantageous to use the longest practical wavelength for minimal attenuation and maximum distance between repeaters. Together, absorption and scattering produce the attenuation curve for a typical glass optical Ąber. Fiber optic systems transmit through the "windows" created between the absorption bands at 850 nm, 1300 nm and 1550 nm, where physics also allows one to basically fabricate lasers and detectors. Plastic Ąber has a more limited wavelength band. This limits 1 Anisotropic is the property of being directionally dependent, as opposed to isotropy, which implies
practical use to 660 nm LED sources.
The general critical issues related to a Ąber can be divided into two categories as follows:
Optical:
❏ Absorption/attenuation;
❏ Chromatic dispersion and polarization mode dispersion (CD and PMD);
❏ Non-linear effects and
Mechanical:
❏ Bending;
❏ connection/joint;
The Ąber used for PONs is the single-mode dispersion unshifted Ąber, based on ITU-T Recommendation G.652 or IEC 60793-2 Ed 2 (IITU-TU G.652, 2009). Non-linear effects (NLEs) can be a problem in Ąber optical cables in PONs using high-power video signals at 1550nm. These are due to changes in the ĄberŠs dielectric properties (index of refraction) or simulated scattering when using a very high electric Ąeld. In other words: the higher the optical power levels (at constant surface area), the higher the electric Ąeld. However, when a certain input intensity is reached, the output intensity will follow a non-linear curve, thus it no longer increases linearly. This particular input intensity is called the non-linear threshold. The Ąeld intensity for a given power level is greater with a smaller Ąber core. Longer Ąber lengths decrease the threshold for NLE. Table 1 presents how the Non-Linear Effects (NLEs) affect PONs. The most detrimental effect comes from the Brillouin stimulated scattering, which is due to the very high power used in overlaid analogue video transmission. Digital IP video should dramatically decrease this effect.
Table 1 – General non-linear effects and how they affect PONs.
Phenomenon Name Nature Applicability Remarks
Index of Refraction
SPM 1Ú Maybe 1550nm
XPM NÚ Ű WWDM
4WM NÚ Ű WWDM
Stimulated scattering Brillouin 1Raman Ú1 i-1Ú j Expected 1550nm
Ú-BB Ű 1550-1600
2.3.1.4 Mechanical Issues
As for mechanical aspects, they too can potentially affect the performance of a PON. The main issues are:
❏ Bending (micro-bending, macro-bending);
❏ Discontinuities/gaps/voids;
❏ Misalignments/mismatches;
❏ Cracks/angular or straight breaks;
❏ Dirt in connections;
❏ Fiber melt/fusion splicing;
When the Ąber bends too much, the angle of total internal reflection between the Ąber core and the cladding is no longer met. Thus, since the angle of total internal reflec-tion is what ensures the effective propagareflec-tion of light inside the core, macro-bending can be a major issue as it will reduce the optical energy of the signal. Longer wavelengths around (1625 nm and 1650 nm) are more sensitive to macro-bending than shorter wave-lengths. Micro-bending, is a microscopic bend in the Ąber core and is a possible cause of polarization mode dispersion (PMD) in the optical Ąber. The discontinuities, gaps, voids, misalignments, mismatches, angular faults, cracks and dirt typically occur during the connection of two Ąbers. All of the above cases affect the signal travelling through an optical Ąber and they mostly occur where human intervention is required (e.g., when joining a Ąber). In addition, if extremely high optical power is used, localized laser heat-ing may occur and potentially, generate a thermal shock-wave back to source (SALEH; TEICH, 2013). At 1 m/s, the wave produces effects balanced between thermal diffusion and light absorption: thermal lensing caused by the periodic bubbling effect.
2.3.1.5 Cable Construction
by the relevant ITU-T recommendation (GIRARD, 2005). The optical and geometri-cal characteristics are little affected by the process of wiring, which gathers prominently featured recommendations for long-span transmission installations. Optical cables are designed to protect the optical Ąbers from damage, which can occurs due to the rigours of installation and from the demands of the surrounding environment. However, no single optical cable design is universally superior in all applications. To meet application-speciĄc requirements, outside plant (outdoor), indoor/outdoor cables and inside plant (indoor) cables must be designed for their intended installation environment. The consequences of optimizing a cable design for outdoor use can prove counter productive to meeting the requirements for indoor placement and vice versa. For example, the most popular cable jacket material for outdoor use will not pass flame-resistance tests required for placement indoors (GIRARD, 2005). In general, optical cables installed in an outdoor environment are exposed to more severe mechanical and environmental conditions than cables installed in the protected, climate-controlled, indoor environment. Outdoor instal-lations (usually lashed aerially, pulled through ducts or directly buried in the ground) are subjected to combinations of ultraviolet (UV) radiation, standing water, cable-gnawing rodents, extreme temperatures, and other hazards speciĄc to outdoor deployment. Indoor installations (horizontal, riser, or plenum applications) must conform to building codes and be flame retardant. Cables designed for indoor/outdoor applications strike a perfor-mance compromise between dedicated indoor and outdoor cables. Indoor-outdoor cable designs provide flexibility for utilizing one cable design but are more expensive and should only be utilized in transition applications to link dedicated outdoor cables with dedicated indoor cables. At a minimum, there are at least three different cable products necessary to construct the physical plant of the network design depicted. First, a higher-Ąber-count cable will be required for the ŞFeederŤ and ŞDistributionŤ portions of the network to establish the optical Ąber routing from the central office/head-end to the network access point (NAP). Second, a cable containing one or two optical Ąbers will be required to link the NAP to the network interface device at the individual subcriberŠs premises. Third, an interconnect cable assembly of some type will most likely to be required to link patch panels in the CO/HE.
The optical cable serves two functional roles which are vital to the deployment and durability of the optical Ąber in the Ąeld. Some of the most signiĄcant basic cable design elements include the following:
❏ IdentiĄcation and organization;
❏ Tensile strength;
❏ Resistance to mechanical stress (bend, impact, compression, twist);
❏ Water blocking protection (outside applications);
❏ Resistance to outdoor environmental hazards Ű ultraviolet (UV) radiation, rodents,chemicals
and lightning (outside applications);
❏ Flame retardants (inside applications).
2.3.2
Optical Fiber Connectors
According to Telcordia GR-326, Generic Requirements for Single-Mode Optical Con-nectors and Jumper Assemblies, optical Ąber conCon-nectors are used to join optical Ąbers where a connect/disconnect capability is required. The basic connector unit is a con-nector assembly. A concon-nector assembly consists of an adapter and two concon-nector plugs. Due to the sophisticated polishing and tuning procedures that may be incorporated into optical connector manufacturing, connectors are generally assembled onto optical Ąbers at a supplierŠs manufacturing facility. However, the assembly and polishing operations involved can be performed in the Ąeld, for example, to make cross-connect jumpers to size (HAYES, 2009). An optical Ąber connector joins two ends of an optical Ąber, and enables quicker connection and disconnection than splicing. The Ąber endfaces of the two connectors are pressed together, resulting in a direct glass to glass or plastic to plastic contact, avoiding any glass to air or plastic to air interfaces, which would result in higher connector losses (KEISER, 2003). Fiber optic connectors can be divided into three groups: simplex, duplex and multiple Ąber connectors. Simplex connector means only one Ąber is terminated in the connector. Simplex connectors include FC, ST, SC, LC, MU and SMA. Duplex connector means two Ąbers are terminated in the connector. Duplex connectors include SC, LC, MU and MT-RJ. SC, LC and MU connectors have both simplex and duplex version. Multiple Ąber connector means more than two Ąbers (for up to 24 Ąber) are terminated in the connector. These are usually ribbon Ąbers with Ąber counts of 4, 6, 8, 12 and 24. The most popular ribbon Ąber connector is the MT connector. In PON applications, high-power analogue video signal is carried, therefore the APC connector is required. The APC connector is an angled (8 degrees) connector and as such provides very low reflection (ORL) 65 dB or better.
2.3.2.1 Enclosures
There are a number of enclosures used in PONs:
❏ The splitter enclosure;
❏ The splice enclosure;
Fiber Distribution Hub S p lit te r
Up to 32 1 2 32 1550nm 1550nm 1550nm 1550nm 1490nm 1490nm 1490nm 1490nm 1310nm 1310nm 1310nm 1310nm 1310nm
Figure 11 – Bidirectional 1 x N PON splitter
There are two IEC standards that are particularly important for enclosures: IEC 61758-1 Ed.1.0, interface standard for closures, General & Guidance, and IEC62134-1, Fibre-optic enclosures, Generic SpeciĄcation (IEC 61758-1, ).
2.3.3
Splitter
The Splitter (as Shown in Figure 11) is a bidirectional broadband branching device that has one input port and multiple output ports. The input (downstream) optical signal is divided among the output ports, allowing multiple users to share a single optical Ąber and consequently share the available bandwidth of that Ąber. In the upstream direction, optical signals form a number of ONTs, which are combined into the single Ąber. Splitters are passive devices due to the fact they require no external energy source other than the incident light beam. These are classiĄed as broadband and only add losses principally due to the fact that they divide the input (downstream) power. Splitter loss is usually expressed in dB and depends mainly on the number of output ports (about 3 dB for each 1 x 2 split).
It should be noted that, contrary to what one might expect, the splitter adds ap-proximately the same loss for light travelling in the upstream direction as it does for downstream direction.
There may be one splitter of several cascaded splitters in an FTTH PON, depending on the network topology (See Figure 5 and Figure 6). ITU-T Recommendation G.983 currently allows split ratios up to 32 (ITU G.983.1, 2005), whereas Recommendation G.984 extends this up to 64 splits (ITU G.984.1, 2008). Splitters can be packaged in different shapes and sizes depending on the basic technology used. The most common types are the plans wave guide (typical used for high split counts) and the fused tapered (FBT) Ąber couples (typically used for relatively low split counts). Figure 12 illustrates the FBT Ąber technology. The amount of light coupled varies with the core-to-core proximity (1), the interaction length (2) and phase B (3).
Fused Biconic Taper (FBT) Fiber
Input
Fused Biconic TaperOutput
1
2
x
3
= kn
Figure 12 – Splitter design based on fused bi-conic tapered fiber (FBT)
splitter supports one port at one end and up to N ports at the other end. Typically, the maximum number of ports is 64. Therefore, a signal sent from one end, can be distributed to 64 possible customers, simultaneously. This application is ideal for video distribution (GIRARD, 2005). For data and voice, the use of time division multiple access (TDMA) enables customers to receive and send exactly what they choose, without knowing, what other customers are receiving and sending. Additional technologies, such as WDM PON, are under investigation for point-to-multipoint networks (GROBE; ELBERS, 2008). The most attractive alternative is wavelength division multiple access (WDMA), which dedicates a particular wavelength to each customer. A splitterŠs (Figure 3) primary beneĄt is its nature as a passive component, requiring no maintenance and no power activation. However, its primary drawback is high rate of insertion loss. Insertion loss is deĄned as 10*log (1/n); where n is the number of ports (2 to 64). Table 2 shows the expected insertion loss that corresponds to a speciĄc number of ports.
Table 2 – Number of ports/Insertion loss relation
Number of Ports Insertion Loss (dB)
2 3
4 6
8 9
16 12
32 15
64 18
LCD
DISPLAY
CONTROLER
LASER DIODE
DETECTOR
COUPLER-SPLITTER
FIBER UNDER TEST
light flow
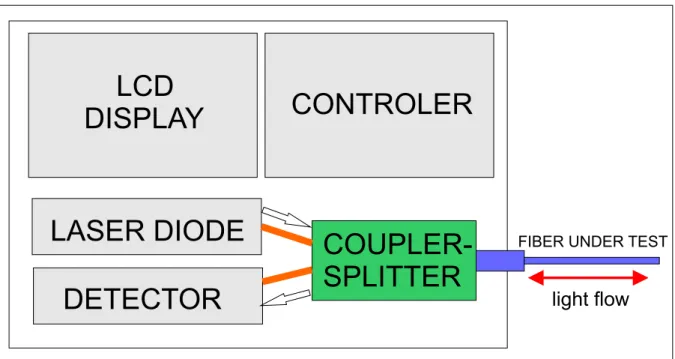
Figure 13 – OTDR Block Diagram
output makes the OTDR signature ambiguous. Due to the combination of the scattered light into a single composite waveform, it is very difficult to associate events on the output side of the splitter to its respective branch.
2.4
OTDR Concepts
An OTDR is composed of a laser source, an optical sensor, a coupler/splitter, a display section, and a controller section as presented in Figure 13. A laser diode sends out pulses of light on command from one controller, adjusting the duration of the pulse (Pulse Width) for different measuring conditions. The light goes through the coupler-splitter and into the Ąber under test (FUT). The coupler-splitter has three ports, one for the source, the Ąber under test, and the sensor. This device allows the light to travel only in speciĄc directions: from the laser source to the Ąber under test. Also from the Ąber under test to the sensor. Thus, pulses from the source go out into the Ąber under test and the returning Backscatter and Fresnel reflections are routed to the sensor (SIMARD, 2009).
The objective of the OTDR measurement is to determine the backscattering impulse response of the Ąber under test. The OTDRŠs pulse approximates an ideal delta-function impulse rather than being a perfect copy of it. The result of a convolution with a Ąnite pulse leads to a smoothed version of the impulse response (ANDERSON; BELL, 2004).
mea-Km Noise
Fiber End
Backsatter Connector Pair
Fusion Splice Connector Pair Front Connector
Bend Crack
0 10 30
-25 -10 dB
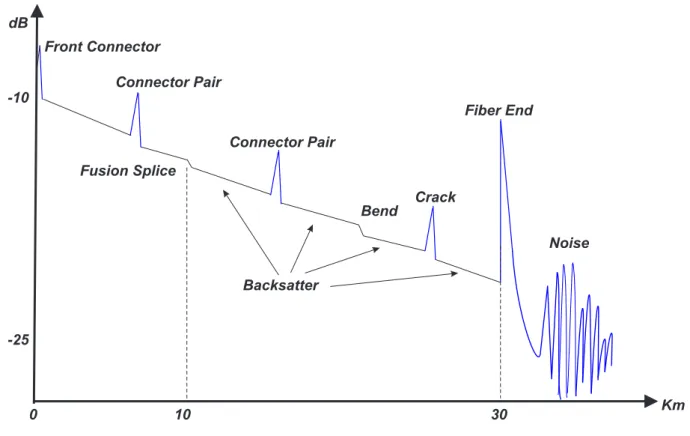
Figure 14 – Typical OTDR trace
sured response exhibits three types of features: (1) straight lines caused by distributed Rayleigh backscattering, (2) positive spikes caused by discrete reflections and, Ąnally (3) steps that can be positive or negative depending on physical Ąber properties (AK-WANIZAM, 2009).
The Ąrst event from left to right is the reflection of the front connector that matches the OTDR to the Ąber under test. As this reflection covers the near-end measurement zone, it is an undesirable event that hides information concerning the Ąber to be tested. A clean high-quality connector with low reflectance is mandatory to achieve best results. A bad connector not only decreases launch power by insertion loss, but also causes the returning light to be re-reflected back into the Ąber under test again, generating multiple echoes of ghost patterns. The trace is plotted as power vs. distance and the slope of the straight lines gives the Ąber attenuation in dB/Km. Fusion splices and bends show only insertion loss without a reflection. These are called non-reflective events.
Backscatter Dopant Particle
Light Pulse Hits Dopant Particle Weaker After Scattering
Figure 15 – Rayleigh Scattering
power level.
2.4.1
Rayleigh Scattering
Rayleigh scattering refers to the scattering of light off the air molecules and can be extended to scattering from particles up to about a tenth of the wavelength of the light. The blue color of the sky is caused by the scattering of sunlight by the molecules of the atmosphere (CLAYS; PERSOONS, 1991). The scattering is more effective at short wavelengths (the blue end of the visible spectrum). Thus the light scattered down to the earth at a large angle with respect to the direction of the sunŠs light is predominantly at the blue end of the spectrum (TSUJIKAWA et al., 2007). This effect can be considered to be elastic scattering, since the photon energies of the scattered photons is not changed. Clouds, in contrast to the blue sky, appear white to achromatic gray.
When a pulse of light is sent down to a Ąber, a part of the pulse runs into microscopic particles (dopants) in the glass and becomes scattered in all directions. About 0.0001% is scattered back in the opposite direction of the pulse and it is called backscatter Figure (15). Since the dopants in optical Ąber are uniformly distributed throughout the Ąber, due to the manufacturing process, this scattering effect occur along its entire length. Longer wavelengths of light exhibits less scattering than shorter wavelengths.
2.4.2
Fresnel Reflection
Whenever light is travelling in a material (such as an optical Ąber), it encounters a different density material (such as air). Some of the light up to 4% is reflected back towards the light source while the rest continues out of the material (BESPROZVAN-NICH; NABOKA, 2000) 16. These sudden changes in density occur at the ends of Ąbers, or at Ąber breaks and sometimes at splice points. The amount of reflection depends on the magnitude of change in material density described by the Index of Refraction IOR (JUDD, 1979). Larger IOR means higher densities and the angle that the light spikes the interface between the two materials is also higher.
Fiber Core
Light Pulse
Reflection
Figure 16 – Fresnel Reflection
the OTDR measures only the backscatter level and not the level of transmitted light, there is a very close correlation between the backscatter level and the transmitted pulse level. The backscatter light is a Ąxed percentage of transmitted light. The ratio of the backscattered light is also known as backscatter coefficient. If the amount of the trans-mitted light drops suddenly from a Point A to a Point B in the Ąber (caused by a tight bend, a splice between two Ąbers or by a defect), then the corresponding backscatter from Point A to Point B will drop by the same amount. The same loss factors that reduce the levels of a transmitted pulse will show up as a reduced backscatter level from the pulse.
2.4.3
Dead Zones
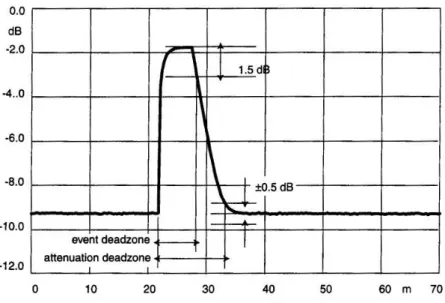
Dead zones are related to the presence of reflections when the reflected signal satu-rates the OTDR receiver (DERICKSON, 1998). The receiverŠs electronic circuit is slow to recover its sensibility, after the saturation results in information loss. If the receiver satu-rates due to strong signals, it will take some time to recover from this overload condition. Consequently, the measured Ąber response is superimposed by the receiverŠs overload behaviour, yielding a distinct Ąber segment covered by an exponentially diminishing tail. A Dead zone is classiĄed in two ways. Firstly, an "Event Dead Zone" is related to a reflective discrete optical event. In this situation, the measured dead zone will depend on a combination of the pulse length and the size of the reflection resulting in a distance between the beginning of a reflection and the -1.5 dB point on the falling edge of the reflection as indicated in Figure 17. After the event dead zone, an adjacent reflective event can clearly be recognized.
Figure 17 – Attenuation and event dead zone
Commonly, a 35dB reflection is used for dead zone speciĄcations, in other words, about 0,03% of optical power at this point is reflected and superimposed with backscattered light Ű the power level which is a function of the chosen pulse width. Therefore, the actual height, seen on the OTDR display, depends upon both reflectance and pulse width, for a given Ąber. Note that very short width pulses do not necessarily lead to shorter dead zone attenuations. This is related to the fact that as the pulse gets narrower, the difference between the backscatter level and the top of the reflection increases. With a Ąnite receiver bandwidth, the exponential tail of the falling edge adds, signiĄcantly, to the dead zone.
2.5
Constraint Management
The word constraint has several connotations. It has been taken to mean a relation over a Cartesian product, a Boolean predicate, a fuzzy relation, a continuous Ągure of merit analogous to energy and various other arbitrarily complex symbolic relationships. A concise deĄnition is given by (STEPHANOPOULOS, 1987): "A constraint is a relation stating what should be true about one or more objects".
Engineering Design is constraint-oriented (LAMOUNIER, 1996). Much of the design process involves the recognition, formulation and satisfaction of constraints. Serrano (SERRANO, 1987) deĄnes a constraint as a requirement that restricts a component or component relationships, where component and object are taken to mean the same.
uniformly introduced and used in various directions on the knowledge available in the system.
Geometric constraints are relationships between two different geometric entities (e.g. the relationship between a tangent line and a circle). On the other hand engineering constraints are equations used to represent basic principles of engineering, as the power loss in the optical Ąber. FTTH PON optical networks architecture have its speciĄc con-straints specially deĄned in this thesis. The following section shows how this constraint architecture has been deĄned by means of the proposed solution. More details about design constraint management can be found at (LAMOUNIER, 1996) , (SILVA, 2006) and (LIMA, 2008).
2.5.1
FTTH PON Design Constraints
For FTTH Network Design, the Geometric Constraints are the existing relationships between two different geometric entities. Engineering Constraints are equations that rep-resent the physical concepts of electronic components (e.g., Optical Power, Optical Cable loses, Optical Connectors, Splitters, interferences, noise frequencies Ąlters, etc). Both con-straints can be seen as a unique set of equations (LIMA; JUNIOR, 2010). The possibility, of modifying some parameters and to propagate them upstream and downstream over an electronic cable network must be considered. This automation is related to algebraic manipulations (Solution of constraint sets) required by the user. The hybrid constraints concept is the ideal solution as a method for solving the system of equations and ge-ometric constraints. These systems rely on numeric and interactive solving techniques (LAMOUNIER, 1996). Graph-based models can decompose the equations into smaller sets in order to achieve a more efficient equation solution set. The concept of coupled constraints, allow direct manipulations of under-constrained FTTH PON network param-eters. The next section, shows the characterization of constraint-based approaches for the OTDR signal and the physical coupling constraint network distribution both into a single platform.
2.5.2
The Constraint Data Model for FTTH PON Network
Figure 18 shows a constraint representation of the Optical Cable and one Splitter. In the FTTH Schema on the left, the physical representation for the connection between one Optical Feeder to a splitter by optical cables to the optical cable C1, is presented.
C1 S1 S2
Spli! er
Central Office
(a) FTTH – Schema (b) Geometric Graph
E1 EN
E3 OTDR Trace
(c) Equa$on Graph Op$cal
Branches
Op$cal Feeder
Figure 18 – Graph representation of an Optical Cable and a Splitter.
The Geometric Graph is manipulated by the user inside a CAD environment, using a graphical interface (GUI) and for example, when some graphical parameter is modiĄed, it provokes a modiĄcation on the equation graph in a synchronous form. So that the User will watch, at the same time, two different worlds, one being the physical world represented by computer graphics environment and the other is the "optical world", represented by the OTDR data measurements, controlled by the Equation Graph.
2.6
Concluding Remarks
The purpose of this chapter was to provide an overview of the fundamentals of FTTH PON technology, explaining the technical characteristics and network architectures, de-scribing the basic concepts employed herein and the prerequisites for understanding the assumptions used in the proposed experiments and in software development.
Chapter
3
Related Work
3.1
Introduction
To support this work and identify the features of interest in the Ąeld of research, we conducted a literature review with recently published works related to FTTH PON monitoring and strategies used to detect degradations and faults in the Ąber network. This should not be considered an exhausted list, however, we focus on research results that mainly propose tools for computational simulation.
3.2
Events Detection in Optical Fiber Networks
The FTTH business needs new network maintenance technologies that can, econom-ically and effectively, cope with the massive FTTH Ąber plants that are yet to come. Liu, Fenglei and Zarowski, Christopher J. (LIU; ZAROWSKI, 2001) propose a method for detecting and locating connection splice faults (events) in Ąber optics by digital signal processing (DSP) of noise on optical time-domain reflectometry (OTDR) data. This is motivated by the fact that as Ąber becomes more widely adopted as a communications medium, methods of automated fault detection/location will become more important. The approach taken uses Gabor series expansion coefficients to coarsely localize the faults (FEICHTINGER; STROHMER, 2002). Due to the presence of measured noise, these coefficients are random variables, and it is the Gabor coefficients with a non-zero mean that determine fault presence and location. Coefficients with non-zero mean are found with the aid of the Rissanen minimum description length (MDL)criterion for model order estimation (RISSANEN, 1983). The results show that the method is able to distinguish connection splice events from noise and the Rayleigh component in the OTDR data (Fig-ure 19).
Figure 19 – Algorithm results over a loud OTDR Signal (LIU; ZAROWSKI, 2001)
to achieve a greater accuracy in event position estimation. It is based on the matched subspace detection theory of Scharf and Friedlander (SCHARF; FRIEDLANDER, 1994). Kim (KIM et al., 2008) presents a method for calculating the attenuation factor and de-tecting the reflective and non-reflective events using the Kalman Ąlter (WELCH; BISHOP, 1995). For data whose signal-to-noise ratio is sufficiently high, they propose a second or-der linear model by approximating the measurement data, after the logarithm is applied. In this work, we design the optimal and suboptimal linear Kalman Ąlters based on this model. Through a representative experiment, the proposed method is veriĄed to pre-cisely calculate the attenuation factor and detect the events with minimal computational resources.