Protein deficiency balance as a predictor of
clinical outcome in hereditary spherocytosis
Hereditary spherocytosis (HS) is the most common non-immune hemolytic anemia affecting one in 2500 individuals of northern European ancestry (1). Mutations affecting the genes SPTA1, SPTB,
ANK1, SLC4A1 and EPB42, encoding for the
erythrocyte membrane proteins spectrin a-chain, spectrin b-chain, ankyrin, the anion exchanger 1 (band 3) and protein 4.2, respectively (2), may underlie the disease. The mode of inheritance of HS is often described as autosomal dominant (about 75% of HS cases), recessive or non-dominant. A spontaneous de novo mutation is one of the mechanisms that causes non-dominant HS (3–6).
Clinical and laboratory presentation of HS is highly heterogeneous, ranging from an asympto-matic condition to a severe life-threatening anemia with transfusion dependence (7). The common features of HS include mild anemia, jaundice and splenomegaly. The presence of spherocytes in the
peripheral blood smear, the increase in the osmotic fragility of red blood cells (RBC) and in reticulo-cyte count, are the key diagnostic features of HS (8). According to hematological and clinical pres-entation, HS is usually classified as mild, typical or severe (9).
The red blood cell membrane is a complex struc-ture comprising a lipid bilayer, integral membrane proteins and the skeleton. The vertical and hori-zontal interactions between membrane constituents account for the integrity, strength, and deforma-bility of the cell. Disruption of vertical interactions because of membrane protein deficiencies favor membrane vesiculation with loss of surface area and development of spherocytic cells. The increas-ing rigidity of the cell membrane leads to premature spleen sequestration and destruction of sphero-cytes. Therefore, partial or total spleen removal usually improves anemia in the majority of HS Rocha S, Rebelo I, Costa E, Catarino C, Belo L, Castro EMB, Cabeda
JM, Barbot J, Quintanilha A, Santos-Silva A. Protein deficiency balance as a predictor of clinical outcome in hereditary spherocytosis.
Eur J Haematol 2005: 74: 374–380.Blackwell Munksgaard 2005.
Abstract: Vertical and horizontal interactions between membrane constituents account for integrity, strength and deformability of the erythrocyte. Disruption of vertical interactions caused by membrane protein deficiencies in hereditary spherocytosis (HS), favor membrane vesiculation with development of spherocytic cells. Our aim was to evaluate the hematological and clinical presentation of HS according to the type and amount of protein deficiency. We studied 81 Portuguese individuals, 71 belonging to 21 families plus 10 unrelated subjects, and found that 51 of them were HS patients. Patients were classified as presenting mild, typical or severe HS, according to laboratory results and clinical follow-up. We performed screening tests and the stan-dardized electrophoretic membrane protein analysis to identify and quantify protein deficiencies. We found band 3 and ankyrin deficiencies as the major causes for HS. The ratios between the value of the primary and/or secondary protein deficiencies showed significantly different values according to the severity of HS, and a significant inverse corre-lation with the severity of HS was observed. In mild HS, the ratios between protein deficiencies reflected equivalent protein deficiencies, while an unbalance was observed in typical HS, which was enhanced in severe HS. Our data suggest that the relative quantification of each major membrane protein and of the ratios between the values of protein deficiencies may be helpful in providing additional data about the clinical outcome of HS.
S. Rocha1, I. Rebelo1,2, E. Costa3, C. Catarino1,2, L. Belo1,2, E. M. B. Castro1,2, J. M. Cabeda4, J. Barbot3, A. Quintanilha1,5, A. Santos-Silva1,2 1Instituto de Biologia Molecular e Celular, Universidade
do Porto, Porto, Portugal;2Faculdade de Farmcia,
ServiÅo Bioqumica, Universidade do Porto, Porto, Portugal;3Hospital CrianÅas Maria Pia, ServiÅo
Hematologia, Porto, Portugal;4Hospital Geral
S. Antnio, Unidade Biololgia Molecular, Porto, Portugal;5Instituto CiÞncias Biomdicas Abel Salazar,
Universidade do Porto, Porto, Portugal
Key words: hereditary spherocytosis; erythrocyte; erythrocyte membrane proteins; HS clinical outcome
Correspondence: Alice Santos Silva, ServiÅo de Bioqumica, Faculdade de Farmcia, Rua Anbal Cunha, 164, 4099-030 Porto, Portugal
Tel: +351 22 2078906/7 Fax: +351 22 2003977 e-mail: [email protected]
Accepted for publication 11 November 2004
patients by reducing the spherocytic cell removal (10).
Hereditary spherocytosis is not caused by a single gene defect. The identification of protein deficiency by electrophoresis of erythrocyte membrane pro-teins on polyacrylamide gel in the presence of sodium dodecyl sulfate (SDS-PAGE) must be performed prior to a DNA analysis, as the result would indicate the gene(s) most likely affected in an individual (11). A primary protein deficiency may occur isolated or it may impose deficiencies in one or more proteins (secondary deficiencies). The knowledge of the usual secondary protein deficien-cies associated with the primary protein deficiency may be, therefore, of particular relevance. For instance, in ankyrin deficiency, an associated retic-ulocytosis masks this primary protein deficiency, and only the secondary protein deficiency in spec-trin and, sometimes, also in protein 4.2, reflect that deficiency (8, 12–14).
It seems reasonable that the type and amount of secondary protein deficiencies may be involved in the hematological and clinical outcome of the disease, as an unbalance between protein deficien-cies may account for an enhancement in membrane destabilization.
We report a clinical, biochemical and hemato-logical study performed in 81 Portuguese individ-uals. Our aim was to identify and quantify the protein deficiencies underlying HS, and to study the hematological and clinical heterogeneity associated with the protein deficiencies, as this could be helpful in providing additional data about the clinical presentation of the disease.
Materials and methods
Subjects
We studied 81 individuals from the north of Portugal, 71 belonging to 21 families plus 10 unrelated subjects. All gave their informed consent to participate in this study. At the beginning of this study, some patients had already been diagnosed as HS patients; however, the familiar studies and the electrophoretic analysis to identify and quantify the underlying membrane protein deficiency had never been performed.
The patients were diagnosed and classified as presenting mild, typical or severe HS, according to hematological, biochemical (bilirubin levels) and clinical follow-up after HS diagnosis. Patients with the mild form of the disease were asymptomatic, showing a mild compensated hemolysis. Typical HS patients presented a mild to moderate anemia because of uncompensated hemolysis. The severe form of HS presented a transfusion-dependent
anemia. The hematological and biochemical criteria used for classification are referred in Gallagher and Forget (1).
Among the 81 subjects, we found 20 adults (nine had been splenectomized) and 31 children (six had been splenectomized) to be HS patients. Three HS patients, classified as mild, had been splenectom-ized in adulthood, as they developed a symptomatic vesicular litiasis. Three severe HS patients had not undergone splenectomy, as their age was not compatible with that procedure.
The hematological and biochemical values of patients at the time of blood collection are presen-ted. In the case of severe HS patients, there was no contamination with transfused blood, as the last transfusion took place at least 4 months before the collection of blood for our studies.
Fifteen of the studied individuals (13 adults and two children) were used as controls for basic hema-tological studies and for bilirubin levels, since they presented normal clinical and laboratorial findings and belonged to the families with a dominant pattern of inheritance for HS. The controls used for the electrophoretic analysis of RBC membrane proteins were from healthy blood bank donors.
Assays
Blood samples [ethylenediaminetetraacetic acid (EDTA) and heparin as anticoagulants] were col-lected and processed for the hematological and biochemical analysis, and to prepare the erythro-cyte membranes. We evaluated the RBC count, hemoglobin concentration, the red cell distribution width (RDW) and the hematimetric indices by using an automatic blood cell counter (Sysmex K1000; Sysmex, Hamburg, Germany). The search for spherocytic cells was performed in Wright stained blood films (15). Reticulocyte count was performed by microscopic counting on blood smears after vital staining with new methylene blue (reticulocyte stain; Sigma, St Louis, MO, USA). Osmotic fragility test was carried out on fresh blood and after 24 h of incubation at 37C (16). Serum concentration of total bilirubin was meas-ured by routine biochemical procedures. To exclude immune hemolysis, a direct antiglobulin test was performed for all cases studied (17).
two washes, with a final concentration of 0.1 mm. The protein concentration of the RBC membrane suspensions was determined by the Bradford’s method (19).
The electrophoretic analysis of the red cell mem-brane proteins was carried out on a discontinuous system of polyacrylamide in the presence of sodium dodecylsulfate (SDS-PAGE), using a 5–15% linear acrylamide gradient gel and a 3.5–17% exponential acrylamide gradient gel, according to the Laemmli and Fairbanks methods, respectively (20, 21). The proteins were stained with Coomassie brilliant blue, and scanned (Darkroom CN UV/wl, BioCaptMW version 99; Vilber Lourmat, Marne-La-Valle´e, France). The relative amount of each major protein (as a percentage of total), was quantified by densi-tometry (Bio1D++ version 99; Vilber Lourmat, France).
The electrophoretic analysis for each RBC mem-brane sample was performed in duplicate gels, and, in each gel, duplicates of each sample were loaded alongside with six reference samples (from healthy blood bank donors). The mean values presented by the studied subjects were compared with those presented by the reference samples. Protein defici-ency was considered significant whenever the mean value of that protein was lower than the mean value minus 2·standard deviation (SD) presented by the reference samples for the same protein (subject mean protein % value < control mean protein % value )2·SD). Moreover, the ratios between
membrane protein values, for patients and controls, were evaluated.
Statistical analysis
Measurements are presented as mean ± SD or as median values (inter-quartile range). For statistical analysis, we used the Statistical Package for Social Sciences, version 12.0. To evaluate the differences
between groups, we used the Student’s t-test whenever the parameters presented a Gaussian distribution and the Mann–Whitney test in the case of a non-Gaussian distribution, as for bilirubin values. Spearman’s rank correlation coefficient was used to evaluate relationships between sets of data. A P-value of <0.05 was considered as statistically significant.
Results
Patients were diagnosed and classified as presenting mild, typical or severe HS, according to hemato-logical and biochemical data and to their clinical history (1). We diagnosed 51 subjects as HS patients, of the 81 studied subjects. The other 30 individuals showed normal clinical and laboratory findings (hematological, biochemical and electro-phoretical analysis of membrane proteins).
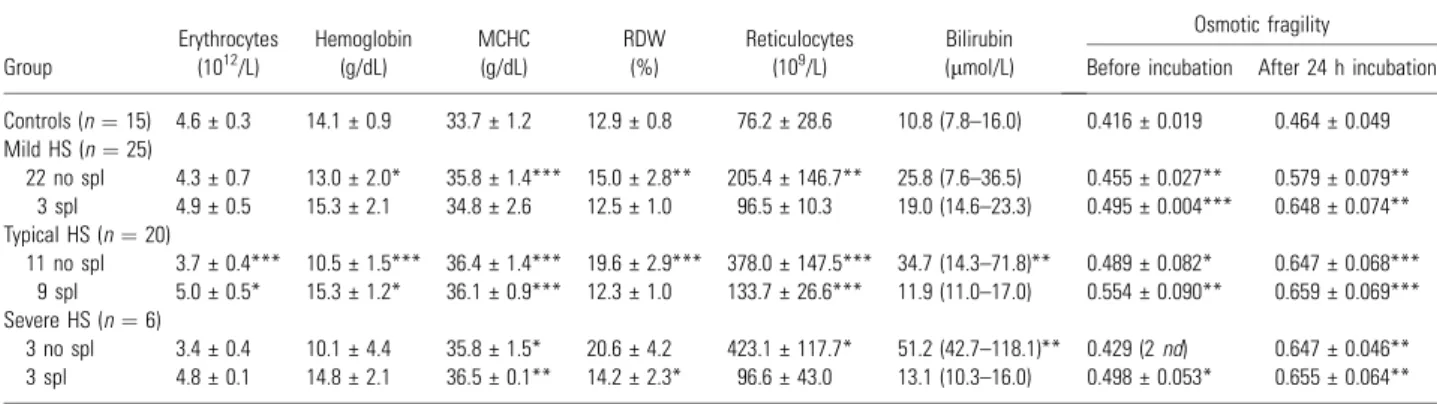
In Table 1, we present the biochemical and hematological values for controls and HS patients, according to the severity of the disease. For each group we present the results for splenectomized and unsplenectomized patients. Worsening of HS was associated with a reduction in RBC count, hemo-globin concentration, and a rise in RDW, reticulo-cyte count, osmotic fragility and total bilirubin concentration. When compared with controls, all HS patients showed a significantly higher mean cell hemoglobin concentration (MCHC), RDW, reticu-locyte count and osmotic fragility.
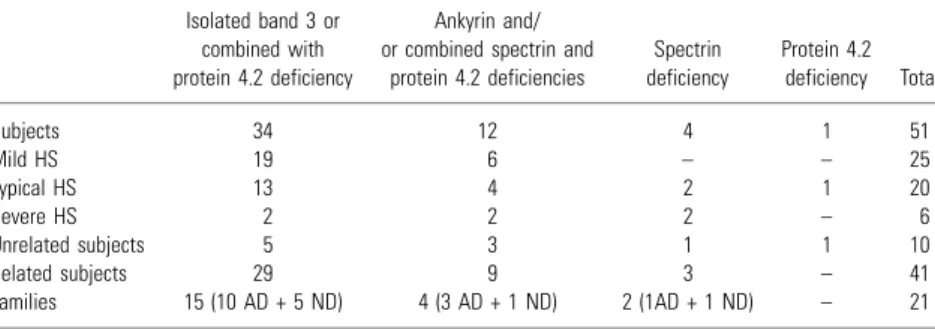
Twenty-five HS patients (49%) were classified as presenting mild HS, 20 (39%) as typical, and six (12%) as severe (Table 2). The mild form of HS was observed in primary band 3 deficiency and in primary ankyrin deficiency. The typical form of HS was observed in primary band 3, ankyrin, spectrin or in protein 4.2 deficiencies. The severe form of HS was observed in primary deficiencies in band 3, ankyrin or spectrin.
Table 1. Hematological and biochemical data for controls and HS patients according to severity of HS
Group
Erythrocytes (1012/L)
Hemoglobin (g/dL)
MCHC (g/dL)
RDW (%)
Reticulocytes (109/L)
Bilirubin (lmol/L)
Osmotic fragility
Before incubation After 24 h incubation
Controls (n¼15) 4.6 € 0.3 14.1 € 0.9 33.7 € 1.2 12.9 € 0.8 76.2 € 28.6 10.8 (7.8–16.0) 0.416 € 0.019 0.464 € 0.049
Mild HS (n¼25)
22 no spl 4.3 € 0.7 13.0 € 2.0* 35.8 € 1.4*** 15.0 € 2.8** 205.4 € 146.7** 25.8 (7.6–36.5) 0.455 € 0.027** 0.579 € 0.079** 3 spl 4.9 € 0.5 15.3 € 2.1 34.8 € 2.6 12.5 € 1.0 96.5 € 10.3 19.0 (14.6–23.3) 0.495 € 0.004*** 0.648 € 0.074** Typical HS (n¼20)
11 no spl 3.7 € 0.4*** 10.5 € 1.5*** 36.4 € 1.4*** 19.6 € 2.9*** 378.0 € 147.5*** 34.7 (14.3–71.8)** 0.489 € 0.082* 0.647 € 0.068*** 9 spl 5.0 € 0.5* 15.3 € 1.2* 36.1 € 0.9*** 12.3 € 1.0 133.7 € 26.6*** 11.9 (11.0–17.0) 0.554 € 0.090** 0.659 € 0.069*** Severe HS (n¼6)
3 no spl 3.4 € 0.4 10.1 € 4.4 35.8 € 1.5* 20.6 € 4.2 423.1 € 117.7* 51.2 (42.7–118.1)** 0.429 (2nd) 0.647 € 0.046**
3 spl 4.8 € 0.1 14.8 € 2.1 36.5 € 0.1** 14.2 € 2.3* 96.6 € 43.0 13.1 (10.3–16.0) 0.498 € 0.053* 0.655 € 0.064**
*P< 0.05; **P< 0.01; ***P< 0.001 (HS vs. control). nd, not done; spl, splenectomized.
We observed a dominant inheritance pattern for HS in 14 (67%) of the 21 studied families. In the other seven families, only molecular studies could establish whether a recessive or non-dominant pattern was present, such as a de novo mutation, as only theproposituspresented the disease.
In 18 families (of 21) the clinical presentation of the disease was similar for all members of the family. Only in three families, a different clinical presentation among family members was observed – one presenting a primary band 3 deficiency (two patients with mild HS and a third with typical HS), another family a primary ankyrin deficiency (one patient with mild HS and two with typical HS) and the other a spectrin deficiency (one patient with typical HS and another with severe HS).
The analysis of the erythrocyte membrane pro-teins on SDS-PAGE showed that 34 patients presented a primary band 3 deficiency, five un-related individuals and 29 belonging to the studied families (Table 2). The band 3 deficiency was accompanied by a secondary deficiency in protein 4.2 in 33 patients. The only case of isolated band 3 deficiency was observed in a patient belonging to a family in which all the other members presented a combined deficiency. Considering that this patient presented the lowest band 3 deficiency among the family members (data not shown), it is reasonable that a combined deficiency in protein 4.2 is prob-ably undetectable.
In 10 patients (unsplenectomized) we observed a combined deficiency in spectrin and protein 4.2, while in two patients (one was splenectomized) these protein deficiencies were also associated with ankyrin deficiency. In these 12 cases, a primary ankyrin deficiency is probably the cause for HS. Actually, the patients presenting only combined spectrin and 4.2 deficiencies showed reticulocytosis, which usually masks the ankyrin deficiency. The combined deficiencies in spectrin and protein 4.2 were observed in patients belonging to four families and in two unrelated patients. An individual from one of these families also presented ankyrin defici-ency. The same was observed in one unrelated subject.
An isolated spectrin deficiency was observed in four patients, one unrelated and the others from two families. Only in one unrelated patient, was an isolated protein deficiency in protein 4.2 observed. A further and conventional confirmation of the results concerning the primary protein deficiency was performed by evaluating the ratios between membrane protein mean values for patients and controls, namely spectrin/band 3, ankyrin/band 3, protein 4.2/band 3. In the case of isolated band 3 deficiency, all ratios were higher than controls, and when combined with protein 4.2 deficiency, the protein 4.2/band 3 ratio was similar or lower than controls. In the case of ankyrin deficiency with combined deficiencies in spectrin and protein 4.2, all three ratios were lower than controls; when presenting only combined deficiencies in spectrin and protein 4.2, only spectrin/band 3 and protein 4.2/band 3 ratios were lower than controls. For isolated spectrin and protein 4.2 deficiency, we found lower ratios of spectrin/band 3 and protein 4.2/band 3, respectively.
Considering the protein deficiency underlying the disease and the clinical classification, we observed that the group of patients showing band 3 defici-ency, isolated or combined, presented mild HS in 19 patients, while a typical form was observed in 13 cases and a severe disease in two patients. In the case of isolated spectrin deficiency, half showed typical HS and the other half a severe form of the disease. The group presenting ankyrin deficiency and/or combined spectrin and protein 4.2 deficien-cies, included six patients with mild HS, four with typical HS and two with a severe form of the disease. A typical form of the disease was observed in the patient presenting a protein 4.2 deficiency.
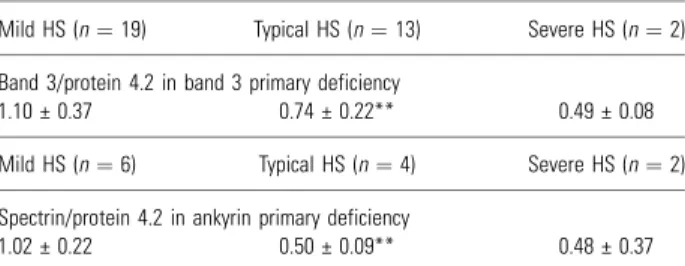
The study of the ratios between the values of the deficiencies presented by the combined deficient proteins (band 3/protein 4.2 and spectrin/protein 4.2 for primary band 3 and ankyrin deficiencies, respectively), showed significantly different values according to the severity of the disease (Table 3). In both band 3 and ankyrin primary deficiencies, the ratios between protein deficiencies in mild HS cases presented a balanced ratio (1.10 and 1.02, Table 2. Characterization of HS patients according
to the severity of the disease and the observed protein deficiencies
Isolated band 3 or combined with protein 4.2 deficiency
Ankyrin and/ or combined spectrin and
protein 4.2 deficiencies
Spectrin deficiency
Protein 4.2 deficiency Total
Subjects 34 12 4 1 51
Mild HS 19 6 – – 25
Typical HS 13 4 2 1 20
Severe HS 2 2 2 – 6
Unrelated subjects 5 3 1 1 10
Related subjects 29 9 3 – 41
Families 15 (10 AD + 5 ND) 4 (3 AD + 1 ND) 2 (1AD + 1 ND) – 21
respectively), reflecting equivalent values in protein deficiencies. In typical HS we observed significantly unbalanced ratios (0.74 and 0.50, respectively), when compared with those presented by mild HS. In severe HS cases, a trend towards even more unbalanced ratios was observed (0.49 and 0.48, respectively). In addition, we found that the ratios between protein deficiencies were significantly inversely correlated with the severity of the disease (r¼ )0.590, P < 0.001 in primary band 3
defi-ciency;r ¼)0.824, P< 0.001 in primary ankyrin deficiency).
As referred, in three families we observed a different clinical expression of HS among family members. It was interesting to find that in five of the six patients, the ratio between the value of protein deficiencies decreases according to the clinical presentation.
Discussion
Hereditary spherocytosis, an inherited hemolytic anemia, usually presents an autosomal dominant inheritance pattern. This pattern of inheritance was observed in 67% (14/21 families) of our studied families. Similar values were reported in Europeans (75%) (1, 3–5), Brazilians (64%) (22) and Mexicans (59%) (23). A lower value was reported for Koreans (31%) (24).
Seven of the studied families may present a recessive or non-dominant inheritance pattern, as only the propositus presented the disease. In these cases, only the molecular studies could clarify the inheritance pattern. Concerning the 10 unrelated HS patients studied, only a family study, eventually followed by molecular studies, could clarify their inheritance pattern.
Clinically, HS may present a broad spectrum, being usually classified as mild, typical or severe, according to clinical and analytical follow-up. About half of our HS patients presented the mild form of the disease (Table 2), while a slightly lower number of patients presented the typical form (39%). The severe form was observed in the lowest number of patients (12%). All the usual protein
deficiencies underlying HS were observed in the mild, typical and severe forms of the disease, excepting for spectrin and for protein 4.2 deficien-cies. Our results are in accordance with literature (25), showing that the same protein deficiency may account for a mild, typical or severe presentation of the disease. However, the prevalence of mild, typical and severe HS in our studied population stray from reported values, which present typical HS as the most common presentation (50–60%), followed by the mild (20–30%) and the severe form (5–7%) (8).
The hematological features used to diagnose HS include the observation of spherocytes in blood smears and an increased erythrocyte osmotic fra-gility. Some other parameters usually included in the hematologic study, are also of considerable value in the diagnosis and in the clinical classifica-tion of HS (25, 26). We found in unsplenectomized HS patients a significant increase in reticulocyte count and RDW when compared with controls, and the value of those rises seem to be in accord-ance with the severity of the disease (Table 1).
It is accepted nowadays, that the most commonly affected proteins in HS are ankyrin and band 3 protein, and less frequently spectrin and protein 4.2 (1, 4, 12, 27–30). In our HS studied patients, we also found band 3 protein and ankyrin deficiencies as the major causes for HS, followed by spectrin and protein 4.2 deficiencies (Table 2). However, in our sample population, band 3 deficiency presented a higher frequency than ankyrin deficiency. This may reflect the distribution of the ethnic groups living in the north of Portugal, although it may change as the patient group size increases.
Although the clinical severity of HS differs among families, it is quite similar within a family presenting an autosomal dominant pattern of inheritance (5, 8). We observed a similar clinical expression in 18 of 21 families. A different clinical expression was observed in individuals belonging to three families, one of them presenting a primary deficiency in band 3, another family in ankyrin and the other in spectrin.
The differences in HS clinical expression may have resulted from an heterozygous combination of interacting alleles, a common allele and a weak allele (31, 32). Clinical differences may also result from a coinheritance of another erythrocyte dis-order, able to affect the HS phenotype. Molecular studies have showed that different clinical expres-sion within a given family, for a given mutation, in apparently recessive HS could result from de novo mutations (5, 6, 29). To clarify the different clinical expression observed in the individuals of our three families, it would be necessary to perform mole-cular studies, as we did not find an association with Table 3. Ratios between the protein deficiencies in mild, typical and severe HS
caused by primary band 3 and ankyrin deficiencies
Mild HS (n¼19) Typical HS (n¼13) Severe HS (n¼2)
Band 3/protein 4.2 in band 3 primary deficiency
1.10 € 0.37 0.74 € 0.22** 0.49 € 0.08
Mild HS (n¼6) Typical HS (n¼4) Severe HS (n¼2)
Spectrin/protein 4.2 in ankyrin primary deficiency
1.02 € 0.22 0.50 € 0.09** 0.48 € 0.37
another erythroid pathology in any individual. Considering the variability of HS clinical expres-sion between families and within the same family, it would be important to foresee the protein defici-ency underlying HS, on the basis of preliminary easy, low-priced and less-time-consuming tests, such as the erythrocyte membrane protein studies instead of on the basis of expensive molecular studies. In linear and exponential gradient gels, we were able to identify and quantify the most likely primary protein deficiency and/or the secondary protein deficiencies by SDS-PAGE (10, 11). This knowledge would allow the focusing of the molecu-lar studies on the probable gene underlying HS.
When HS is caused by mutations in the ANK1 gene, thea- andb-chains of spectrin and protein 4.2 are decreased in a secondary way. In the case of HS associated with mutations in SLC4A1 gene, the primary deficiency in band 3 is often associated to a secondary deficiency in protein 4.2. A rough equivalence between the value of the primary and/ or secondary protein deficiencies has been reported (32). In the present study, we observed that a balance between the value of protein deficiencies in mild HS because of primary band 3 and ankyrin deficiencies, while in typical and severe HS a trend to an unbalance was found, suggesting the import-ance of a balimport-anced interaction between proteins in the clinical outcome of the disease (Table 3). Moreover, we found a significant negative correla-tion between the balance of protein deficiencies and the severity of the disease.
A gene mutation may impose an insufficient synthesis in mRNA or an abnormal protein synthe-sis. In the first case, the reduced protein synthesis will lead to a membrane deficient in that protein, and probably in interacting proteins, which would have not enough binding sites. Equivalent protein deficiencies in interacting membrane proteins would be observed, and the cell would present a normal interaction between the deficient proteins. However, when an abnormal membrane protein molecule is synthesized, it probably prevents a normal linkage with other interacting membrane proteins, as it may no longer have the binding site for the interacting proteins. This would lead to a reduced incorpor-ation of those proteins into the membrane, and, therefore, to a higher defiency, reflected by an unbalance between the primary and the secondary protein deficiencies. Thus, when the mutated protein fails to normally interact with other proteins, the membrane instability would probably be enhanced leading to a severe form of the disease. It is reasonable that an erythrocyte with normal mem-brane protein interactions between the deficient proteins would be more resistant than erythrocytes presenting altered membrane protein interactions.
In conclusion, our data suggest that the loss of a balanced protein interaction between the deficient proteins is accompanied by worsening of the disease. Further studies are warranted to strengthen the value of the balance between erythrocyte membrane protein deficiencies as an additional predictor of the clinical outcome in HS.
Acknowledgements
This study was in part supported by a grant (POCTI- PL 122204 – BIC) from the Fundac¸a˜o para a Cieˆncia e Tecnologia.
References
1. Gallagher PG, Forget BG. Hereditary spherocytosis,
elliptocytosis and related disorders. In: Beutler E, Lichtman MA,Coller BS,Kipps TJ,Seligsohn U, eds.
Williams Hematology, 6th edn. New York: McGraw-Hill, 2001:503–518.
2. Delaunay J. Molecular basis of red cell membrane
dis-orders. Acta Haematol 2002;108:210–218.
3. Morton NE, MacKinney AA, Kosower N, Schilling RF, Gray MP. Genetics of spherocytosis. Am J Hum
Genet 1963;14:170–184.
4. Agre P,Asimos A,Casella JF,McMillan C.Inheritance
pattern and clinical response to splenectomy as a reflection of erythrocyte spectrin deficiency in hereditary sphero-cytosis. N Engl J Med 1986;315:1579–1583.
5. Eber SW, Armbrust R, Schro¨ ter W. Variable clinical severity of hereditary spherocytosis: relation to erythrocyte spectrin concentration, osmotic fragility and autohemoly-sis. J Pediatr 1990;117:409–416.
6. Miraglia del Giudice E, Francese M, Nobili B, Morle´ L, Cutillo S, Delaunay J, Perrotta S. High
frequency of de novomutations in ankyrin gene (ANK1) in children with hereditary spherocytosis. J Pediatr 1998;132:117–120.
7. Whitfield CF, Follweiler JB, Lopresti-Morrow L, Miller BA. Deficiency of a-spectrin synthesis in
burst-forming units-erythroid in lethal hereditary spherocytosis. Blood 1991;78:3043–3051.
8. Iolascon A,del Giudice EM, Perrotta S, Alloisio N, Morle´ L, Delaunay J. Hereditary spherocytosis: from
clinical to molecular defects. Haematologica 1998;83:240– 257.
9. Iolascon A,Perrotta S,Tavano R,Miraglia del Giu-dice E.Hereditary spherocytosis in newborns. In:Bellanti JA, Bracci R, Prindull G and Xanthou M, eds.
Neo-natal Hematology and Immunology. III. Amsterdam: Elsevier Science, 1997:197–202.
10. Tse WT,Lux SE.Red blood cell membrane disorders. Br J
Haematol 1999;104:2–13.
11. Lux SE, Palek J. Disorders of red cell membrane. In: Handin RI, Lux SE, Stossel TP, eds. Blood: Principles
and Practice of Hematology. Philadelphia, PA: Lippincott Comp, 1995:1701–1818.
12. Lanciotti M, Perutelli P, Valetto A,Di Martino D, Mori PG.Ankyrin deficiency is the most common defect in dominant and non dominant hereditary spherocytosis. Haematologica 1997;82:460–462.
13. Hanspal M, Yoon SH, Yu H, Hanspal JS, Lambert S, Palek J, Prchal JT. Molecular basis of spectrin and
14. Savvides P, Shalev O, John KM, Lux SE. Combined
spectrin and ankyrin deficiency is common in autosomal dominant hereditary spherocytosis. Blood 1993;82:2953– 2960.
15. International Committee for Standardization in Haema-tology. ICSH reference method for staining of blood and bone marrow films by azure B and eosin Y (Romanowsky stain). Br J Haematol 1984;57:707–710.
16. Roper D,Layton M,Mitchell Lewis S.Investigation of
the hereditary hemolytic anemias: membrane and enzyme abnormalities. In:Lewis SM,Bain BJ,Bates I, eds. Dacie
and Lewis Practical Haematology. London: Churchill Livingstone, 2001:167–198.
17. Regan F, Newlands M, Bain BJ. Acquired haemolytic
anaemias. In:Lewis SM,Bain BJ,Bates I, eds. Dacie and
Lewis Practical Haematology. London: Churchill Living-stone, 2001:199–229.
18. Dodge JT,Mitchell C,Hanahan DJ.The preparation and
chemical characteristics of hemoglobin-free ghosts of human erythrocytes. Arch Biochem Biophys 1963;100:119–130. 19. Bradford MM. A rapid and sensitive method for the
quantification of microgram quantities of protein utilizing the principle of the protein-dye binding. Anal Biochem 1976;72:248–254.
20. Laemmli UK. Cleavage of structural proteins during the
assembly of the head of the bacteriophage T. Nature 1970;227:680–685.
21. Fairbanks G,Steck TL,Wallach DFH.Electrophoresis
of the major polypeptides of the human erythocyte mem-brane. Biochemistry 1971;10:2606–2616.
22. Saad STO,Costa FF,Vicentim DL,Salles TSI,Pranke PHL.Red cell membrane protein abnormalities in
hered-itary spherocytosis in Brazil. Br J Haematol 1994;88:295– 299.
23. Sa´ nchez-Lo´ pez JY,Camacho AL,Magan˜ a MT,Ibarra B, Perea FJ. Red cell membrane protein deficiencies in
Mexican patients with hereditary spherocytosis. Blood Cells Mol Dis 2003;31:357–359.
24. Lee YK,Cho HI,Park SS,Lee YJ,Ra E,Chang YH, Hur M,Shin HY,Ahn HS.Abnormalities of erythrocyte
membrane proteins in Korean patients with hereditary spherocytosis. J Korean Med Sci 2000;15:284–288. 25. Tshilolo L, Kagambega F, Sztern B, Vertongen F,
Gulbis B.Hereditary spherocytosis: one year experience in
the analysis of red cell membrane proteins. Rev Med Brux 1998;5:417–423.
26. Michaels LA,Cohen AR,Zhao H,Raphael RI,Manno CS.Screening for hereditary spherocytosis by use of
auto-mated erythrocyte indexes. J Pediatr 1997;130:957–960. 27. Agre P, Orringer EP, Bennett V. Deficient red-cell
spectrin in severe, recessively inherited spherocytosis. N Engl J Med 1982;306:1155–1161.
28. Miraglia del Giudice E,Iolascon A,Pinto L,Nobili B, Perrotta S. Erythrocyte membrane protein alterations
underlying clinical heterogeneity in hereditary spherocyto-sis. Br J Haematol 1994;93:828–834.
29. Jarolim P,Rubin HL,Brabec V,Palek J.Comparison of
the ankyrin (AC)n microsatelites in genomic DNA and
mRNA reveals absence of ankyrin mRNA allele in 20% of patients with hereditary spherocytosis. Blood 1995;85:3278–3282.
30. Dhermy D, Galand C., Bournier O, Boulanger L, Cynober T, Schismanoff PO, Bursaux E,Tchernia G, Boivin P,Garbarz M.Heterogeneous band 3 deficiency in
hereditary spherocytosis related to different band 3 gene defects. Br J Haematol 1997;98:32–40.
31. Alloisio N, Maillet P, Carre´ G.Hereditary spherocy-tosis with band 3 deficiency. Association with a non-sense mutation of the band 3 gene (Allele Lyon), and aggravation by a low expression allele occurring in trans (Allele Genas). Blood 1996;88:1062–1069.
32. Alloisio N,Texier P,Valliet A.Modulation of clinical