Multi-cracks modeling in reflective cracking
Jorge Pais1, Manuel Minhoto2 and Shakir Shatnawi3
1
University of Minho, Portugal
2
Polytechnic Institute of Bragança, Portugal
3
Shatec Engineering Consultants, LLC, California, USA
Introduction
Cracks in the pavements tend to reflect through an overlay placed on the cracked pavement due to the traffic and temperature effects, depending on the magnitude of the stress concentrations at the tip of the crack, the resistance of the overlay material to crack propagation and the characteristics of the interface between the overlay and the existing pavement. The stress concentration at the crack tip results of the bending, shearing and tearing actions of traffic loads and tensile and bending actions caused by temperature and moisture movements as well as temperature and moisture gradients [1].
To assess the cracking in pavement overlays, many investigations have been conducted in terms of experimental and numerical modeling. The first studies started by Majidzadeh et al [2] with the application of the fracture mechanics in the analysis of pavement fatigue where the fatigue life of paving mixtures in terms of material constants, geometry, boundary conditions, and the state of stress is predicted. In that work, fatigue is defined in terms of crack initiation, influence on crack growth, and critical stress intensity at the critical failure point. The laboratory tests to support that study utilized notched and unnotched beams supported in an elastic foundation to predict the fracture parameters. The determination of the fracture parameters (i.e the stress intensity factors) were made based on experimental assumptions from fracture tests.
Later on, Van Gurp and Molenaar [3] developed a procedure to predict the reflective cracking in asphalt overlays using linear elastic finite element models, by analyzing the crack propagation form the old cracked asphalt layers through the new overlay. The models used only considered the traffic influence simulating mode I and II of crack opening by applying the load above the crack and adjacent to the crack, respectively, as represented in Figure 1.
Since then, the numerical modeling has been used in the assessment of reflective cracking by different methods. Paulino et al [4] applied a cohesive zone fracture model to simulate crack initiation and propagation in asphalt concrete using intrinsic constitutive laws to connect traditional finite elements to simulate localized damage and softening behavior. Nesnas and Nunn [5] used a finite element model with multi-cracks, as indicated in Figure 2, to investigate the top-down cracking in cement treated base pavements.
Figure 2. Multi-cracks simulation for top-down cracking [5].
More recently, Wu and Harvey [6] developed a finite element model to evaluate the performance of several asphalt mixes that contain binders with recycled rubber. The mechanistic model was based on non-local continuum damage mechanics and the finite element method and the damage evolution law parameters were identified using laboratory fatigue test data. The finite element model (Figure 3) was the first model used in the reflective cracking analysis that was created with multiple cracks, simulating the alligator cracking in the existing pavements before the placement of a pavement overlay.
However, these studies did not investigate the influence of the existence of multiple cracks or the influence of the spacing between cracks in the evaluation of the reflective cracking. This subject takes a significant importance because cracked pavements, mainly the flexible pavements, usually present multiple cracks (alligator cracks) before the pavement overlaying.
of stress and strain in the pavement overlay, just above the existing cracks in the old pavement.
Figure 3. Multi-cracks modeling to simulate HVS effect [6].
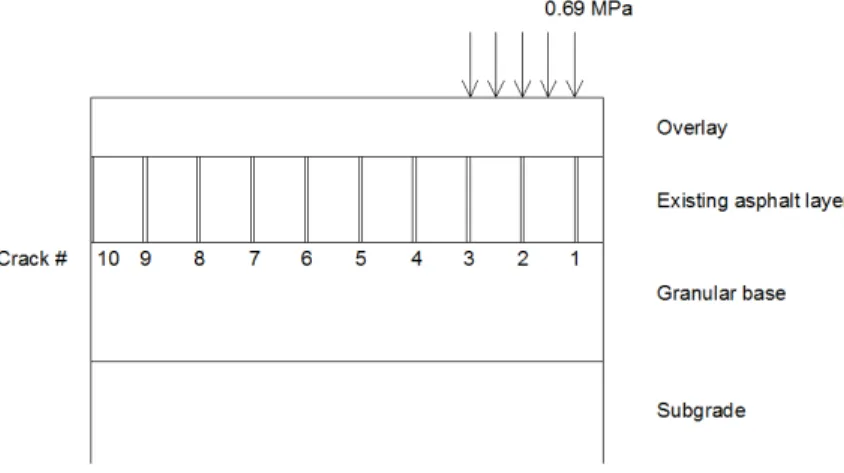
This effort consisted of developing a 2D finite element model which was created, using the plain strain mode, in which 10 cracks were modeled in the cracked layer and spaced 10 cm from each other. The model has the ability to easily change the crack spacing, the elimination of some cracks to create any configuration of cracking with any cracking spacing, from a pavement with only one crack to a pavement up to 10 cracks.
The application of this model resulted in creating different cracking configurations to study the influence of crack spacing on the reflective cracking phenomenon. The study investigated three different overlay configurations: 10, 20 and 30 cm overlay thicknesses over an existing cracked pavement.
Finite elements model
The mesh of the model was designed by using quadrilateral, two-dimensional structural-solid elements, with eight nodes, with two degrees of freedom at each node. The mesh was designed to apply a load with a dual wheel configuration representing a standard axle wheel of 80 kN (Figure 5), applied on the pavement surface in a representative area of the tire-pavement contact. The finite element model used in the numerical analysis was developed in a general finite elements code, ANSYS(R) Academic Teaching Introductory, V12.1.
The finite elements model was configured to create 25 different pavements configurations, varying the cracking configuration. The first 10 models present only one crack, from crack #1 to crack #10, representing all possibilities of isolated cracks. The following pavements represent the configurations of multi-cracks varying the cracking space from 10 cm up to 50 cm, as indicated in Figure 6.
Figure 4. Schematic representation of the finite elements model.
These models were applied to three different pavement structures, varying the overlay thickness and keeping the same thickness for the layers of the existing asphalt layer and for the granular base. The thickness and stiffness of the layers for the three structures are shown in Table I. The materials were modeled assuming a linear elastic behavior.
The finite elements model was designed as a plain strain problem, using plane structural solid elements, defined by eight nodes and having two degrees of freedom at each node.
strain in the crack tip was calculated just above the modeled cracks, 0.3 and 0.25 mm from the crack edge, as indicated in Figure 7. For each case, the horizontal, vertical, shear and Von Mises strain was calculated.
Figure 5. Finite elements model.
Layers Structure 1 Structure 2 Structure 3
Overlay thickness 0.10 m 0.20 m 0.30 m
stiffness 5000 MPa 5000 MPa 5000 MPa Existing asphalt
layer
thickness 0.20 m
stiffness 2000 MPa
Granular base thickness 0.20 m
stiffness 160 MPa
Subgrade stiffness 80 MPa
Table I – Thickness and stiffness of pavement layers.
Modeling results
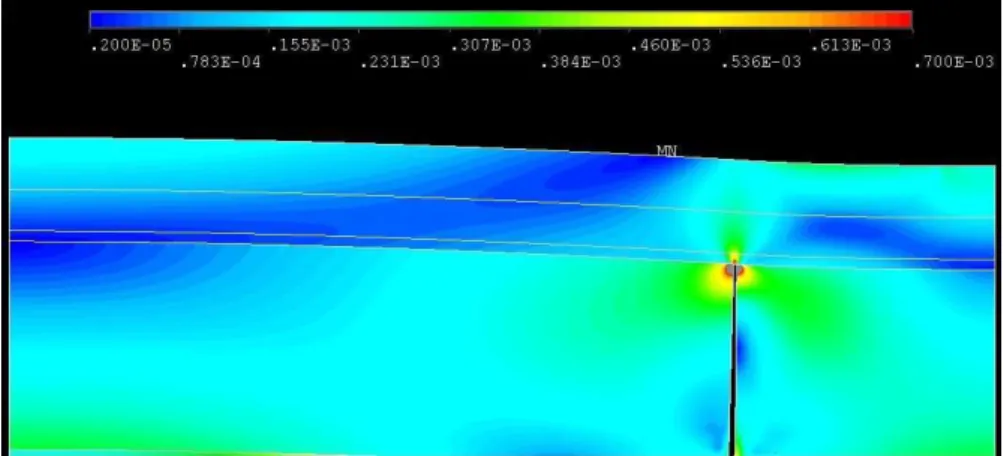
One of the objectives of this work was to evaluate the difference between modeling of multiples cracks as compared to a single crack. This can be observed by the representation of the Von Mises strain presented in Figure 8 and 9, respectively for a pavement with only one crack modeled (crack #3) and the pavement with 10 cm
spaced cracks (case 11). The analysis of these figures show the difference between the state of strain in the overlay associated with the presence of either a single or multiple cracks. The difference is also visible in the state of strain above the existing cracks which is responsible for the reflective cracking.
Case Crack 10 9 8 7 6 5 4 3 2 1
1 1 2 2 3 3 4 4 5 5 6 6 7 7 8 8 9 9 10 10
11 10 cm 10 9 8 7 6 5 4 3 2 1
12 9 7 5 3 1
13 10 8 6 4 2
14 10 7 4 1
15 8 5 2
16 9 6 3
17 9 5 1
18 10 6 2
19 7 3
20 8 4
21 6 1
22 7 2
23 8 3
24 9 4
25 10 5
50 cm cracks Load Single crack 20 cm 30 cm cracks 40 cm cracks
Figure 6. Representation of cracking configuration.
Figure 7. Location for stress and strain calculation.
Figure 8. Von Mises strain in a pavement with a single crack (#3).
Figure 9. Von Mises strain in a pavement with multiple cracks.
The analysis of single crack modeling indicates that the vertical strain is almost constant when cracks below the load (1, 2 and 3) are modeled. Also, for the other cracks, the vertical strain is constant. In terms of horizontal, shear and Von Mises strain, they increase as the cracks moves away from the load but after crack 4 the strain level reduces significantly, except for the horizontal strain.
Figure 10. Strain in the overlay for models with only one crack.
For the other pavements, with 20 and 30 cm overlay thickness, the conclusion is identical, ie, the maximum state of strain appears not for the crack adjacent to the load but away from the load, as it can be observed in Figure 11 where the Von Mises strain is represented as function of the overlay thickness and crack number. As the overlay thickness increases, the Von Mises strain (Figure 11) decreases and the maximum strain appears for crack 6, ie, 30 cm away from the load.
Figure 11. Influence of overlay thickness of Von Mises strain for single crack.
Figure 12. Strain in the overlay for 10 cm crack spacing.
For the other pavements (20 and 30 cm overlay thickness) the behavior of the Von Mises strain is identical to the observed for single cracks modeling where maximum strain appears for crack number 6 but the strain level is lesser than the one observed for single cracks. Identical results were obtained for the other strain components as well as for stress components. The analysis of 10 cm spaced cracks shows that, for this crack spacing, the consideration of multiple cracks is unfavorable.
Figure 13. Influence of overlay thickness of Von Mises strain for 10 cm crack spacing.
observed for 10 cm spaced cracks, which is less than the one observed for single cracks (#4 and #5).
Figure 14. Von Mises strain in the overlay for 20 cm crack spacing.
Figure 15. Von Mises strain in the overlay for 30 cm crack spacing.
enough to consider the existence of only one crack, not adjacent to the load but some centimeters away from the load, depending of the overlay thickness.
Figure 16. Von Mises strain in the overlay for 40 cm crack spacing.
Figure 17. Von Mises strain in the overlay for 50 cm crack spacing.
Conclusions
• There are significant differences in the state of stress in the pavement overlays due the presence of multiple cracks compared to the modeling of single cracks;
• The modeling of a single crack must be made by a crack considerable away from the load. That distance depends on the overlay thickness and for the cases studied it should be greater than 10 cm;
• The multiple cracks modeling do not increase the strain level in the overlay. However, the larger the distance between cracks, the higher and more significant the strain level can be when compared to the one obtained for a single crack.
References
[1] Molenaar, A.A.A. and Potter, J. (1997). In Prevention of Reflective Cracking in Pavements. Edited by Vanelstraete, A. and Francken, L. RILEM Report 18. Published by E & FN Spon, 2–6 Boundary Row, London SE1 8HN. ISBN 0 419 22950 7.
[2] Majidzadeh, K., Kauffmann, E.M. and Ramsamooj, D.V. (1971). Application of fracture mechanics in the analysis of pavement fatigue. Proceeding of the Association of Asphalt Paving Technologists, vol 40, pp 227-246.
[3] Van Gurp, C. and Molenaar, A.A.A. (1989). Simplified method to predict reflective cracking in asphalt overlays. Proceeding of the Reflective cracking in pavements – Assessment and control conference, Liege.
[4] Paulino, G.H., Song, S.H. and Buttlar, W. (2004). Cohesive zone modeling of fracture in asphalt concrete. Proceeding of the Cracking in pavements – Mitigation, risk assessment and prevention conference, Limoges.
[5] Nesnas, K. and Nunn, M. (2004). A model for top-down reflection cracking in composite pavements. Proceeding of the Cracking in pavements – Mitigation, risk assessment and prevention conference, Limoges.
![Figure 1. Single crack modeling in mode I and II of crack opening [3].](https://thumb-eu.123doks.com/thumbv2/123dok_br/16985594.763268/2.892.176.533.646.845/figure-single-crack-modeling-mode-and-crack-opening.webp)
![Figure 2. Multi-cracks simulation for top-down cracking [5].](https://thumb-eu.123doks.com/thumbv2/123dok_br/16985594.763268/3.892.171.547.279.526/figure-multi-cracks-simulation-cracking.webp)
![Figure 3. Multi-cracks modeling to simulate HVS effect [6].](https://thumb-eu.123doks.com/thumbv2/123dok_br/16985594.763268/4.892.222.493.168.373/figure-multi-cracks-modeling-to-simulate-hvs-effect.webp)