BJRS
RADIATION SCIENCES
07-02A (2019) 01-15ISSN: 2319-0612
Accept Submission: 2018-10-29
Thermoluminescent properties of LaAlO
3:C crystals
synthesized by solid state reaction applied to UV
Dosimetry
N. Alves
a; W. B. Ferraz
b; L. O. Faria
a,ba Universidade Federal do Estado de Minas Gerais/ Departamento de Engenharia Nuclear,Av. Antônio Carlos, 6627
31270-901 Belo Horizonte, MG, Brazil
b Centro de Desenvolvimento da Tecnologia Nuclear (CDTN/CNEN)/ Av. Antônio Carlos, 6627,941
31270-901 Belo Horizonte, MG, Brazil
neire.radiologia@yahoo.com.br; farialo@cdtn.br
ABSTRACT
In this work, the thermoluminescent (TL) response of carbon doped lanthanum aluminate crystals grown by solid state reaction method was investigated. Three syntheses using different combinations of Al2O3, La2O3 and 0.1 wt % of
car-bon atoms were conducted. The 1:1 mixture of aluminum and lanthanum oxide was mixed with 0.1wt.% carcar-bon and annealed at 1700°C for two hours in a hydrogen atmosphere. The X-ray diffraction analysis revealed the formation of the rhombohedral LaAlO3 crystallographic phase. Ultraviolet-visible spectroscopies were obtained and F and F+ centers
were identified ascribed. Fourier transform infrared spectroscopic data show higher and lower frequencies assigned to AlO6 octahedra in LaAlO3. The UV irradiations were carried out using a commercial 8W UV lamp.
Thermolumines-cence measurements were performed at a Harshaw 4500 TL reader. The three syntheses were very efficient to obtain carbon doped LaAlO3 crystals with high thermoluminescent output, for low exposure rates of UVR fields.
1. INTRODUCTION
Lanthanum aluminate is a ceramic compound that has a perovskite-like crystalline structure. Mate-rials with these properties find use in several technological applications due to their special electri-cal and magnetic properties. These include insulators and superconductors, ferroelectric crystals and the use as a substrate for superconductors of high critical temperature, among others [1; 2]. Perov-skite-type ceramics (ABO3) have received much attention because of its unique crystalline
struc-ture. It may accommodate a large distribution range of cation sizes in their sublattices [3]. Oxygen vacancies may be generated in order to compensate the charge of substituting ions, enabling the aliovalent cations to be distributed in both A and B sites cation sublattices. The oxygen vacancies concentrations are directly related to the enhancement of TL sensibility, because these vacancies result in charge trapping [4; 5].
Exposure to ultraviolet radiation (UVR), in particular from the sun’s rays, is a significant public health hazard and may increase with further depletion of the ozone layer. The possible health haz-ards range from short term effects, such as sunburn and eye damage, to chronic effects, such as skin cancer and melanoma or cataracts. Exposure to sunlight is the major cause of UVR exposure, but there are few artificial sources that result in human exposure to UVR greater than that from the sun. The spectrum of the UVR emitted from artificial sources varies from one source to another [6]. Ultraviolet radiation measurement using thermoluminescent materials has been suggested by many authors [7; 8; 9]. The interest in the synthesis of new TL materials has been increasing, meanly be-cause of their reading easiness when compared to other techniques [10].
The thermoluminescence (TL) effect has been suggested for the evaluation of ionizing radiation doses since 1953[11]. A considerable number of various chemical compositions have been investi-gated since then, in order to find the explanation of mechanisms for this effect and to discover promising TL phosphors for different dosimetry purposes. In TL materials, energy from radiation is stored in their crystal lattice by the trapping of released free electrons and holes. The electron and hole traps are due to lattice defects in the material [12]. Normally thermoluminescence is obtained by doping the crystal lattice of ionic crystals with impure atoms that in turn behave as electronic
traps. When the TL material is exposed to ionizing radiation, electrons are released from the va-lence band becoming free to move through the crystal lattice. Most of these free electrons recom-bine immediately with the ionized atoms in the valence band. However, a small amount is captured in the electronic traps, being after released when a constant heating rate is supplied to the material, emitting light when they return to the valence band. The amount of emitted light is then proportion-al to the radiation dose [2]. The main goproportion-al of dosimetric devices is to determine the quantity of en-ergy per unit mass of material (dose) that has been absorbed during the irradiation, thereby leading to applications such as personal and environmental dosimetry, diagnostic imaging and computed radiography [13].
The first investigation, concerned to the TL properties of LaAlO3 applied to radiation dosimetry,
has been recently reported [14; 15]. The LaAlO3:Ce,Dy crystals present high TL output for UV
ra-diation fields, comparable to the TL output of the best dosimeters ever reported in literature, i.e. Al2O3:C and ZrO2 crystals [15]. It is well known that carbon doped aluminum oxide single crystals
have excellent TL and photoluminescent response properties for X-rays, UV and gamma radiation fields [12; 16]. Thus, we conducted three different syntheses of LaAlO3 by the solid state reaction
method, doping the mixture with 0.1 wt% of carbon atoms. In the present study we have investigat-ed the TL properties of polycrystalline LaAlO3:C exposed to UV fields.
2. MATERIALS AND METHODS
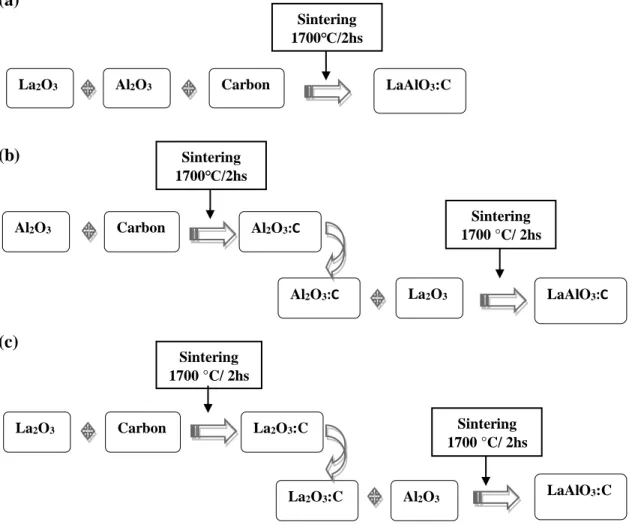
Lanthanum aluminate polycrystals were synthesized by solid state reaction method by mixing equimolar ratios of aluminum oxide (Vetec, 99.99%) and lanthanum oxide (Alfa, 99.98%). The mixed powder was weighed and, then, manually grinded in agate mortar with 0.1 wt. % of carbon atoms. The schematic diagrams illustrating the mixing and sintering procedures are shown in Fig. 1. The first methodology used is presented in Fig. 1(a), where aluminum oxide and lanthanum oxide were grounding in an agate mortar together with 0.1 wt.% of graphite and, then, the mixture was sintered in hydrogen atmosphere at 1770 °C for 2 hours. In the second methodology, schematized in Fig. 1(b), Al2O3 powder was mixed with 0.1 wt.% of carbon and sintered for 2 hs at 1770 °C. The
resulting powder was reground with La2O3 and sintered for 2 hours again at 1770 °C. The third
methodology, shown in Fig. 1(c), La2O3 powder was mixed with 0.1 wt.% of carbon and sintered at
the same conditions above. The resulting powder was reground with Al2O3 and sintered again. The
samples obtained using the methodology depicted on the diagrams were denominated according to Table 1.
Figure 1. Schematic diagrams illustrating the mixing and sintering procedures used to produce
different LaAlO3:C polycrystals samples.
(a) (b) (c) Sintering 1700 °C/ 2hs Sintering 1700℃/2hs Al2O3 Carbon Al2O3:C La2O3 Al2O3:C LaAlO3:C Sintering 1700 °C/ 2hs La2O3 Carbon Al2O3 La2O3:C LaAlO3:C La2O3:C Sintering 1700 °C/ 2hs Al2O3 La2O3 Carbon LaAlO3:C Sintering 1700℃/2hs
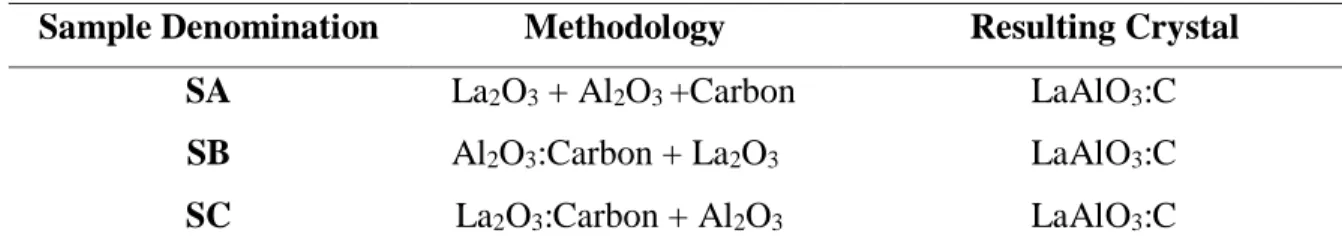
Table 1: Synthesis methodology and sample denomination.
Sample Denomination Methodology Resulting Crystal
SA La2O3 + Al2O3 +Carbon LaAlO3:C
SB Al2O3:Carbon + La2O3 LaAlO3:C
SC La2O3:Carbon + Al2O3 LaAlO3:C
All samples were annealed at 950 °C for 30 minutes, in order to remove captured charge carriers from trap centers, as suggested by LARSEN, N. A. (1999) [13]. In order to confirm the formation of the LaAlO3 phase, the samples crystalline structure was analyzed by using Regaku D/Max
ÚLTIMA X-ray diffractometer. The CuKα radiation was used and the scanning rate was set at 0.02 °/s at 2θ ranging from 4 and 80°. The absorption spectra of carbon doped LaAlO3 were taken in a
SHIMADZU spectrophotometer model UV–2401pc, in the 190-900 nm wavelength range. All measurements were performed at room temperature. The FTIR spectra were collected by using a Bomen 100 spectrometer and the readout was performed with spectral resolution of 4 cm-1 and 32 scans, for wavenumbers ranging from 400 to 4000 cm-1. The powder samples were pressed with KBr in order to be analyzed. The UV irradiation was performed using a commercial 8W UV fluo-rescent lamp. The spectral irradiance at the lamp surface was 2.98 mJ/cm2, measured using a cali-brated radiometer UVX100 E-22476 with a 254 nm sensor. The thermoluminescent analysis was performed using a Harshaw TLD-4500 TL reader. The glow curves were taken using a heating rate of 15 °C/s with maximum temperature of 300 °C.
3. RESULTS AND DISCUSSION
The purpose of growing a crystalline material in reducing atmosphere is to induce a large concen-tration of oxygen vacancies into the crystal lattice. When these vacancies are occupied by strange atoms in the crystalline structure, some of them may create electronic trappers. At this point, they are directly related to the thermoluminescence sensitivity [4]. It is well known that oxygen
vacan-cies may form F+ centers in Al2O3 by doping with carbon atoms during the crystal growth, in
high-ly reducing atmosphere. This is due to the charge compensation of divalent carbon ion substituting trivalente Al3+ ions [16; 17]. Occupancy of an oxygen vacancy by two electrons gives rise to a neu-tral F center, whereas occupancy by one electron forms a positively charged center, with respect to the lattice (F+ center). F and F+ centers are known to play a key role in the high thermoluminescent output of Al2O3. It was found that, increased F+ centers concentration in Al2O3:C causes significant
increase in OSL and TL sensitivity [16; 18]. In order to enhance the oxygen vacancy production, the polycrystalline lanthanum aluminate was sintered at hydrogen atmosphere and doped with hyper-pure carbon, by mechanic mixture with 0.1 wt.%.
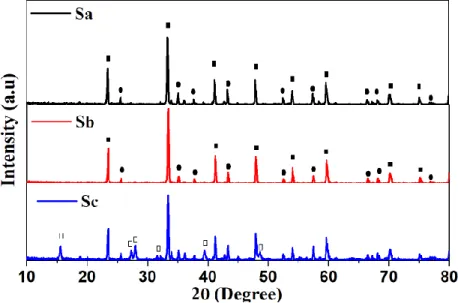
The XRD patterns diffractograms of samples produced by the three different synthesis are shown in Fig. 2. The X-ray diffraction analysis revealed the nucleation of rhombohedral LaAlO3 (JCPDS
31-0022) crystallographic phase, however a small percentage (15%) of Al2O3 (JCPDS 10-0173) has
been also identified in all compositions. One of them (“SC” sample) also presented peaks (17%) assigned to lanthanum hydroxide phase (JCPDS 36-1481) [19].
Figure 2: XRD patterns for the LaAlO3:C grown by different synthesis: (■) assigned to
rhombo-hedral phase Lanthanum aluminate (LaAlO3), (●) assigned for aluminum oxide (Al2O3) and (□) for
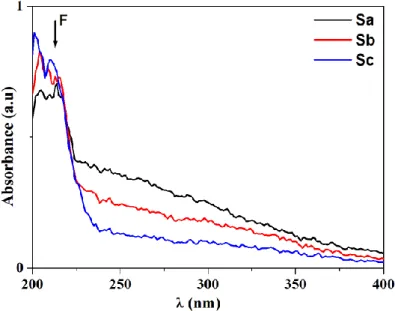
In Fig. 3, the correspondent absorption spectra of carbon doped lanthanum aluminate grown by three different methodologies are displayed. An absorption band centered at 206 nm has been ob-served in all samples. In this context, we remark that it is well known that LaAlO3 crystals have
strong band-to-band absorptions for wavelengths ranging from 190 to 220 nm [20]. This absorption region is assigned to F center formation. These bands are due to high concentrations of oxygen va-cancies induced by high reducing atmosphere, just as it has been described for the production of Al2O3:C crystals. [21; 22]. A large absorption band at 230-350 nm is observed for every sample,
however with different intensities. In this Figure it isn’t possible to clearly observe the bands asso-ciated to F+ center.
Figure 3. The UV-Vis absorption spectra of unirradiated LaAlO3:Cpolycrystals. The absorption
bands attributed to F centers are highlighted.
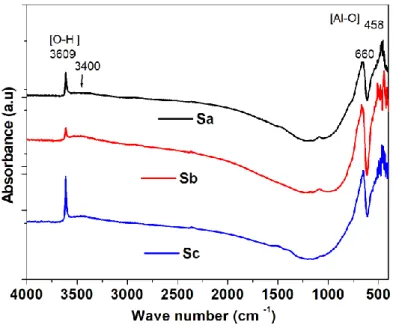
The FTIR spectra collected to all samples, for wavenumbers ranging from 400 to 4000 cm-1, are
shown in Fig. 4. In these spectra, it is possible to observe the specific absorption bands centered at 458, 660 and 3609 cm-1. The two first bands are assigned to AlO
6 octahedra in LaAlO3 [23]. The
Figure 4. FTIR spectra for LaAlO3:C samples.
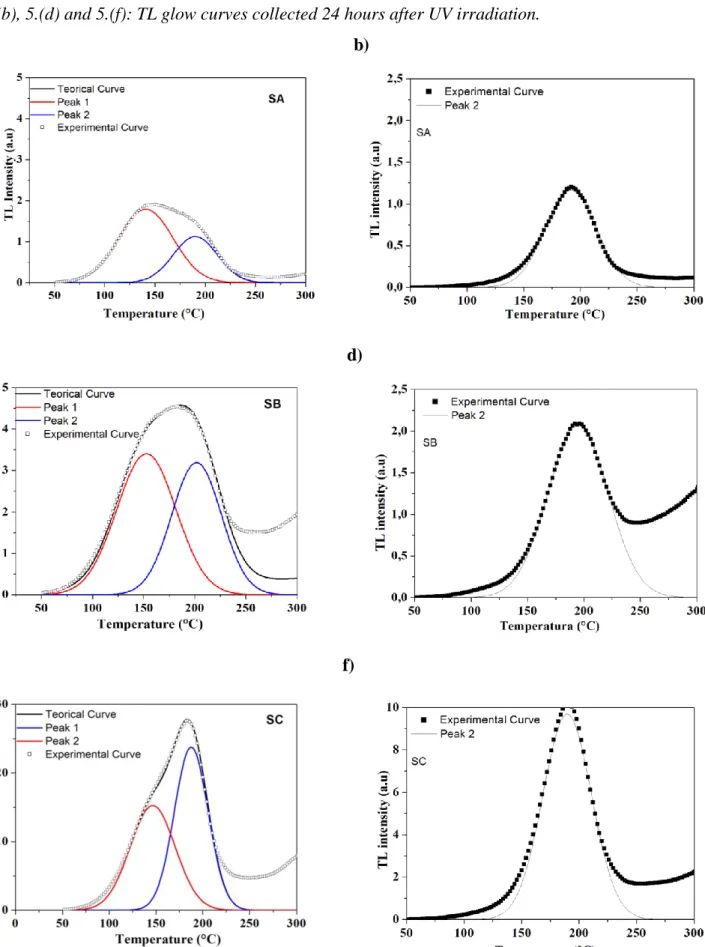
As reported by Larsen (1999) [13], before performing the irradiation and reading process, samples should be annealed with a thermal treatment at 950 °C for 30 minutes, in order to remove captured charge carriers from trap centers. After performing this annealing, the samples were irradiated using a commercial UV fluorescent lamp and, subsequently, the TL glow curves for samples produced by the three syntheses were collected. In Fig. 5.(a), 5.(c) and 5.(e) we see the TL glow curves taken immediately after 30 seconds of UV irradiation. Two individual TL peaks, the first at 145 °C and the second at 190 °C, obtained by peak-fitting using Gaussian lines are also shown in these figures. As it can be seen, the two peaks are common to the three methodologies tested. Although the shape of the glow curves is quite similar, it is possible to observe changes in the relative intensities of the individual peaks. On the other hand, in Fig. 5.(b), 5.(d) and 5.(f) we show the TL glow curves col-lected 24 hours after UV irradiation. It is clear from these curves that the peak centered at 145 °C fads completely within the first 24 hours after exposure radiation. Together with the experimental curves we have plotted the individual TL peak obtained after peak-fitting. This peak-fitting was performed using PeakFit® v.4, giving a correlation coefficient r2 = 0,99996.
Figure 5. Figures 5.(a), 5.(c) and 5.(e) : TL glow curves taken immediately after 30 seconds of UV
irradiation and two individual TL peaks obtained by peak-fitting using Gaussian lines. Figures 5.(b), 5.(d) and 5.(f): TL glow curves collected 24 hours after UV irradiation.
a) b)
c) d)
e) f)
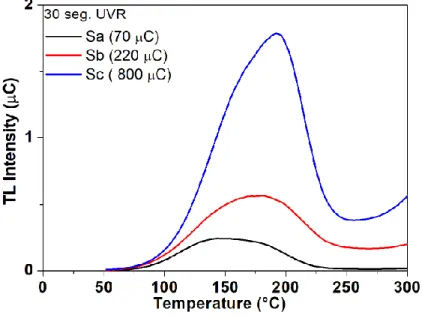
In Fig.6, the TL glow curves obtained immediately after the thirty seconds of UV irradiation are presented. The electronic charge measured by the photomultiplier tube was 70 and 220 µC for the samples SA and SB, respectively. These values are proportional to the area under the glow curve. The higher TL output signal is presented for SC sample with 800 µC. This sample was obtained by the methodology shown in diagram C on Fig. 1. We remark that the electric charge collected at the Photomultiplier Tube (PMT) per irradiance unit, for Sc sample, is 635μC/mJ.cm-2. For comparison purposes, this rate measured for LaAlO3:Ce,Dy single crystal is only 0.430 μC/mJ cm-2 and 293
μC/mJ cm-2 for undoped LaAlO
3 synthesized samples, irradiated at the same conditions and read at
the same TL reader, after 30 seconds of exposition [15; 25]. We see that TL sensitivity to UV pho-tons for LaAlO3:C from SC sample is much higher than those for LaAlO3:Ce,Dy grown under
hy-drothermal conditions and for undoped LaAlO3 synthesized under reducing atmosphere.
Figure 6. Thermoluminescent glow curves for LaAlO3:C0.1% exposed to 30 second UVR.
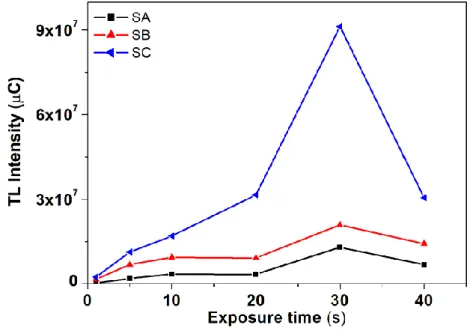
The thermoluminescence response of TL materials, commonly used in radiation dosimetry, is di-rectly related to the amount of absorbed radiation dose. In order to check if there is a linear relation-ship between TL output and the irradiation exposure time, the samples were irradiated by different exposure times from 1 to 40 seconds. After 40 seconds of irradiation the maximum saturation is achieved. The corresponding TL intensities and exposure time are shown in Fig. 7.
Figure 7. Maximum TL response of samples LaAlO3:C1% , as a function of the exposure time.
The best TL response for UV fields was found to SC sample. On the other hand, the corresponding linear fitting for the sample SC is shown in Fig. 8. The selected points in these curves are corre-sponding to 1, 5, 10 and 20 seconds, which provided a correlation coefficient equal to 0.98847.
Figure 8. TL output intensities for SC sample between 1 – 20 seconds of UV exposure, and the
We believe the higher TL output for SCsample is due to the synthesis methodology and also to the presence of lanthanum hydroxide crystals into the sample. We intend to explore more carefully these compositions making some characterizations in order to obtain an ideal material for TL do-simetry in ultraviolet fields.
4. CONCLUSION
We report an investigation about synthesis of lanthanum aluminate powders. Crystals were grown via state solid reaction by three different combinations of Al2O3, La2O3 and 0.1% of carbon atoms,
during the synthesis process. According to the thermoluminescent investigation, the composition with the better TL output was lanthanum aluminate SC sample obtained by the La2O3:Carbon +
Al2O3 synthesis sequence, i.e. where La2O3 powder was mixed with 0.1 wt.% of carbon and sintered
for 2 hs at 1700 °C, and the resulting powder was reground with Al2O3 and sintered for 2 hours
again at 1770 °C. The others compositions also have good TL response, but less than the previously mentioned. We conclude that the synthesis was very efficient to obtain carbon doped LaAlO3
crys-tals with high thermoluminescent intensities for low exposure rates of UVR fields. We believe that carbon doped lanthanum aluminate has great potential for application in UV dosimetry.
5. ACKNOWLEDGMENT
REFERENCES
1. VILLAS-BÔAS; , L. A. D. S.; , D. P. F. Efeito da co-dopagem com Pr e Mn nas propriedades elétricas de SrLaAlO3. Revista Matéria, v. 15, n. 1, p. 10, 2010. ISSN 1517-7076.
2. KAUR, J. et al. Review of the synthesis, characterization, and properties of LaAlO3 phosphors. Research on Chemical Intermediates, p. 1-35, 2013/03/23 2013. ISSN 0922-6168. Disponível em: < http://dx.doi.org/10.1007/s11164-013-1126-z >.
3. CHEN, T.-Y.; FUNG, K.-Z. A and B-site substitution of the solid electrolyte LaGaO3 and LaAlO3 with the alkaline-earth oxides MgO and SrO. Journal of Alloys and Compounds, v. 368, n. 1–2, p. 106-115, 2004. ISSN 0925-8388. Disponível em: < http://www.sciencedirect.com/science/article/pii/S0925838803008375 >.
4. STEPHEN W. S. MCKEEVER, M. M., PETER D. TOWNSEND. Thermoluminescence
Dosimetry Materials: Properties and Uses. England: Nuclear technology Publishing,
1995. ISBN 10870965191.
5. XIONG, K.; ROBERTSON, J.; CLARK, S. J. Electronic defects in LaAlO3.
Microelectronic Engineering, v. 85, n. 1, p. 65-69, 2008. ISSN 0167-9317. Disponível
em: < http://www.sciencedirect.com/science/article/pii/S0167931707002547 >.
6. PROTECTION, I. C. O. N.-I. R. Guidelines on Limits of Exposure to Ultraviolet
Radiation of Wavelengths Between 180 nm and 400 nm (Incoherent Optical Radiation). ICNIRP Guidelines. Health Physics Society 2004.
7. MORALES-HERNÁNDEZ, A. et al. Synthesis and thermoluminescence of LaAlO3:Pr3+ to UVC radiation dosimetry. Applied Radiation and Isotopes, v. 118, p. 12-17,
2016/12/01/ 2016. ISSN 0969-8043. Disponível em: <
http://www.sciencedirect.com/science/article/pii/S096980431630570X >.
8. RIVERA MONTALVO, T. et al. Termoluminescent Properties of High Sensitive ZrO2+
PTFE for UV Radiation Dosimetry. Materials Science Forum: Trans Tech Publ, 2005.
373-380 p.
9. RIVERA, T. et al. Green stimulated luminescence of ZrO2 + PTFE to UV radiation dosimetry. Nuclear Instruments and Methods in Physics Research Section B: Beam
Interactions with Materials and Atoms, v. 213, p. 325-328, 2004. ISSN 0168-583X.
Disponível em: < http://www.sciencedirect.com/science/article/pii/S0168583X03016379 >.
10. RIVERA, T. Synthesis and Thermoluminescent Characterization of Ceramics Materials. In: (Ed.). Advances in Ceramics - Synthesis and Characterization, Processing and Specific
Applications. China: In Tech, 2011. cap. 6, p.520. ISBN ISBN: 978-953-307-505-1.
11. DANIELS, F., BOYD, C.A., SAUNDERS, D.F. Thermoluminescence as a research tool.
cience v. 117, p. 343–349, 1953.
12. COLYOTT, L. E. A., M. S.; MCKEEVER, S. W. S. . An integrating ultraviolet-B dosemeter using phototransferred thermoluminescence from a-Al2O3:C. Radiat. Prot.
Dosim., v. 72, n. 2, p. 87 - 94, 1997.
13. LARSEN, N. A. Dosimetry Based on Thermally and Optically Stimulated
Luminescence. Niels Bohr Institute, University of Copenhagen: RISO National
14. ALVES, N.; FERRAZ, W. B.; FARIA, L. O. Synthesis and investigation of the luminescent properties of carbon doped lanthanum aluminate (LaAlO3) for application in radiation dosimetry. Radiation Measurements, v. 71, n. 0, p. 90-94, 2014. ISSN 1350-4487. Disponível em: < http://www.sciencedirect.com/science/article/pii/S1350448714000341 >.
15. OLIVEIRA, V. H. et al. Study of TL properties of LaAlO3:Ce,Dy crystals for UV dosimetry. Radiation Measurements, v. 46, n. 10, p. 1173-1175, 2011. ISSN 1350-4487. Disponível em: < http://www.sciencedirect.com/science/article/pii/S1350448711004379 >.
16. AKSELROD, M. S. et al. Highly Sensitive Thermoluminescent Anion-Defective Alpha-Al203:C Single Crystal Detectors. Radiation Protection Dosimetry, v. 32, n. 1, p. 15-20, July 1, 1990 1990. Disponível em: < http://rpd.oxfordjournals.org/content/32/1/15.abstract >.
17. MCKEEVER, S. W. S. et al. Characterisation of Al2O3 for use in thermally and optically stimulated luminescence dosimetry. Radiation Protection Dosimetry, v. 84, n. 1-4, p. 163-168, 1999. Disponível em: < http://www.scopus.com/inward/record.url?eid=2-s2.0-0032766479&partnerID=40&md5=95317c6ce5f8b7293f3fdfae09ea6a80 >.
18. YUKIHARA, E. G., MCKEEVER S. W. S. . Optically stimulated luminescence:
fundamentals and applications. 2011.
19. Powder diffraction files, inorganic, Vol. 21. Published by the JCPDS, Swarthmore, 1983.
20. DEREŃ, P. J. et al. Spectroscopic properties of LaAlO3 nanocrystals doped with Tb3+
ions. Journal of Luminescence, v. 122–123, n. 0, p. 780-783, 2007. ISSN 0022-2313. Disponível em: < http://www.sciencedirect.com/science/article/pii/S0022231306002912 >. Acesso em: 2007/4//.
21. AKSELROD, M. S.; BØTTER-JENSEN, L.; MCKEEVER, S. W. S. Optically stimulated luminescence and its use in medical dosimetry. Radiation Measurements, v. 41, Supplement 1, n. 0, p. S78-S99, 2006. ISSN 1350-4487. Disponível em: < http://www.sciencedirect.com/science/article/pii/S135044870700008X >.
22. ZENG, X. et al. Crystal growth and optical properties of LaAlO3 and Ce-doped LaAlO3 single crystals. Journal of Crystal Growth, v. 271, n. 1–2, p. 319-324, 2004. ISSN
0022-0248. Disponível em: <
http://www.sciencedirect.com/science/article/pii/S0022024804008802 >.
23. SALAVATI-NIASARI, M.; HOSSEINZADEH, G.; DAVAR, F. Synthesis of lanthanum hydroxide and lanthanum oxide nanoparticles by sonochemical method. Journal of Alloys
and Compounds, v. 509, n. 10, p. 4098-4103, 2011/03/10/ 2011. ISSN 0925-8388.
Disponível em: < http://www.sciencedirect.com/science/article/pii/S0925838810017834 >.
24. GANGWAR, B. P. et al. Combustion synthesized La2O3 and La(OH)3: recyclable catalytic activity towards Knoevenagel and Hantzsch reactions. RSC Advances, v. 4, n. 98, p. 55407-55416, 2014. Disponível em: < http://dx.doi.org/10.1039/C4RA08353A >.
25. ALVES, N.; FERRAZ, W. B.; FARIA, L. O. Synthesis and investigation of the luminescent properties of carbon doped lanthanum aluminate (LaAlO3) for application in radiation dosimetry. Radiation Measurements, n. 0, 2014. ISSN 1350-4487. Disponível em: < http://www.sciencedirect.com/science/article/pii/S1350448714000341 >.