Braz. J. of Develop.,Curitiba, v. 6, n. 10, p.83726-83738, oct. 2020. ISSN 2525-8761
Modulation of gene expression in mice treated with sugar and whey protein
isolate
Modulação da expressão gênica em camundongos tratados com açúcar e isolado
de proteína de soro de leite
DOI:10.34117/bjdv6n10-710
Recebimento dos originais: 13/09/2020 Aceitação para publicação: 30/10/2020
Breno Cesar Peroni Mestrado
Universidade Federal do Paraná
Endereço completo: Av. Cel. Francisco H. dos Santos, 100 - Jardim das Américas, Curitiba - PR, 81531-980
E-mail: [email protected]
Ana Cláudia Martins Braga Gomes Torres Doutorado
Instituição de atuação atual: Universidade Federal do Paraná Endereço completo: Avenida Affonso Camargo, 849 - Cristo-Rei
CEP:80050-370 Curitiba-PR E-mail: [email protected]
Luciane Viater Tureck Doutorado
Instituição de atuação atual: Universidade Federal do Paraná
Endereço completo: Av. Cel. Francisco H. dos Santos, 100 - Jardim das Américas, Caixa Postal 19031, Curitiba - PR, 81531-980
E-mail: [email protected]
Ricardo Lehtonen Rodrigues de Souza doutorado
Instituição de atuação atual: Universidade Federal do Paraná
Endereço completo: Depto de Genética, Setor de Ciências Biológicas, Centro Politécnico, Jardim das Américas, Curitiba, PR
E-mail: [email protected]
Ana Claudia Bonatto Doutorado
Instituição de atuação atual: Universidade Federal do Paraná
Endereço completo: Rua Cel. Francisco H. dos Santos, 100 - Jardim das Américas, Curitiba - PR, 81531-980
Braz. J. of Develop.,Curitiba, v. 6, n. 10, p.83726-83738, oct. 2020. ISSN 2525-8761 Michel Fleith Otuki
Doutorado
Instituição de atuação atual: Universidade Federal do Paraná
Endereço completo: Av. Cel. Francisco H. dos Santos, 100 - Jardim das Américas, Caixa Postal 19031, Curitiba - PR, 81531-980
E-mail: [email protected]
Lupe Furtado Alle doutorado
Instituição de atuação atual: Universidade Federal do Paraná
Endereço completo: Depto de Genética, Setor de Ciências Biológicas, Centro Politécnico, Jardim das Américas, Curitiba, PR
E-mail: [email protected]
ABSTRACT
This study compared the effects of three different types of diets (regular diet, high in sugar diet and high in sugar plus whey protein isolate supplementation diet) in mice. After 3 months, gene expression in liver and in adipose tissue was measured. We found that diets influenced in gene expression, but not supplementation. However, supplementation showed an anorectic effect, and protected animals from hepatic steatosis. In addition, the diets did not influence the myeloperoxidase activity in the adipose tissue, showing little influence on the infiltration of white cells in this tissue.
Key-words: De novo lipogenesis, Whey protein isolate, ChREBP. RESUMO
Este estudo comparou os efeitos de três tipos diferentes de dietas (dieta regular, alta em açúcar e alta em açúcar mais proteína isolada de soro de leite) em ratos. Após 3 meses, a expressão gênica no fígado e no tecido adiposo foi medida. Constatamos que as dietas influenciaram na expressão gênica, mas não na suplementação. Entretanto, a suplementação mostrou um efeito anorético, e protegeu os animais da esteatose hepática. Além disso, as dietas não influenciaram a atividade da mieloperoxidase no tecido adiposo, mostrando pouca influência sobre a infiltração de células brancas neste tecido.
Braz. J. of Develop.,Curitiba, v. 6, n. 10, p.83726-83738, oct. 2020. ISSN 2525-8761 1 INTRODUCTION
How nutrition influences the regulation of metabolic pathways through modulation of gene expression, and how this regulation affects the development of diseases, are topics increasingly studied and of great interest today (Tucker et al., 2015).
One of the energy metabolism pathways is de novo lipogenesis (DNL), which generates lipids primarily from glucose. In obese individuals, DNL is deficient in white adipose tissue (WAT) because adipocytes are resistant to glucose uptake, mainly due to reduced glucose transporter 4 (Glut4) translocation (Tang et al., 2016). However, hepatic DNL is increased in obese individuals, potentially generating fat accumulation and lipotoxicity. Interestingly, according to(Cao et al., 2008), increased DNL in WAT is capable of suppressing hepatic DNL. Lipotoxicity is also seen in adipose tissue of obese individuals, and is marked by an increase in immune cell infiltration, such as neutrophils, which can be identified through the enzymatic activity of myeloperoxidase (Dam et al., 2016; Zhang et al., 2014).
It is proposed that, at least in part, mTORC2 promotes the expression of Chrebpβ and DNL by controlling the entry of glucose into cell (Tang et al., 2016). It has been demonstrated by (Tato et al., 2011) that in vitro cell stimulation with a mixture of essential amino acids, non-essential amino acids and L-glutamine, triggers the phosphorylation of Aktserine 473 via mTORC2/PI3K class I, revealing for the first time the stimulation of mTORC2 by amino acids. Considering that DNL is mainly coordinated by the isoforms of the transcription factor ChREBP (alfa and beta), which binds in its DNA response element and activates the expression of genes that favor lipogenesis (Nelson et al., 2014), we hypothesized that the use of whey protein isolate can modulate the activity of mTORC2, which controls Chrebp expression.
Thus, the goal of this work was to investigate whether whey protein isolate consumption is capable of modulating the Chrebpα and β expression in liver and adipose tissue of mice and also to influence other related physiological responses, such as consumption, myeloperoxidase enzymatic activity (MPO) and hepatic steatosis development.
2 MATERIALS AND METHODS
2.1 EXPERIMENTAL DESIGN AND DIETS
For this experiment, we used as a reference the Guide for the Care and Use of Laboratory Animals and Institute for Laboratory Animal Research (U.S.) (2011). The experiment was approved by the Ethics Committee on the Use of Animals, Biological Sciences Sector, Federal University of Paraná (protocol number 23075.006828/2018-31). Thirty male Mus musculus Swiss lineage mice, 3– 4 weeks old, were purchased from of the vivarium of the Federal University of Paraná, Curitiba,
Braz. J. of Develop.,Curitiba, v. 6, n. 10, p.83726-83738, oct. 2020. ISSN 2525-8761
Brazil. The animals had ad libitum access to food and water throughout the experiment (McAllan et al., 2013) and were maintained at 23°C, with a 12 h light–12 h dark cycle (06.00–18.00 hours).
After a 1-week acclimatization period, during which the animals were fed a basal diet (Presence® InVivo), the animals were randomly assigned to a group (n=10), which was defined according to the diet: basal diet (BD), a high refined carbohydrate-containing diet (HC) or a high refined carbohydrate-containing diet with whey protein isolate (WHC) (Table 1). The animals were submitted to these diets for 12 weeks.
The diets were characterized as follows: 1) the basal diet (BD; normocaloric and normoglycidic) (Presence® InVivo); 2) the high refined carbohydrate-containing diet based on the diet of Oliveira et al. (2013) (HC: 45% energy as condensed milk (Nestle®) consisted of 10% energy as sucrose (Caravelas®); 45% energy as basal diet (Presence®) and 3) the high refined carbohydrate-containing diet with whey protein isolate (WHC; 45% energy as condensed milk; 10% energy as sucrose; 45% energy as basal diet + 15.74g of WPI (BlackSkull). The nutritional information of the diets can be seen in table 01.
Table 1. Nutritional table of the diets containing the amounts of energy, carbohydrates, proteins, fats and fibers.
Basal diet (BD); High refined carbohydrate-containing diet (HC); High refined carbohydrate-containing diet with whey protein isolate (WHC).
HC: 45% condensed milk; 10% sucrose; 45% basal diet
WHC: 45% condensed milk; 10% sucrose; 45% basal diet + 15,74g of WPI.
2.2 ENERGY INTAKE AND WEIGHT MEASUREMENTS
During the experiment mice were weighted weekly. Mean energy intake was calculated based on the amount of food consumed by each group daily during the study period. At week 12, blood was collected through the tail vein to measure the glycemia of the animals using the AccuChek Performa Kit (Roche®).
After blood collection, the animals were euthanized by cervical dislocation without the use of anesthesia to avoid the influence of the drugs over gene expression (AL-MOUSAWI et al., 2010). Samples of the perigonadal adipose tissue (WAT) and liver were collected and fixed in paraffin to make histological slides, and parts of both tissues were stored in RNAlater (Thermo Fisher Scientific®) at -80 °C according to the manufacturer instructions, for further RNA extraction and retrotranscription.
Braz. J. of Develop.,Curitiba, v. 6, n. 10, p.83726-83738, oct. 2020. ISSN 2525-8761 2.3 HISTOLOGICAL EVALUATION
Collected liver and adipose tissue samples were fixed in ALFAC solution (80% ethanol, 40% formalin and glacial acetic acid). The tissues were then dehydrated, embedded in paraffin, and sectioned into 5 μm slices. Slices were hydrated in xylene and a descending sequence of ethanol, then stained with hematoxylin and eosin. Fat accumulation in liver sections was observed according to Brunt et al. (1999). To evaluate hepatic steatosis, slices were photographed at a magnification of 40× with an Olympus microscope DX51 endowed with an Olympus DP72 camera.
2.4 MYELOPEROXIDASE (MPO) ENZYMATIC ACTIVITY ASSAY
As described by Mendes et al. (2012), the biopsies of adipose tissue with an average weight of 40 milligrams had their MPO enzymatic activity determined colorimetrically using a plate reader (EL808; BioTech Instruments, INC) set to measure absorbance at 630 nm and expressed as OD/Biopsy.
2.5 QUANTIFICATION OF CHREBPΑ AND CHREBPΒ GENES EXPRESSION LEVELS Total RNA was isolated from hepatic and perigonadal adipose tissues with mirVana™ PARIS™ Kit, according to the manufacturer instructions. The quantity of total RNA was estimated by spectrophotometry (260nm), then the DNase I (DNase I, RNase-free, Thermo Scientific™) was added. After that, the cDNA was obtained using the High-Capacity cDNA Reverse Transcription – Applied Biosystems.
The gene expression levels were analyzed by quantitative real-time PCR assay (RT-qPCR) using EvaGreen® qPCR System ROX Free Master kit (Biotium™) and a ROX reference dye (Thermo Scientific™), performed in Viia 7™ Real Time PCR System equipment (AppliedBiosystems).The primer sequences for RT-qPCR were the same described by (Herman et al., 2012). Three assays for each sample (triplicate) were made and mean values were calculated. Data were obtained as Ct values and were normalized to the expression of GAPDH (housekeeping gene) according to ΔΔCt = ΔCt target gene - ΔCt housekeeping gene. The relative gene expression was calculated using 2- ΔΔCt.
2.6 STATISTICS
Data are shown as means and standard deviation (SD). The normality of the continuous data was evaluated by the Kolmogorov-Smirnov test with Lilliefors correction and Shapiro-Wilk test. Kruskal-Wallis test with post-hoc tests (Dunn test) were performed to compare the amount of food/energy ingested and Δ weight between groups and also within groups between intervals of time. The same test was applied to evaluate the gene expression levels between the groups. One-Way
Braz. J. of Develop.,Curitiba, v. 6, n. 10, p.83726-83738, oct. 2020. ISSN 2525-8761
ANOVA was used to compare the glycemic means between the groups. Comparisons of gene expression levels between tissues within each group were performed by Mann-Whitney U test. Multivariable regression analysis, corrected for weight and when appropriated also for MPO activity were performed. Statistical significance adopted was 5%.
3 RESULTS
3.1 ENERGY INTAKE AND BODY WEIGHT
It was possible to identify a particular pattern of food intake within the BD, HC and WHC groups (Table 1). Animals in the BD group increased their food consumption between the intervals of time A and B, and finished the experiment (9 to 12 week) with a higher energy intake compared to the first interval of time (1-4 week). Regarding the HC group, there was no difference in the food intake between the intervals of time A and B, however, the animals decreased their consumption in the last period (9-12 week) compared to first (A) and second intervals of time (B), while the animals in the WHC group decreased their consumption only in the last time range (9-12 week) compared to second time range (B) (Table 1).
Comparing the food intake patterns between groups within the same time range (Table 1), we observed that in the first period of experiment (A) the HC group showed the highest food intake. In the middle of the experiment (5-8 week), HC and WHC groups became similar, as well as the HC and BD group, and the BD group showed a higher consumption compared to WHC group. In the last period of time, the HC and WHC remained similar, as well as the food intake remained higher in the BD group compared to WHC, and, now, also higher compared to HC group (Table 1). At the end of the experiment (12 weeks), the HC group consumed 17,860.59 Kcal, the BD group consumed 16,714.22 Kcal and the WHC group consumed 15,907.68 Kcal. Thus, the HC group consumed a total of 1147.4 Kcal more than the BD group and 1952.9 Kcal more than the WHC group.
Braz. J. of Develop.,Curitiba, v. 6, n. 10, p.83726-83738, oct. 2020. ISSN 2525-8761
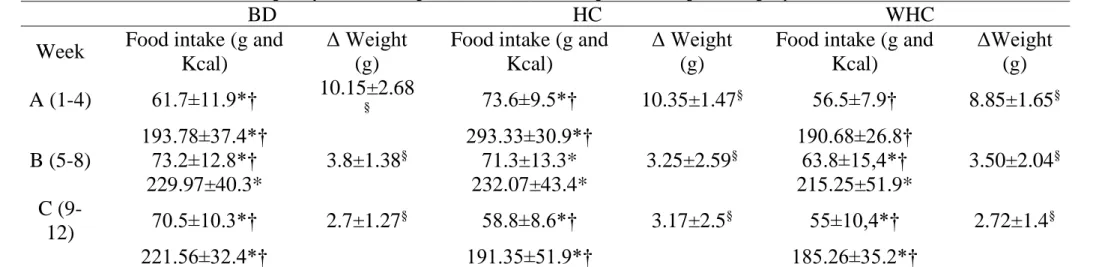
Table 2: Average daily food intake (in grams and calories) and average Δ of the weight in each group in intervals of time
BD
HC
WHC
Week
Food intake (g and
Kcal)
Δ Weight
(g)
Food intake (g and
Kcal)
Δ Weight
(g)
Food intake (g and
Kcal)
ΔWeight
(g)
A (1-4)
61.7±11.9*†
10.15±2.68
§73.6±9.5*†
10.35±1.47
§56.5±7.9†
8.85±1.65
§193.78±37.4*†
293.33±30.9*†
190.68±26.8†
B (5-8)
73.2±12.8*†
3.8±1.38
§71.3±13.3*
3.25±2.59
§63.8±15,4*†
3.50±2.04
§229.97±40.3*
232.07±43.4*
215.25±51.9*
C
(9-12)
70.5±10.3*†
2.7±1.27
§58.8±8.6*†
3.17±2.5
§55±10,4*†
2.72±1.4
§221.56±32.4*†
191.35±51.9*†
185.26±35.2*†
BD: basal diet; HC: high refined carbohydrate-containing diet; WHC: high refined carbohydrate-containing diet with whey protein isolated; Δ Weight: delta weight (final weight – initial weight in each interval of time).
Comparisons of food intake (g and Kcal) and Δ weight (g) in each groupbetweenintervals of time: *p-value <0.05BD: AxB/AxC, HC: AxC/BxC,WHC:BxC; Comparisons of food intake (g and Kcal) and Δ weight (g) in each interval of time between groups: †p-value <0.05 A: BDxHC/HCxWHC, B: BDxWHC, C: BDxHC/BDxWHC; §p-value <0.05
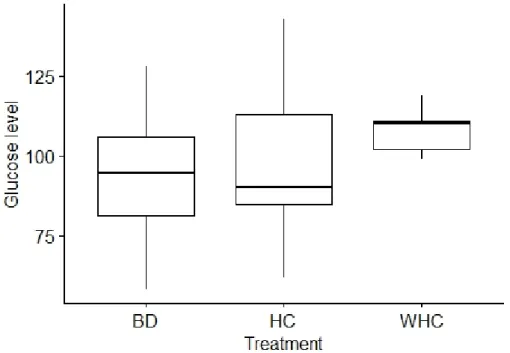
Braz. J. of Develop.,Curitiba, v. 6, n. 10, p.83726-83738, oct. 2020. ISSN 2525-8761 The gain of weight (Δ Weight: final average – initial average) in each group following the same intervals of time are also available in the Table 1. Despite the differences observed in the food intake between the groups, this did not reflect in a significant increase of animals weight, since there was no difference in the Δ weight between groups in the same intervals of time (p>0.05).Regarding the comparisons of Δ weight between the intervals of time within the same group, it seemed to follow the energy intake patterns. In the BD group, the highest animals’ weight increase occurred in the first period of time (A), compared to second (B) and last period (C).The same could be observed in the HC and WHC groups, however, the HC group reduced more the weight gain in the last interval of time (C), compared to the second interval of time (B) (Table 1). Interestingly, there was no significant difference in blood glucose between the groups at the end of the study (p = 0.285).
Figure 1: Median blood glucose between groups.
4 CHREBPΑ AND CHREBPΒ GENE EXPRESSION LEVELS, HISTOLOGICAL ANALYSIS AND MYELOPEROXIDASE ACTIVITY
Both, ChREBPα and ChREBPβ gene expression levels in the adipose tissue were higher in the BD group compared to WHC group (p= 0.0002 and 0.008, respectively), and also comparing BD and HC groups regarding ChREBPα expression levels (p=0.04). In the liver tissue, only ChREBPα expression levels were higher in BD group compared to HC group (p=0.03)(Figure 1). When the analysis were corrected for weight and myeloperoxidase activity, the dietary pattern was responsible for 33% of the variation in ChREBPα expression levels and
Braz. J. of Develop.,Curitiba, v. 6, n. 10, p.83726-83738, oct. 2020. ISSN 2525-8761 for 39% of the variation in ChREBPβ expression levels in the adipose tissue (p=0.003; p=0.001, respectively).Corrected for weight, the dietary pattern did not influence de ChREBPα and
ChREBPβ expression levels in the liver tissue (p>0.05).
Comparisons of the gene expression levels between adipose and liver tissues were also made in each group. It was possible to observe that in the BD group the average of ChREBPα gene expression levels was higher in the adipose tissue compared to liver (p=0.01), while in the WHC group was observed the opposite: ChREBPα gene expression levels were higher in the liver compared to adipose tissue (p=0.002). Regarding the ChREBPβ gene expression levels, HC and WHC groups showed higher expression levels in the liver compared to adipose tissue (p=0.001; p=0.003, respectively).
The myeloperoxidase enzymatic activity in the adipose tissue was similar between BD, HC and WHC groups (p=0.52). The WHC group did not develop hepatic steatosis, while the HC group developed it(Figure 2).
Braz. J. of Develop.,Curitiba, v. 6, n. 10, p.83726-83738, oct. 2020. ISSN 2525-8761 5 DISCUSSION
The food intake in grams and Kcal was measured to evaluate if any of the diets would have power to generate greater satiety. It is know that a high-protein diet can increase satiety (Westerterp-Plantenga et al., 2012). Moreover, a diet rich in whey protein and its fractions is able to increase the satiety of obese rats in part by enhancing the expression of the mRNAs of peptide YY (PYY) in the colon and plasma of the animals, generating an anorectic effect (Zapata et al., 2018). Interestingly, although the diets of the BD and WHC groups had practically the same amount of protein per serving, in the first six weeks of the experiment the WHC group consumed on average 205 Kcal less than the BD group and averaged 807 Kcal less at the end of the experiment. Therefore, it is believed that even though the WHC diet was palatable, the anorectic influence of whey protein generated lower energy consumption in this group. This effect can be confirmed by the fact that the lack of whey protein in the HC group generated an average increase in consumption of 1652 Kcal in the first six weeks and 1550 Kcal at the end of the study, in relation to BD and WHC groups. However, it is important to note that the HC diet had a smaller dose of protein per serving than that of the BD and WHC groups.
As shown in table 2, the food and energy consumption during the study period had interesting fluctuations. The consumption of food and energy was higher in the HC group during the first 4 weeks of study, probably due to the high palatability of the diet in relation to the others (Denis et al., 2015), but this difference was ablated in the subsequent weeks of the study, probably due to the phenomenon of sensory specific satiety (SSS), which describes the decline in pleasantness associated with a food as it is eaten relative to a food that has not been eaten before (Wilkinson and Brunstrom, 2016). In other words, they probably "got sick" of the diet.
In adipose tissue, gene expression of both isoforms was significantly higher in the control group compared to the two treated groups. This shows that a diet low in refined sugar actually favors DNL in this tissue. However, we found no significant differences in gene expression between the treated groups (HC and WHC). So, it seems, supplementation with WPI was not able to compensate the effects of refined sugar and maintain gene expression more similar to the BD group.
We believe that in the HC and WHC groups there was a greater abundance of glucose in the liver compared to the BD group, partially due to the higher expression of Chrebpα (BD x WHC) and Chrebpβ (BD x HC and WHC) in livers compared to adipose tissue. There was a probable reduced glucose uptake in the adipose tissue of the animals of HC and WHC groups mainly inferred by the lower expression of Chrebpβ, which according to (Abdul-Wahed et al.,
Braz. J. of Develop.,Curitiba, v. 6, n. 10, p.83726-83738, oct. 2020. ISSN 2525-8761 2017) is most directly influenced by the concentration of glucose. There was no significant difference in the mean serum glucose from the groups at the end of the experiment, but most likely there were insulin variations (unmeasured data), corroborating the findings of (Oliveira et al., 2013), and insulin resistance is predicted to reduce the entry of glucose into adipose tissue, as it depends on GLUT-4.
Interestingly, although the WHC group also consumed a diet rich in sucrose and has shown a gene expression similar to the HC group, there was no development of hepatic steatosis in this group. At least two possibilities may be considered to explain this positive result in the WHC group. The first, is that WPI supplementation led to a better utilization of glucose in the hepatocytes, through anti-inflammatory mechanisms and improvement of insulin sensitivity (GO et al., 2018; McAllan et al., 2013). The second is that the caloric restriction per se generated a reduction in glucose uptake in hepatocytes due to the lower availability by the food consumption itself, generating a less lipogenic environment. However, it is most likely that these two conditions worked together.
A limiting factor of our work was that the lineage of mice used was heterogenetic, which may have generated a different responsiveness among individuals due to variations in their different genotypic constellation and consequently differentiated responsiveness to the same treatment.
6 CONCLUSIONS
We demonstrate that the use of a high refined carbohydrate-containing diet can influence gene expression in the liver and in the adipose tissue of mice, but not supplementation with WPI. Supplementation of whey protein isolate with caloric restriction appears to protect the liver of animals against the development of fatty liver disease, even with the consumption of a high refined carbohydrate-containing diet. In addition, whey protein isolate supplementation appears to have an anorectic effect in mice.
Braz. J. of Develop.,Curitiba, v. 6, n. 10, p.83726-83738, oct. 2020. ISSN 2525-8761 REFERENCES
Abdul-Wahed, A., Guilmeau, S., Postic, C., 2017. Sweet Sixteenth for ChREBP: Established Roles and Future Goals. Cell Metab. 26, 324–341. https://doi.org/10.1016/j.cmet.2017.07.004
Cao, H., Gerhold, K., Mayers, J.R., Wiest, M.M., Watkins, S.M., Hotamisligil, G.S., 2008. Identification of a Lipokine, a Lipid Hormone Linking Adipose Tissue to Systemic Metabolism. Cell 134, 933–944. https://doi.org/10.1016/j.cell.2008.07.048
Dam, V., Sikder, T., Santosa, S., 2016. From neutrophils to macrophages: Differences in regional adipose tissue depots. Obes. Rev. 17, 1–17. https://doi.org/10.1111/obr.12335
Denis, R.G.P., Joly-Amado, A., Webber, E., Langlet, F., Schaeffer, M., Padilla, S.L., Cansell, C., Dehouck, B., Castel, J., Delbès, A.S., Martinez, S., Lacombe, A., Rouch, C., Kassis, N., Fehrentz, J.A., Martinez, J., Verdié, P., Hnasko, T.S., Palmiter, R.D., Krashes, M.J., Güler, A.D., Magnan, C., Luquet, S., 2015. Palatability can drive feeding independent of AgRP neurons. Cell Metab. 22, 646–657. https://doi.org/10.1016/j.cmet.2015.07.011
GO, K., KUWADA, E., YAMADA, H., UTO, Y., IZUCHI, Y., HAYAKAWA, A., TASAKA, T., TOKUNAGA, K., GO, A., NISHIGAWA, R., UNUMA, H., 2018. Concentration-dependent Activation of Inflammatory/Anti-inflammatory Functions of Macrophages by Hydrolyzed Whey Protein. Anticancer Res. 38, 4299–4304. https://doi.org/10.21873/anticanres.12728
Herman, M.A., Peroni, O.D., Villoria, J., Schön, M.R., Abumrad, N.A., Blüher, M., Klein, S., Kahn, B.B., 2012. A novel ChREBP isoform in adipose tissue regulates systemic glucose metabolism. Nature 484, 333–338. https://doi.org/10.1038/nature10986
McAllan, L., Keane, D., Schellekens, H., Roche, H.M., Korpela, R., Cryan, J.F., Nilaweera, K.N., 2013. Whey protein isolate counteracts the effects of a high-fat diet on energy intake and hypothalamic and adipose tissue expression of energy balance-related genes. Br. J. Nutr. 110, 2114–26. https://doi.org/10.1017/S0007114513001396
National Research Council (U.S.). Committee for the Update of the Guide for the Care and Use of Laboratory Animals., Institute for Laboratory Animal Research (U.S.), 2011. Guide for the care and use of laboratory animals. National Academies Press.
Nelson, D.L. (David L., Cox, M.M., Lehninger, A.L., Termignoni, C., 2014. Princípios de bioquímica de Lehninger, 6 ed. ed.
Oliveira, M.C., Menezes-Garcia, Z., Henriques, M.C.C., Soriani, F.M., Pinho, V., Faria, A.M.C., Santiago, A.F., Cara, D.C., Souza, D.G., Teixeira, M.M., Ferreira, A.V.M., 2013. Acute and sustained inflammation and metabolic dysfunction induced by high refined carbohydrate-containing diet in mice. Obesity 21, 396–406. https://doi.org/10.1002/oby.20230
Tang, Y., Wallace, M., Sanchez-Gurmaches, J., Hsiao, W.-Y., Li, H., Lee, P.L., Vernia, S., Metallo, C.M., Guertin, D.A., 2016. ARTICLE Adipose tissue mTORC2 regulates ChREBP-driven de novo lipogenesis and hepatic glucose metabolism. https://doi.org/10.1038/ncomms11365
Braz. J. of Develop.,Curitiba, v. 6, n. 10, p.83726-83738, oct. 2020. ISSN 2525-8761 Tato, I., Bartrons, R., Ventura, F., Rosa, J.L., 2011. Amino Acids Activate Mammalian Target of Rapamycin 286, 6128–6142. https://doi.org/10.1074/jbc.M110.166991
Tucker, K.L., Smith, C.E., Lai, C., Ordovas, J.M., 2015. Quantifying Diet for Nutrigenomic Studies 349–371. https://doi.org/10.1146/annurev-nutr-072610-145203.Quantifying
Westerterp-Plantenga, M.S., Lemmens, S.G., Westerterp, K.R., 2012. Dietary protein - Its role in satiety, energetics, weight loss and health. Br. J. Nutr. 108. https://doi.org/10.1017/S0007114512002589
Wilkinson, L.L., Brunstrom, J.M., 2016. Sensory specific satiety: More than “just” habituation? Appetite 103, 221–228. https://doi.org/10.1016/j.appet.2016.04.019
Zapata, R.C., Singh, A., Chelikani, P.K., 2018. Peptide YY mediates the satiety effects of diets enriched with whey protein fractions in male rats. FASEB J. 32, 850–861. https://doi.org/10.1096/fj.201700519RR
Zhang, W., Zou, M.-H., Zhou, J., Xie, Z., Zhang, M., Wang, Q., Wu, Y., Zhu, H., 2014. Myeloperoxidase Deletion Prevents High-Fat Diet-Induced Obesity and Insulin Resistance. Diabetes 63, 4172–4185. https://doi.org/10.2337/db14-0026