MASTERS IN
F
INANCE
M
ASTERS
F
INAL
W
ORK
PROJECT
EQUITY RESEARCH – MARRIOT INTERNATIONAL
M
ANUEL
J
OSÉ
C
ENTENO
C
ASTANHO
N
AVES
L
AIA
SEPTEMBER 2014
ii
M
ASTERS
F
INAL
W
ORK
PROJECT
E
QUITY
R
ESEARCH
-
M
ARRIOT
I
NTERNATIONAL
MANUEL JOSÉ CENTENO CASTANHO NAVES LAIA
A
DVISOR:
P
ROFESSORM
ARIAI
NÊSP
INTOiii
Abstract
Marriot International, Inc. is one of the largest companies operating in the lodging sector worldwide. Founded by the Marriot family, the company has always followed and believed in a number of strong values that have seen the company become an industry leader, values such as excellence, integrity and putting people first. Marriot International is also widely recognized for its strong management skills, which have driven the company to consistently good results, despite the financial crises which we have faced over the last few years. The objective of the present work is to determine the intrinsic value of Marriot International stocks, through a specific analysis of the company operational performance and of its outside environment. The present valuation was based on the method Free Cash Flow to Firm and WACC, which according to a review of relevant literature constitutes the most adequate model for evaluation of Marriot International. However, we have also applied the relative valuation method in order to complement the valuation process.
Following on from the valuation process, it was possible to state that Marriot International stocks on 31/12/2013 were undervalued. More specifically, stocks were being trade at $49,35, below the intrinsic value of $53.87, thus presenting
a potential appreciation of 9,2%. Consequently, the advice and
recommendation to be given to interested investors is to buy.
Keywords: Valuation, Free Cash Flow to Firm, Equity Value, Enterprise Value, Lodging Industry, Marriot International.
iv
PREFACE
I would like to express my gratitude to Professor Inês Pinto for all the patience and availability during the guidance of this work; to my father Amaro Laia, for his unconditional love, experience and orientation not only in my professional life but also in everything that i am today and that i will be in the future; to my professional mentor Tiago Estevinho for his helpful knowledge and constant availability; finally to Carlota Rebelo de Andrade, my dear mother Maria
Centeno and my “Avó Zita”, for the unconditional support along the way, without them this work would probably be in the first written line and wouldn’t be done. Thank you all.
v INDEX ABSTRACT ...III INDEX ... V 1 INTRODUCTION ...4 2 LITERATURE REVIEW ...5 2.1 VALUATION METHODS... 6
2.1.1 Discounted Cash Flows (DCF) ... 6
2.1.2 Relative Valuation ... 14
2.1.3 Contingent claim Valuation – Real Options ... 15
2.1.4 Other valuation methods specific for hotel valuation ... 16
3 COMPANY PRESENTATION ... 17
3.1 BUSINESS MODEL ... 18
3.2MARRIOT´S FUTURE STRATEGY ... 18
3.3 OPERATIONAL PERFORMANCE ... 20
3.4 STOCK PERFORMANCE, DIVIDEND POLICY AND SHAREHOLDERS STRUCTURE ... 23
3.5 SWOT ANALYSIS AND PORTER´S 5 FORCES ... 25
4 MACROECONOMIC ENVIRONMENT AND LODGING INDUSTRY OVERVIEW ... 26
4.1GLOBAL LODGING INDUSTRY OVERVIEW ... 29
5 VALUATION ... 31
5.1 METHOD ... 31
5.2 VALUATION ASSUMPTIONS ... 31
5.2.1 Revenues ... 31
5.2.2 EBITDA margin ... 32
5.2.3 Capital Expenditures, Amortizations and Depreciations ... 33
5.2.4 Net Working Capital ... 34
5.2.5 Cost of Debt ... 35
5.2.6 Beta ... 35
5.2.7 Market Risk Premium ... 35
5.2.8 Tax Rate ... 35
5.2.9 Debt to Equity ratio ... 36
5.2.10 WACC ... 36
5.2.11 Perpetuity growth rate ... 36
5.2.12 FCF, Equity Value and Enterprise Value of Marriot International... 37
6 VALUATION RESULTS ... 37
9 SENSITIVITY ANALYSIS AND RELATIVE VALUATION ... 38
10 CONCLUSION ... 39
BIBLIOGRAPHY ... 40
APPENDIX ... 44
1
FIGURES INDEX
Figure 1 - Marriot International SWOT Analysis ... 25
Figure 2 - Marriot International Porter´s 5 Forces ... 25
FÓRMULAS INDEX Formula 1 - Discounted Cash Flow ... 7
Formula 2 - Gordon Model ... 8
Formula 3 - FCFE ... 9
Formula 4 - Equity Value ... 9
Formula 5 - Cost of Equity (CAPM) ... 10
Formula 6 - FCFF ... 12
Formula 7 - Enterprise Value ... 12
Formula 8 - Weighted Average Cost of Capital (WACC) ... 12
Formula 9 - Adjusted Present Value ... 13
Formula 10 - Unlevered Cost of Equity (Ku)... 14
Formula 11 - Unlevered Beta ... 14
Formula 12 - Unlevered Cost of Equity (r wacc) ... 14
GRAPHIC INDEX Graphic 1 - Marriot International Business Model (2013; %) ... Graphic 2 - Marriot International Results (2011-2013; million dollars) ... 20
Graphic 3 - Marriot International Capital Expenditures (2011-2013; million dollars) ... 22
Graphic 4 - Marriot International Debt Outstanding (2011-2013; million dollars) ... 23
Graphic 5 - Marriot International Stock Price (2011-2013; Dollars) ... 24
2
TABLE INDEX
Table I - United States Economic Figures ... 26
Table II - European Union Economic Figures (2011-2018; %) ... 27
Table III - Latin America and Caribbean Economic Figures (2011-2018; %) ... 27
Table IV - Middle East and North Africa Economic Figures (2011-2018; %) ... 28
Table V - Emerging and Developing Asia Economic Figures (2011-2018; %) ... 29
Table VI - Growth Rates Projections (2014-2018; %) ... 32
Table VII - Revenues Projections (2014-2018) ... 32
Table VIII - EBITDA Projections (2014-2018) ... 33
Table IX - Capital Expenditures Projections (2014-2018) ... 33
Table X - Depreciations and Amortizations Projections (2014-2018) ... 34
Table XI - Changes in NWC Projections (2014-2018) ... 34
Table XII - Market Risk Premium ... 35
Table XIII - WACC ... 36
Table XIV - FCFF ... 37
Table XV - Valuation Results ... 37
3
LIST OF TERMS AND ABBREVIATIONS APT – Arbitrage Pricing Theory
APV – Adjusted Present Value ARR – Average Room Rate CapEx – Capital Expenditures
CAPM – Capital Asset Pricing Model DCF – Discounted Cash Flow
DDM – Dividend Discount Model
EBIT – Earnings Before Interest and Taxes
EBITDA – Earnings Before Interest, Taxes, Depreciation and Amortization EU – European Union
EV – Enterprise Value
FCFE – Free Cash Flow to Equity FCFF – Free Cash Flow to the Firm GDP – Gross Domestic Product NWC – Net Working Capital PER – Price to Earnings Ratio
RevPar – Revenue per Available Room USA – United States of America
WACC – Weighted Average Cost of Capital WTTC – World Tourism & Travel Council
4
1 Introduction
The aim of this Master’s project is to estimate the price target of Marriot International. To achieve this aim, we begin by discussing the methods and tools commonly used in establishing the value of a firm. According to the International Valuation Standards,1 market value is: “The estimated amount for which an asset or liability should exchange on the valuation date between a willing buyer and a willing seller in an arm’s length transaction, after proper marketing and where the parties had each acted knowledgably, prudently and without compulsion.” Essentially, this type of value is based on the average market conditions in a certain date and, consequently, it is no concerned with the specific drives of a single investor; which are define by another type of value – The Investment Value.
In establishing that Marriot International is a publicly-held firm, we could accept its market capitalization as its market value. In this light, the aim of this work would essentially already have been achieved. However, economic agents do not always act based on rational assumptions and sometimes there is asymmetric information to be taken into account. In reality, there are no efficient markets. Moreover, the valuation made by these economic agents, which is embedded in market capitalization, can be above or below the intrinsic value of the company. By intrinsic value we mean the estimated value in function of the firm’s capacity to generate future wealth.
1
5
In summary, this Master´s final work will estimate the “price” target (intrinsic value) of the public traded company - Marriot International.
2 Literature Review
Companies valuation is an age-old process, tracing its origins through to the present valuation method of capital budgeting and the valuation approach developed by professors Modigliani and Miller (1961). Building on this, others have gone on to popularize and develop their approaches, creating many different valuation methods and techniques, depending on the purpose and type of asset under valuation.
The key to successfully invest and manage financial assets lies in understanding not only what the value is, but also the sources of that value and how much we believe those assets are going to be worth in the future (Damodaran, 2002). The more accurate we are about the drivers of value (sales evolution, fixed costs, cost of capital…), the closer we come to the reality of what the valuation is actually going to be.
For everyone involved in the corporate finance field, understanding the mechanisms of company valuation is crucial not only for considering the relevance of valuation in acquisitions, capital budgeting and bankruptcy processes, but also because valuing a company helps to identify sources of economic value creation (Fernández, 2007, Neves, 2002).
6
2.1 Valuation Methods
Depending on the company, the objective and the time available (different models require different variables and calculations that may consume too much time, and analysts not always have enough time to apply the desired), there are a wide range of usable valuation methods. Although there is no general consensus, valuation methods are classified into three main approaches: i) Discounted Cash Flows Valuation method, ii) Relative Valuation method and iii) Contingent Claim Valuation (Real Options) (Berk and DeMarzo, 2011, Damodaran, 2002).
While considering the above, this work focuses more specifically on the discussion of the Discounted Cash Flow models. This focus is due to the fact that these models adhere to the principles of modern financial theory (time value of money and cash flows) and because they are also more rigorous than relative valuation. In contrast to real options, Discounted Cash Flow method is easier to understand and usually is less time consuming to apply. Moreover, real options cannot always be applied, although it has been recognized its advantage due to the fact of consider the value of options, namely associated to the flexibility of future management.
2.1.1 Discounted Cash Flows (DCF)
Despite the fact that most valuations are done through relative valuation (Fernandez, 2001), due to the fact that this method needs less information and time to apply, the Discounted Cash Flow method is the one which give us more precision, while anyone who understands its fundamentals will be able to use the other approaches. The Discounted Cash Flow method “sees” the company
7
as a cash flow generator and, therefore, its value depends on that cash flows and the risk associated.(Damodaran, 2002).
Discounted Cash Flow consists in discounting back expected cash flows on an asset at a rate that reflects the underlying risk of those future cash flows (Fernández, 2007). [1]
n n n n r CF Value 1(1 )Formula 1 - Discounted Cash Flow
Under normal circumstances, expected cash flows are estimated based on adjusted historical data, while the analyst often creates forecasts by extending financial statements into the future (normally with an explicit period between five and ten years ahead), adjusting them with future perceived risks and opportunities. As well as the explicit period, there is also a need to derive the value correspondent to the inexplicit period, known as terminal value which will be discussed later in this chapter.
As there are many factors to take into account, the accuracy and precision of the model lies not only in the right estimation of the company’s future cash flows that we often need to expunge and project from raw data provided, but also in other important inputs needed to derive the cost of capital which will be applied in the discounting process. However and despite our best efforts to be precise, the valuation process will always be subjective depending on the analyst own beliefs (Ruback, 2011, Pandian and Woodlock, 2013).
8
With consideration to leverage and according to the financial literature, there are two main perspectives to value stemming from the many DCF models in use: i) The Equity Valuation, ii) The Firm Valuation.
2.1.1.1 Equity Valuation
This kind of approach, as the name suggests, assesses the firm’s equity stake by discounting the cash flows available only to equity holders and at the discount rate required by them – the Cost of Equity (Ke). There are a number models within equity valuation, but the Dividend Discount Model (DDM) and the Free Cash Flow to Equity (FCFE), are the most widely known (Damodaran, 2002).
Dividend Discount Model
Dividend Discount Model is the simplest and oldest way to price a share of stock and consequently assess the equity value of a firm. This model was first developed by Williams (1938) and reviewed later by Gordon (1962), becoming afterwards known as Gordon Model. The model attests that the price for a share is the present value of the two types of cash flow that an investor is expecting from that share: dividends and expected selling price, discounted at the cost of equity (Berk, 2011, Neves, 2002). Since the expected price itself is determined by future dividends, assuming the continuity of the company and a constant dividend growth rate, the Gordon Model equals to:
[2] g Ke Div Share per ice 1 Pr
Formul a 2 - Gordon Model
Where Div is the expected dividend next year Ke is the equity cost of capital and g is the constant growth rate. The advantage of this model is it simplicity, as
9
it relies on few variables. Nevertheless, the model does have its drawbacks. For instance, dividends have an implicit uncertainty, not only in their growth rate but also if they are going to be paid to the investors or not. If the latter proves to be the case, then the value derived by the formula becomes zero and the model fails. Another important disadvantage is that the Gordon Model is very sensitive to inputs and used incorrectly can result in absurd equity valuations (Damodaran, 2002).
Free Cash Flow to Equity (FCFE)
This method, also calculates the equity value by discounting the cash flow available to equity holders at the cost of equity, but uses Free Cash Flow to Equity instead of expected dividends. The FCFE measures how much can be paid to equity shareholders after all company expenses (Copeland et al., 2000). Formul a 3 - FCF E
[3] FCFE = Net Income + Depreciations - Capital Expenditures - Δ Net Working Capital + Net Borrowing [4] ) ( ) 1 ( 1 1 Ke g FCFE Ke FCFE e EquityValu n n n n n
Formul a 4 - Equit y Value
Cost of Equity - Ke
Specifically relating to this variable, the survey approach, the three factors multifactor model developed by Fama and French (1993), the Arbitrage Pricing Theory – APT developed by Ross (1976), and the Capital Asset Pricing Model – CAPM developed by Sharp (1964) are the four main methods to derive the cost of equity (Ke). Although these methods have been recently contested by some authors due to the partial inefficiency of the markets verified in last year’s economic crises (Dempsey, 2013), the CAPM is the most effective, most
10
important and most used in practice by financial analysts (Berk and DeMarzo, 2011, Neves, 2002).
The CAPM is built on the assumptions that markets are efficient and that the relationship between risk and return is reasonably stable over time (Neves, 2002). CAPM is an equilibrium model that establishes a relationship between the price of a security and its risk trough three variables: Risk-free rate (Rf), Beta of securities (β), and expected market return E(Rm).
[5] Ke =Rf + β (E(Rm)-Rf)
Formul a 5 - C ost of Equi t y (CAPM)
Risk Free - Rf
The risk-free rate commonly used is the one comprised of treasury bonds, as it does not imply default and reinvestment risk, with it being noted that the only securities that have a chance of being risk-free are government securities. This is not to say that governments are better run than corporations, but rather that they control the printing of currency (Damodaran, 2008). Nowadays, as the recent financial crisis has shown to us, there is no more risk-free rate in countries experiencing sovereign debt crises. To this end, we cannot use those yields in those countries, meaning that the common practice is to use the yields to maturity of countries with solid treasury bonds plus a country risk premium.
Beta - β
The Beta value is calculated based on historical figures and it is obtained from the standardized covariance between the return on the security and the return on the market (Ross et al., 1996). Last but not least, the market risk premium is
11
the difference between the expected rate of return on the market portfolio E(Rm) and the risk-free rate (Koller et al., 2010).
As is verifiable with this model, we can directly establish the equity value of the company. If we wanted to calculate the enterprise value, we could simply add the market value of net debt. Normally this model is used to value companies with high growth rates or in leverage buy outs due to the large amount of debt associated to this kind of processes.
2.1.1.2 Firm Valuation
Firm valuation models value the entire company rather than just the equity stake. According to current financial literature, there are two principal models for us to assess the enterprise value: i) The WACC - that discounts the free cash flows to all claim holders (Free Cash Flow to Firm – FCFF) at the weighted average cost of capital (WACC) ii) The Adjusted Present Value (APV), that adds the marginal impact of debt to the unlevered firm value (Damodaran, 2002, Berk and DeMarzo, 2011).
Contrary to equity valuations, one should leave out the net debt value from the firm valuation results in order to get the equity value of the company.
Free Cash Flow to the Firm – (FCFF)
This is the cash flow generated by company operations only and is the money which will be available in the company for all capital providers after covering fixed asset investments and working capital requirements. The firm value is derived by discounting the FCFF at the Weighted Average Cost of Capital – WACC in the explicit period, as well as in the terminal value (Fernández, 2007, Copeland et al., 2000).
12
Formul a 6 - FCF F
[6] FCFF = EBIT (1-t) + Depreciations + Amortizations - Capital Expenditures - Δ Net Working Capital
[7]
n n n n n g WACC FCFF WACC FCFF Value Enterprise 1 1 ) ( ) 1 ( Formul a 7 - Enterpri se Valu eEBIT is earnings before interest and taxes and t is the corporate tax rate. This model is frequently used in valuations of companies with target debt to equity ratios, or constant capital structure over time. In other cases, the analyst would need to calculate the WACC every time the capital structure changes, meaning that and other models would function better in such situations.
The weighted average cost of capital reflects the opportunity cost to all capital providers, both debt and equity, weighted by their relative contribution to the company’s total capital. The WACC is calculated by weighting the cost of equity (Ke) and the cost of debt (Kd), with respect to the company´s financial structure; including the tax effect over the cost of debt.
[8] Kd (1 t) D E D Ke D E E WACC Formul a 8 - W eight ed Averag e Co st of C apit al (W ACC)
In the WACC formula, we simply need to calculate the cost of equity and the cost of debt, as the other variables can be directly expunged from the market. Relative to the first, we can make use the same method mentioned above – CAPM.
Cost of Debt - Kd
The cost of debt normally uses the rate that the company could get in the market if it were to look for debt financing. Usually, due to the lack of information and in order to get a proxy, it is the yield achieved in the last
13
financing process is commonly used, or a yield is estimated based on a synthetic rating achieved by looking for comparable rated companies (Damodaran, 2002).
Regarding terminal value, also known as perpetuity value, is calculated assuming the continuity of the company for many years ahead of the explicit period. Since we cannot calculate cash flows forever, instead calculating those FCFF individually for more than the explicit period, we take the last explicit FCFF and assume that the company cash flows will grew perpetually at a constant rate g. The formula used is similar to that used in the DDM, giving us the terminal value of the company that reflects the value of the firm at that specific point in time.
Adjusted Present Value (APV)
Rising to fame after Luehrman´s (1996) paper publicized in the Harvard Business Review, this method also calculates the value of the firm as a whole but in a different way, namely by separating and then adding three components: the firm’s unlevered value, assuming that there is no debt in the company´s financial structure; the value of the tax shield obtained as if the company were financed with debt; and the expected bankruptcy costs related to debt use (Damodaran, 2002).
[9] APV =Value of Unlevered firm + Present Value (Interest Tax Shield) - Present Value E (Bankruptcy Costs) Formul a 9 - Adj ust ed Pr esent Value
The initial stage is obtained by discounting the FCFF at the rate of return to equity that would be applicable to the company if it were to be considered as having no debt – Ku.
14
Unlevered Cost of Equity - Ku
This cost of capital is known as unlevered cost of capital (Ku) and can be calculated trough an adapted version of CAPM, with an unlevered beta instead of a levered one, or by the WACC without the tax component over debt, but only if the target debt to equity ratio holds in time (Neves, 2002, Luehrman, 1996, Berk and DeMarzo, 2011).
Formula 10 - Unlev ered Cost of Equity (Ku) Formula 11 - Unlev ered Beta
[10] Ku =Rf + βu (Rm-Rf) [11] βu = β / [1+(1-t)D/E] [12] Kd D E D Ke D E E rWACC Formula 12 - Unlev ered Cost of Equity (r wacc)
The second stage is calculated by discounting the tax benefits that flow from debt at the cost of debt (Kd) or, according to Berk and DeMarzo (2011), at the unlevered cost of equity (Ku - only if the target debt to equity ratio hold in time we could assume that the risk of debt related cash flows is similar to the FCFF). The third stage is more complex to estimate and poses the most significant estimation problems, since there is no direct way to calculate either the
probability of bankruptcy or the costs related to it. However, Titman and Shapiro claim that indirect costs could be up to 30 percent of firm value (Damodaran, 2002).
2.1.2 Relative Valuation
As mentioned earlier, this valuation approach is utilized often in most equity research reports, not only because it can be a complement to DCF valuation, despite the fact that its precision is notably separate from the DCF valuation techniques, but also because it needs less assumptions and variables. Moreover, it is quicker than DCF, it is easier to present and is much more likely
15
to reflect the current market trends (Damodaran, 2002, Holthausen and Zmijewski, 2012).
In relative valuation, the value of the company is calculated based on the market price of comparable firms. To do this, we first need to identify comparable firms, i.e. firms within the same sector of activity, similar cash flow levels, financial structure, risk and expected growth of the target company. Being identified, there is the need to convert their price into normalized and comparable values. These normalized values are pricing multiples which allow for the pricing and comparison of two or more comparable firms. According to Fernandez (2001), the most used multiple is the Price Earnings Ratio (PER), however, some multiples can be more appropriate than others, depending on the industry (in hotel valuation processes it’s commonly used the price per room). For a practical example relatively to PER, if we get from quoted companies in the market a PER of 10, then we can estimate the value of the company we are valuing multiplying by 10 its earnings.
Despite the easiness of relative valuation, it can only be used when there is a quite large number comparable firms comparable to the one under valuation. Moreover, the definition of comparable firms in itself is not always easy to establish and often leaves space for subjectivity.
2.1.3 Contingent claim Valuation – Real Options
Companies and their assets are managed in a dynamic and pro-active way, with the managers having almost total responsibility for future cash flows. Although this is intuitively known, discounted cash flows and relative valuation methods value the company in a static way. In other words, these methods
16
assume that a company’s cash flows, calculated today and based on certain assumptions, are static and it is assumed that they will not change in the future. The problem here is that most of the time managers will take decisions that will affect those cash flows and, consequently, the enterprise or equity value of the company will change. There may be another options available to the company, like developing and create different products in order to increase sales revenue or acquire a different production technology, thereby causing improvements in the operation costs (Neves, 2002, Berk and DeMarzo, 2011).
These kinds of options are known as Real Options. There are two commonly ways to value real options: the Binomial Model and the Black Scholes model. The issue here is that these models imply the calculation of many variables in a way that is highly technical and complex to use, not to mention the time that such use can imply. Also, not always Real Options can be applied, which is why this procedure is not going to be followed here, but rather left for a future work.
2.1.4 Other valuation methods specific for hotel valuation
As mentioned before, in this case the best model to evaluate Marriot International is the FCFF, discounted at WACC, not only because it is reasonable to consider a constant target debt to equity ratio, but also because it allow us to work with the company consolidated accounts without considering the value of each hotel or business unit. If we were valuing another lodging company with a different business model than Marriot, we could consider other valuation methods, more related to the intrinsic value of a company’s real estate properties. If we were concerned about the value of the hotel, as a real estate
17
asset, then the three most used methods2 are: i) Market comparative method; ii) Income method; and iii) Cost method.
The market approach is similar to relative valuation, although the comparatives of real estate market are specific, like price per square meter, in general, or price per room, particularly in the hotel sector. The income approach is based on the same methods applied in corporate field, namely DCF, or the most simple and expedite yield, or cap rate method. Regarding cost approach, this one is not a driven market method, and so, only when it is not possible the other methods this one should be applied (also, it does not work in valuing companies).
3 Company Presentation
Founded in 1927 by John Willard and Alice Marriot, Marriot International was born in Washington in a small root beer stand. After that first adventure, Marriot created the East Coast’s first drive in, the first hotel chain for business travelers and continued to innovate right up until present day. Throughout its history, the company has never stopped searching for inventive ways to serve its customers and is recognized today as a top employer and for its superior business operations.
Based on a few strong values like putting people first, pursue excellence, embrace change and act with integrity, Marriot International is one of the world’s biggest and leading hospitality companies; with more than 600,000 rooms operating worldwide.
2
18
3.1 Business Model
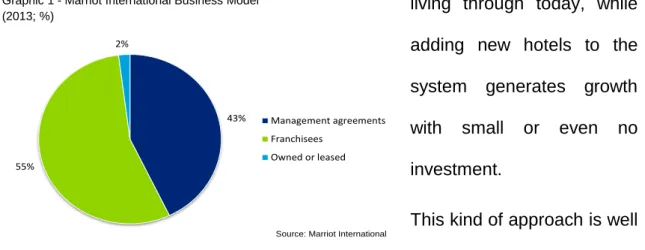
Marriot International is a worldwide operator, franchisor and licensor of hotels. In the company business model it is preferable to manage and franchise hotels, rather than own them. This is mainly because it minimizes capital investments and allows management to do what they do well: selling rooms, taking care of their guests and ensuring a strong control over operating costs. The focus of the company on long-term management contracts and franchising tends to provide more stable earnings in periods of economic softness like that which we are living through today, while adding new hotels to the system generates growth with small or even no investment.
This kind of approach is well reflected in the company’s latest annual report. Of the total population of hotel rooms under Marriot International’s control By the end of 2013, around 43% were under management agreements, 55% were operated through franchisees and only the remain 2% were owned or leased.
With regards to operations, the organization manages hotels mostly across United States of America, with the rest of the properties distributed almost evenly around the rest of the world.
3.2 Marriot´s Future Strategy
Relative to the company’s future, Marriot International aims to keep on working with the same principles, but with a stronger and larger hotel chain. Their main
43% 55% 2% Management agreements Franchisees Owned or leased
Source: Marriot International Graphic 1 - Marriot International Business Model
19
goal is to consolidate in mature markets and to grow in emerging ones. Marriot is now bigger and more global than ever. Their continental operating structure allows the company to get a close-to-market leadership, to speed up in terms of innovation and to be more efficient about clients and different cultures around the world.
In the Asia Pacific region, Marriot intends to open a new hotel every week in the current year, doubling in size, achieving 330 hotels across 16 different countries (Marriot financials, 2013). In this region, China is the biggest market with 67 hotels and 87 signed contracts for more than 80 hotels under development, representing around 80.000 new rooms.
In Africa, Marriot is mainly growing due to the recent acquisition of Protea Hotels, allowing for a doubling of distribution to more than 20,000 rooms and providing a proven operational platform and leadership team to accelerate Marriot’s growth.
In Europe, Marriot opened the London Edition in 2013, before selling it in early 2014 in a show of the value of the brand and the consistency of their asset-light strategy.
In the USA, the company ended 2013 with more than 22,000 rooms under construction, representing the biggest hotel construction portfolio in the lodge industry according to Smith Travel research (2014).
Despite the global economic crisis in the main mature markets, Marriot is growing day by day, committed to the franchise and management business model which allows the company to deliver value to shareholders through predictable and strong revenues and high returns on invested capital; proving
20
that growing distribution positively influences guests satisfaction and loyalty, thereby driving owner’s preferences, efficiency and profitability.
3.3 Operational Performance
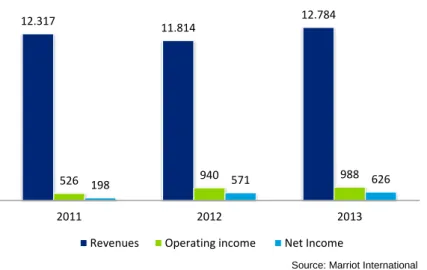
Despite a revenues decrease verified in 2012 (due to the negative contribution of a spin-off made by the company in order to separate the timeshare business segment), Marriot International has been growing over the last 3 years. This is mainly due to the continued opening of new hotels and expansion of several Marriot new brands.
Graphic 2 - Marriot International Results (2011-2013; million dollars)
Revenues
Specifically relative to results presented by the company in 2013, it is important to note that the main operational indicators have grown. Occupancy rates grew 0.9% worldwide compared to the previous year, while the average room rate (ARR3) and revenue per available room (RevPar4) grew 3.3% and 4.6%
3 By ARR, we mean the hotel guestroom revenue divided by the number of rooms sold.
4
By RevPar, we mean the hotel guestroom revenue divided by the room count. 12.317
11.814
12.784
526 198 940 571 988 626
2011 2012 2013
Revenues Operating income Net Income
21
respectively compared to 2012. This figures lead to an increase in sales of around 8.5% compared to 2012.
According to the Wright Investor Report (2014) on Marriot International, the company stands ahead of its big competitors like MGM Resorts International and Hilton Worldwide Holdings Inc, whose revenues grew 7.1% and 4.9% respectively.
Marriot 2012 revenues were about $11,814 million dollars and despite the $779 million dollars increase in the lodging business, the spin off affected the revenues negatively by $1,282 million dollars; meaning that results decrease by about 4,3% compared to 2011. In 2013, revenues growth was 8,2% or $12.784 million dollars, with 52.7% of these results linked to the North American Full-Service, 20.8% to the North American Limited-Full-Service, 12.2% to the International Segment and 14.3% to the Luxury Segment.
According to Marriot annual report 2013, around 80% of all segments and the total amount of revenues originate inside US market, with around 20% being contributed from the rest of the world.
Operating Income
As we can observe from the graphic 2, operating income has been increasing in the last 3 years, moving from $526 million dollars in 2011, to $988 million dollars in 2013. This notable performance was largely influenced by the spin off, which contributed with more than $250 million dollars of savings on operational costs. Moreover, there was an increase of results in franchise fees, in base management fees and in incentive management fees of around $120 million dollars.
22
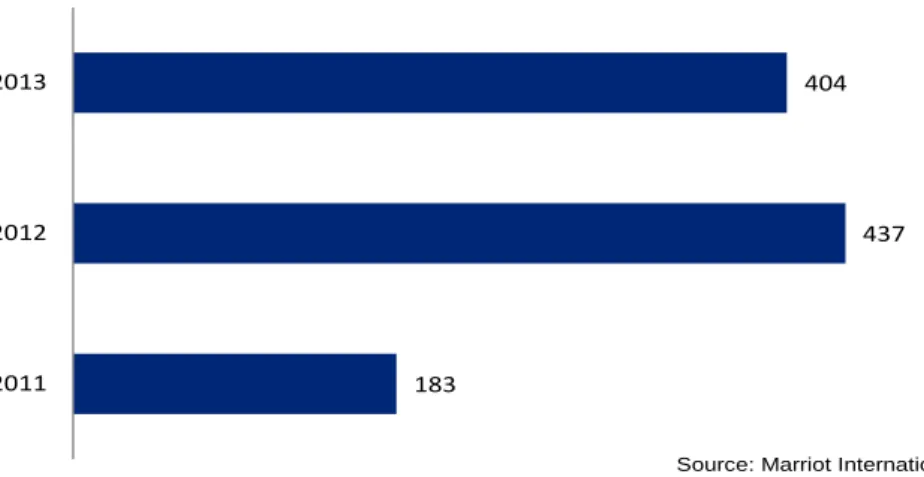
Capital Expenditures
Graphic 3 - Marriot International Capital Expenditures (2011-2013; million dollars)
In 2013, the company invested around $404 million dollars mainly in the development of new hotels and the rehabilitation of existing ones. The increased verified in 2012 was almost completely due to the construction and renovation of three new hotels for the Edition brand, at a cost of nearly $250 million dollars.
For the present year, Marriot International is expecting to invest between $600 to $1000 million dollars in maintenance, contract acquisition costs, loan advances and other investments related to the expansion of the company mainly through refurbishing of new hotels in order to increase the number of rooms and hotels under management.
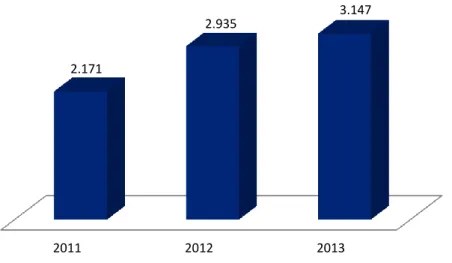
Debt
Following the present investment policy of the company, debt has been increasing in the last 3 years. At the year-end 2013, the total amount of debt was approximately $3,147 million dollars, representing an increase of around 7% comparing to the year-end of 2012. For the near future, Marriot International intends to slightly increase debt, while maintaining its debt to equity ratio almost
183 437 404 2011 2012 2013
23
the same and diversifying financing sources optimizing the mix and maturity of long-term debt.
Graphic 4 - Marriot International Debt Outstanding (2011-2013; million dollars)
Working Capital
At the end of 2013, Marriot International had negative working capital, as current liabilities were around $2,180 million dollars, while total current assets were approximately $1,900 million dollars. The fact that the company has negative working capital could indicate that it could experience problems expanding. However, negative working capital is not necessarily a bad thing and could indicate that the company is very efficient at running over inventory or that Marriot International has large financial subsidiaries and institutions.
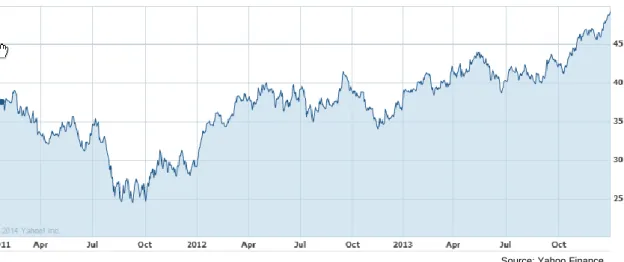
3.4 Stock performance, Dividend Policy and Shareholders Structure
Marriot International is quoted since 1953, when the company became public (at the initial price of $10.25 per share). Over the last 3 years, the market capitalization of the company has been increasing in average, although a downfall was verified in 2011 (due to the spin-off). This increase has been more
2011 2012 2013
2.171
2.935 3.147
24
accented particularly as of the last quarter of 2013, as can be seen in the graphic 5 below. This recent trend and valorization of Marriot International reflects the company’s strategy of managing and developing a large number of rooms around the world and the intention to invest hard in the next few years, in order to scale the business and enlarge the number of hotels under management.
Graphic 5 - Marriot International Stock Price (2011-2013; Dollars)
By the end of 2013, Marriot International was quoted at $49.35 per share. According to the last annual report, there was 294.823.291 shares outstanding held by around 36.000 shareholders at that same time, with John Willard Marriot being the main holder with around 14% of the company. The top 5 shareholders of Marriot International are together hold around 40% of the company, with the remaining 60% widely scattered.
With regards to dividends, the company has paid a cash dividend in each quarter paid in the last 3 years. Last year, the first dividend was $0.13 per share, with the others being $0.17 per share.
25 Power of Suppliers (Low) Potential Entrants (Low) Substitutes (Relatively High) Power of Buyers (High) Rival Competitors (Relatively High)
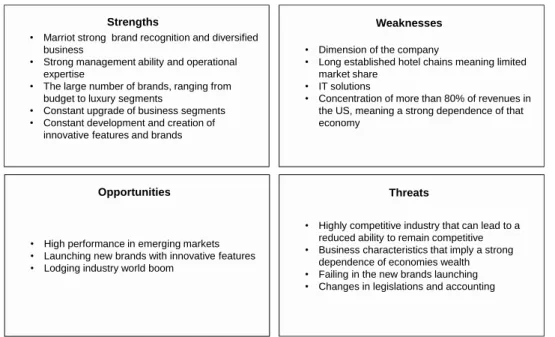
3.5 Swot Analysis and Porter´s 5 forces
We complied a brief overview of Marriot international’s main strengths, weaknesses, opportunities and threats,
Figure 1 - Marriot International SWOT Analysis
We analyzed Marriot International based on Porter’s 5 forces process, with the result shown in the graphic above.
Figure 2 - Marriot International Porter´s 5 Forces • Marriot strong brand recognition and diversified
business
• Strong management ability and operational expertise
• The large number of brands, ranging from budget to luxury segments
• Constant upgrade of business segments • Constant development and creation of
innovative features and brands Strengths
• Dimension of the company
• Long established hotel chains meaning limited market share
• IT solutions
• Concentration of more than 80% of revenues in the US, meaning a strong dependence of that economy
Weaknesses
• Highly competitive industry that can lead to a reduced ability to remain competitive • Business characteristics that imply a strong
dependence of economies wealth • Failing in the new brands launching • Changes in legislations and accounting
Threats
• High performance in emerging markets • Launching new brands with innovative features • Lodging industry world boom
26
4 Macroeconomic environment and lodging industry overview
In this section we analyze the macroeconomic environment and evolution of the main regions where Marriot international operates, while also providing a global lodging industry overview.
United States of America
Although the US economy is showing some signs of improvement, the unemployment rate is still elevated and debt levels need to fall further for the economy to start growing faster.
Despite this, the last 3 years of austerity have rectified public accounts and government spending will slowly start to support economic growth again, with projections for 2015 GDP growth rate being 3,2%; higher than 2014. Following on from this period, the US economy is expected continue to grow at an average of 2,5%.
Table I - United States Economic Figures (2011-2018; %)
According to the Pricewaterhouse Coopers (2014), the lodging business in the United States of America has been outperforming since the beginning of the present year with an increasing demand and an expecting RevPar growth of 6,5% this year. In the same report from Pricewatehouse Coopers, RevPar is expected to grow around 6,4% in the next year, mainly due to higher selling prices and an increasing demand.
2011 2012 2013 2014E 2015E 2016E 2017E 2018E Real GDP growth 1,8% 2,8% 1,9% 2,8% 3,0% 3,3% 2,9% 2,6%
Consumer Price Inflation 3,1% 2,1% 1,5% 1,4% 1,6% 1,8% 2,0% 2,0%
27
European Union
In Europe, recent years have been quite troubled due to the world financial crisis; leaving some countries in need of assistance from the International Monetary Fund. After the 2012 downfall in the EU28 GDP, 2013 was the year of recovery that all of Europe´s economies were waiting for. In coming years, it is expected that the GDP will grow above 1,5%
Table II - European Union Economic Figures (2011-2018; %)
Relative to lodging sector expectations for the coming years, revenues in the European Union are also set to increase, reaching the highest values in the last 5 years. According to Smith Travel Research (2014) up to August of the present year, revenues were growing 5,9% and it is expected that revenues in the lodging industry will continue to grow at this pace until at least 2017.
Latin America and Caribbean
The Latin America and Caribbean region has been growing and is mainly driven by a small group of countries such Brazil, Mexico and Chile. In the opposite direction, the consumer price inflation has been decreasing steadily. In 2013, the real GDP growth was 2,7% and it is expected to reach 3,5% in 2018.
Table III - Latin America and Caribbean Economic Figures (2011-2018; %)
2011 2012 2013 2014E 2015E 2016E 2017E 2018E Real GDP growth 1,7% -0,3% 0,2% 1,6% 1,8% 1,9% 1,9% 1,9%
Consumer Price Inflation 3,1% 2,6% 1,5% 1,1% 1,4% 1,6% 1,7% 1,8%
Source: International Monetary Fund
2011 2012 2013 2014E 2015E 2016E 2017E 2018E Real GDP growth 4,6% 3,1% 2,7% 2,5% 3,0% 3,3% 3,3% 3,5%
Consumer Price Inflation -1,4% -1,9% -2,7% -2,7% -2,8% -2,8% -2,8% -2,9%
28
According to Scotia Industry Trends (2014) and despite a slightly slowdown in last few years, the lodging industry in Latin America and Caribbean is gaining momentum and is expected to experience some recovery, with an increase in RevPar and occupancy rates of around 2% per year until 2017.
Middle East and North Africa
Driven by the oil exportations, this particular region presented some of the highest growth rates. In 2013, the real GDP growth rate was 3,2%, with a consumer price inflation rounding 8,4%. For the coming years, these economies are expecting sustainable growth, presenting a real GDP growth rate of 4.5% in 2018.
Table IV - Middle East and North Africa Economic Figures (2011-2018; %)
According to World and Travel Tourism Council Economic Impact (2014), the Middle East and North Africa lodging industry can expect growth of tourists expenditures of around 4% per year until 2017, with RevPar growths of almost 6,2%.
Emerging and Developing Asia
Emerging and developing Asia are the regions where real GDP growth rates have been higher, mainly due to the large industries and exportations; with an average growth rate above 6,5% per year. Consumer price inflation was 4.5% in 2013 and it is expected to reach 3,9% in 2018.
2011 2012 2013 2014E 2015E 2016E 2017E 2018E Real GDP growth 3,9% 4,1% 2,2% 3,2% 4,5% 4,7% 4,4% 4,5%
Consumer Price Inflation 9,3% 10,6% 10,5% 8,4% 8,3% 7,8% 7,8% 7,7%
29
Table V - Emerging and Developing Asia Economic Figures (2011-2018; %)
This region is the one in which the tourism and lodging industry is expecting the most. Again, according to the World Tourism and Travel Council report of Economic Impact (2014), Emerging and Developing Asia is the region with higher growth rates of expenditures by tourists in the world, with growth rates of around 5% per year until 2017, followed by RevPar growth rates of around 8%.
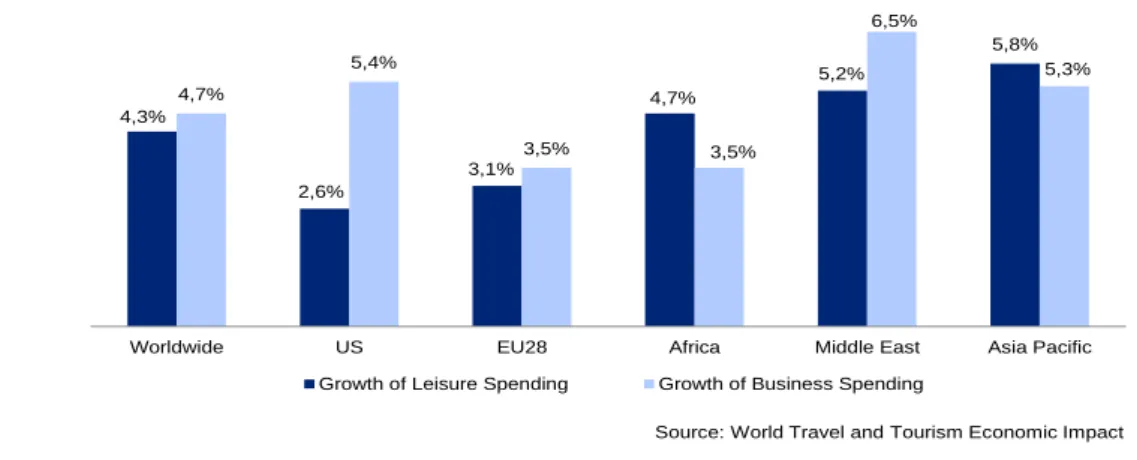
4.1 Global Lodging industry overview
After years of a slowly recovery and limited investments, the lodging sector has been witnessing (particularly in 2013) a strong growth that is expected to continue in the coming years. According to the World Travel and Tourism Council,5 the direct contribution of travel and tourism to world GDP is expected to grow 4,2%. The same study affirms that the amount spend in business and leisure travels by residents and non-residents worldwide is going to grow in 2014 by around 4,7% and 4,3% respectively.
Graphic 6 - Growth of Business and Leisure Spending (2014; %)
5
Source: WTTC – “World Travel and Tourism Economic Impact 2014”
2011 2012 2013 2014E 2015E 2016E 2017E 2018E Real GDP growth 7,9% 6,7% 6,5% 6,7% 6,8% 6,7% 6,6% 6,5%
Consumer Price Inflation 6,5% 4,6% 4,5% 4,5% 4,3% 4,1% 4,0% 3,9%
Source: International Monetary Fund
4,3% 2,6% 3,1% 4,7% 5,2% 5,8% 4,7% 5,4% 3,5% 3,5% 6,5% 5,3%
Worldwide US EU28 Africa Middle East Asia Pacific Growth of Leisure Spending Growth of Business Spending
30
As can be observed, in live with the macroeconomic environment, the amount spend in business and leisure tourism is generally growing worldwide. The regions where it is most growing are the Middle East and Asia Pacific.
Again according to the World travel and tourism economic impact 2014, a notably good global performance for lodging sector in the present year is expected, with growing figures led by a decrease of unemployment rates and stronger consumer spending. ARR and RevPar are also expected to increase during 2014, as well as in the coming next years along with a higher average length of stay6.
6
31
5 Valuation
5.1 Method
The valuation of Marriot International will be based on the group consolidated accounts. According to financial literature, consolidated accounts can be used to evaluate a company that operates in the same sector and with the same business model. Although Marriot is present in more than 70 countries alongside many different brands, the industry in which it operates and the business model that it uses remains the same.
The Free Cash Flow to the Firm and the WACC will be used in our valuation process as it is the most used model by general analysts in hotel companies valuation (DeRoos and Rushmore, 2006), while it is expected that Marriot International will maintain its capital structure. Cash flows will be projected for the next 5 years and then discounted at the WACC. The residual or terminal value, as known as perpetuity, and the explicit period of analysis, are calculated assuming a target debt to equity for both timeframes.
5.2 Valuation assumptions
To determine the value of Marriot International, some assumptions were made regarding the inputs for the model, in order to support the valuation itself.
5.2.1 Revenues
Regarding revenues projections, a growth rate was calculated based the market expectations for the years to come, that we mentioned before on economic and lodging industry overview. Taking those industry reports and WTTC projections, we can stand for an industry growth rate of around 5% worldwide. After, we
32
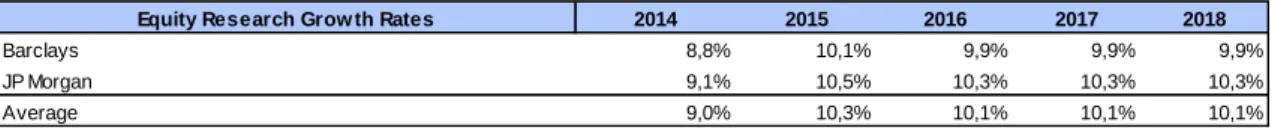
have taken into account Marriot Financials and company growing projections, as well as JP Morgan Equity Research (2014) and Barclays Marriot Equity Research (2014).
Table VI - Growth Rates Projections (2014-2018; %)
Based on the average growth rate and Marriot projections of adding more than 120.000 new rooms to its system over the next 5 years, we project revenues as follows on the table below.
Table VII - Revenues Projections (2014-2018)
Based on WTTC (2014), a rate of 4,5% was used for perpetuity. Despite being above inflation expectations, we know that Marriot international is constantly trying to innovate and reach new markets and that the lodging industry still has markets where it can grow, as well emerging countries to explore. This allows for confidence relative to long term projections.
5.2.2 EBITDA margin
An EBITDA margin based on historical performance and company projections for the next year was used. Marriot is trying to improve at the operational costs level and expects the margin to be greater than 2013 and closer to 2012 margin (9.9%). That said, the historical average margin from last two years plus company expectations of improvements in operational performance was used for EBITDA projections.
Equity Research Grow th Rates 2014 2015 2016 2017 2018
Barclays 8,8% 10,1% 9,9% 9,9% 9,9%
JP Morgan 9,1% 10,5% 10,3% 10,3% 10,3%
Average 9,0% 10,3% 10,1% 10,1% 10,1%
Valuation Projections in $millions 2014 2015 2016 2017 2018 Revenues 13.935 15.370 16.922 18.631 20.513
33
Table VIII - EBITDA Projections (2014-2018)
As can be observed, we believe that with such levels new hotels and rooms in the system Marriot will take some time to reach the EBITDA margin of 2012. Thus we start with 9,7% in 2014 and then added 0,2% for 2015 reaching 9,9% that year and in the years afterwards. For perpetuity we used a 2018 EBITDA margin.
5.2.3 Capital Expenditures, Amortizations and Depreciations
Regarding Capital Expenditures, this figure should be calculated using the difference between the value of tangible and intangible assets in the present year, less the projections for the coming years and taking into account depreciations and amortizations in the same years. The lack of detailed information about Marriot financials leads us to calculate capital expenditures regarding sales. Taking into account that the company expects to spend around $600 million dollars in 2014, absolute value for 2014 was used and a 3.4% average (last 2 years) of sales for the subsequent years.
Table IX - Capital Expenditures Projections (2014-2018)
As mentioned before, the investment projected by Marriot for 2014 is related to capital expenditures in developing contracts and refurbishing new hotels, as well to recovering some existing ones. For the present year, the company is trying to reach new emerging markets and will add over 20,000 rooms to its
Valuation Projections in $millions 2014 2015 2016 2017 2018 EBITDA 1.352 1.522 1.675 1.844 2.031
EBITDA/ Revenues 9,7% 9,9% 9,9% 9,9% 9,9%
Valuation Projections in $millions 2014 2015 2016 2017 2018 Capex 600 527 580 639 704
34
system. In 2015, we consider that investment will return normal levels, later growing with sales as the company needs to replace and refurbish some hotels. For depreciations and amortizations, the historical average over revenues of the last two years was used.
Table X - Depreciations and Amortizations Projections (2014-2018)
As can be seen, the value of Depreciations and Amortizations is relatively low for a lodging company. This can be explained through Marriot business model, where less than 2% of the hotels operated are owned or leased.
5.2.4 Net Working Capital
Due to the lack of further information regarding accounts payable and accounts receivable, we calculated changes in working capital taking into account the average of the last two years.
Table XI - Changes in NWC Projections (2014-2018)
As Marriot accounts receivable are paid in less than 30 days (due to the lodging business characteristics where customers pay at almost the same time that the service is provided), accounts payable are paid over 30 days, and revenues are projected to increase, changes in net working capital are negative. That means that the operating cycle of the company allows the generation self-financing operations, and it is expected the situation to continue with the expected growth.
Valuation Projections in $millions 2014 2015 2016 2017 2018 Depreciations and Amortizations 128 129 131 132 133
Depreciations and Amortizations/ Revenues 0,9% 0,9% 0,9% 0,9% 0,9%
Valuation Projections in $millions 2014 2015 2016 2017 2018 Changes in NWC (136) (150) (165) (182) (200)
35
5.2.5 Cost of Debt
The value used for the cost of debt was taken from the company annual report of 2013, where it states that the average interest rate of long term debt is 4.56%. That is the average value that the company has been able to finance through investors (company bonds) and banks (company loans).
5.2.6 Beta
Regarding levered beta, we used the Thomson database to research the beta of Marriot Hotels, standing at 1,16.
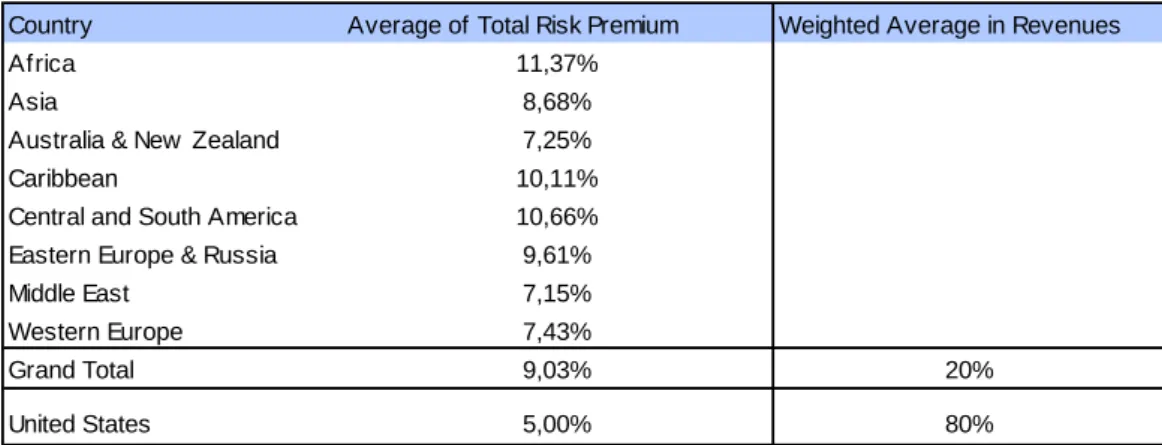
5.2.7 Market Risk Premium
Relative market risk premium, the weight of the United States revenues was taken into account, times its market risk premium given by Professor Damodaran’s database, plus the weight of the rest of the world’s revenues times the average risk premium for those countries.
Table XII - Market Risk Premium
Thus, the market risk premium used was 5.81%.
5.2.8 Tax Rate
The tax rate used in the valuation process was taken from Marriot International annual report of 2013, standing at 30.2%.
Country Average of Total Risk Premium Weighted Average in Revenues
Africa 11,37%
Asia 8,68%
Australia & New Zealand 7,25%
Caribbean 10,11%
Central and South America 10,66% Eastern Europe & Russia 9,61%
Middle East 7,15%
Western Europe 7,43%
Grand Total 9,03% 20%
United States 5,00% 80%
36
5.2.9 Debt to Equity ratio
For the debt to equity ratio, a value of 21,63% was used. To calculate this value we used Marriot total long term debt over total equity, being these values 3.147 million dollars and 14.550 million dollars respectively.
5.2.10 WACC
After using the parameters above, the weighted average cost of capital used to discount Marriot free cash flow was 8,32%.
Table XIII - WACC
5.2.11 Perpetuity growth rate
As mentioned early and regarding the perpetuity growth rate, the long term growth rate of the lodging industry projected for the period between 2015 and 2024 by World Tourism and Travel Council (2014) was assumed. This rate was 4.5% and, despite being higher than expected inflation and GDP growth rate, we think that it is still quite conservative taking into account the size of the market and the expectations for the coming future.
Rf - Risk Free Rate 2,55%
Rm - Market Risk Prem ium 5,81%
Beta 1,16
Ke - Cost of Equity 9,29%
Kd - Cost of Debt 4,56%
Tc - Effective Tax Rate 30,20%
Marriot D/E 21,63%
37
5.2.12 FCF, Equity Value and Enterprise Value of Marriot International Table XIV - FCFF
After discounting and summing the company’s free cash flows to the firm, we obtained the total enterprise value of 18.527 million dollars, being 2.702 million referent to the explicit value and the remaining 15.826 million referent to terminal value.
6 Valuation Results
Having the enterprise value of the firm, we do need to deduct the value of debt responsibilities and add non-current assets in order to get the equity value of Marriot International. Thus, we deducted all non-current liabilities, such as loans and financial instruments, and added equity investments and assets held for sale (Marriot financials, 2013).
Table XV - Valuation Results
The intrinsic value of each Marriot International stock is $53.87. With this value per share, we have a valorization potential of 9,2% regarding the company quote on 31/12/2013. It is important to note that the obtained value is valid only for the purposes of this work, with the assumptions and methodology applied,
Valuation Projections in $millions 2014 2015 2016 2017 2018
Revenues 13.935 15.370 16.922 18.631 20.513
EBITDA 1.352 1.522 1.675 1.844 2.031
(-) Depreciations and Amortizations 128 129 131 132 133
EBIT 1.223 1.392 1.545 1.713 1.898 (-) Taxation 428 487 541 599 664 (-) Capex 600 527 580 639 704 (-) Changes in NWC (136) (150) (165) (182) (200) FCFF 459 657 719 788 863 Discounted FCFF 424 560 566 572 579 Enterprise Value 18.527
(+) Equity and cost method investments 126
(+) Assests held for sale 250
Adjusted Entreprise Value 18.903
(-) Net Debt 3.021
Equity Value 15.882
Shares Outstanding 294.823.000
38
and it is not perfectly accurate. For example, if some of main assumptions, like revenues growth rate, don’t be verified in the future, the results will be different. Taking that into account, the next section is comprised of a sensitivity analysis that will lead us to a more perceptive level of Marriot´s price, with an interval through which the price can vary. The ideal would be to do a Monte Carlos´s probabilistic simulation, but we do not have the software needed and besides, is hard to get the precise information about distribution functions of the principal variables for Marriot in the different countries where it operates.
9 Sensitivity Analysis and Relative valuation
Usually the variables that have most influence on valuation results are EBTIDA margin and perpetuity growth rate. Therefore we analyzed the impact of both variables on Marriot’s price per share, with results presented in the table below.
Table XVI - Sensitivity Analysis
The results presented reinforce the idea that Marriot International stocks are quite sensitive to these variables. Especially at low WACC, as we can observe that perpetuity growth rate can have large influence in company valuation. In order to complement the valuation process, we analyzed EV/EBITDA and PER for some comparable companies and estimated a target price by the relative valuation method. The price target using relative valuation stands between $52,31 and $59,94, thus being in line with our DCF valuation (appendix 1). WACC g 53,87 $ 10,3% 9,3% 8,3% 7,3% 6,3% 5,5% 38,89 51,69 73,58 119,52 277,21 5,0% 35,04 45,49 62,24 93,45 171,86 4,5% 31,85 40,57 53,87 76,61 124,32 4,0% 29,16 36,58 47,43 64,84 97,25 3,5% 26,87 33,27 42,33 56,15 79,78
39
10 Conclusion
Marriot International presents a potential growth margin for the coming future. Over the last 3 years, the company has shown strong resilience when faced with the recent world financial and economic crisis, presenting strong financials and constantly searching for new markets to explore and where it can expand its business. Taking into account industry projections and if Marriot continues to perform as is has over the last couple of years, there will be innumerous possibilities to grow, particularly in emerging markets such as Asia and the Middle East.
However, the company needs to manage this expansion carefully, as such massive levels of growth can bring some serious challenges. Essentially, Marriot needs to work hard in order to consolidate EBITDA margins and to maintain its notable asset of tightly controlled operating costs. Furthermore, the company needs to work on reducing its debt, in order to captivate its investors and to improve on its returns on investments.
In summary and taking into account our valuation through the relative valuation and DCF model, we can conclude that Marriot’s share price of $49,35 at 31/12/2013 is undervalued. Thus it is our belief and we would recommend future investors to buy Marriot International stocks. Financial markets will probably recognize the company value and, consequently, its price per share are going to increase, offering returns of around 9,2%.
40
Bibliography Academic research:
DeRoos, J, Rushmore, S. (2006), Hotel Valuation Techniques, 2-6;
Copeland, T., Koller, T. & Murrin, J. 2000. Measuring and Managing the
Value of Companies, 3-89;
Berk, J., Demarzo, P. (2011), Corporate finance, 102-175;
Damodaran, A. 2002. Investment Valuation;
Damodaran, A. 2008. What is the riskfree rate? A Search for the Basic Building Block. Retrieved September, 15, 2012;
Dempsey, M. 2013. The Capital Asset Pricing Model (CAPM): The
History of a Failed Revolutionary Idea in Finance? Abacus, 49, 7-23;
DeRoos, J, Rushmore, S. 2006, Hotel Valuation Techniques;
Fama, E., French, K. 1993. Common Risk Factors in the Returns on
Stocks and Bonds. Journal of Financial Economics 33;
Fernandez, P. 2001. Valuation using multiples: how do analysts reach their conclusions? Available at SSRN 274972;
Fernandez, P. 2007. Company valuation methods. The most common
errors in valuations. In: IESE BUSINESS SCHOOL, U. O. N. (ed.);
Gordon, M., 1962. The Investment, Financing, and Valuation of the
Corporation. Irwin Series of Economics;
Holthausen, R. W. & Zmijewski, M. E. 2012. Valuation with Market Multiples: How to Avoid Pitfalls When Identifying and Using Comparable Companies1. Journal of Applied Corporate Finance, 24, 26-38;
Koller, T., Goedhart, M. & Wessels, D. 2010. Valuation: Measuring and Managing the Value of Companies. In: FINANCE, W. (ed.) 5th ed;
Luehrman, T. A. 1996. Using APV (adjusted present value): a better tool
41
Modigliani, F., Miller, M. 1961. Dividend Policy, Growth, and the
Valuation of Shares. The Journal of Business;
Neves, J. C. D. 2002. Avaliação de Empresas e Negócios;
Pandian, J. R. & Woodlock, P. 2013. Reassessing M&A Valuation Assumptions. Journal of Corporate Accounting & Finance, 24, 35-40;
Ross, S., Westerfiled, R. & Jaffe, J. 1996. Corporate Finance;
Ross, S., 1976. The Arbitrage Theory of Capital Asset Pricing, Journal of
Economic Theory, Vol. 13, 341-360;
Ruback, R. S. 2011. Downsides and DCF: Valuing Biased Cash Flow
Forecasts. Journal of Applied Corporate Finance, 23, 8-17;
Sharpe, W., 1964, Capital Asset Prices: A Theory of Market Equilibrium
Under Conditions of Risk, The Journal Of Finance, Vol. 19, Number 3, 425-442;
Williams, J., 1938, The Theory of Investment Value, Harvard Business Press, Cambridge.
Financials and Industry Reports:
Barclays Marriot International Equity Research, 2014;
Carlson Wagonlit Travel, Travel Price Forecast, 2014;
Ernest&Young, Global Hospitality Insights, 2014;
HVS, European Hotel Valuation Index, 2013;
JPMorgan, Marriot International Equity Research, 2014;
Marriot International financials (2011, 2012, 2013);
Scotia Bank, Global Economics, Industry Trends, July 2014
Smith Travel Research, Hotel Industry Performance Europe, July 2014;
Updated Lodging Outlook, PWC, May 2014;
42
World Market Intelligence Marriot International Snapshot, 2014;
Wolrd Travel & Tourism Council, Economic Impact of Travel & Tourism 2014 Afica;
Wolrd Travel & Tourism Council, Economic Impact of Travel & Tourism 2014 Asia Pacific;
Wolrd Travel & Tourism Council, Economic Impact of Travel & Tourism 2014 European Union;
Wolrd Travel & Tourism Council, Economic Impact of Travel & Tourism 2014 Middle East;
Wolrd Travel & Tourism Council, Economic Impact of Travel & Tourism 2014 United States
Wolrd Travel & Tourism Council, Economic Impact of Travel & Tourism 2014 World;
Wolrd Travel & Tourism Council, Economic Impact of Travel & Tourism 2014 Annual Update;
Internet Main Sources:
Bloomberg – http://www.bloomberg.com;
Damodaran, Aswath – http://pages.stern.nyu.edu/~adamodar;
Economist Intelligence Unit – http://www.eiu.com;
Hotel News – http://www.hotelnewsresource.com;
International Monetary Fund – http://www.imf.org;
Marriot International – http://www.marriot.com;
STR Global – http://www.strglobal.com;
Thomson – http://www.thomsonone.com;
Wolrd Tourism & Travel Council – http://www.wttc.org;