Relatório Final de Estágio
Mestrado Integrado em Medicina Veterinária
Antimicrobial resistance in Portuguese broiler-breeder flocks between
2009 and 2018
João Marco Freitas Oliveira
Orientador
Fernando Alberto Brandão Campos Lopes Moreira
Co-orientador Alexandra Müller
Relatório Final de Estágio
Mestrado Integrado em Medicina Veterinária
Antimicrobial resistance in Portuguese broiler-breeder flocks between
2009 and 2018
João Marco Freitas Oliveira
Orientador
Fernando Alberto Brandão Campos Lopes Moreira
Co-orientador Alexandra Müller
iii
Abstract
Antimicrobial resistance (AMR) is a worldwide problem with serious health and economic repercussions. Due to antimicrobial resistance, antimicrobial drugs are progressively losing effectiveness, which led to the development of new antimicrobials. Additionally, multidrug-resistance, defined as non-susceptibility to at least one antimicrobial in three or more antimicrobial classes is also an emerging problem. In poultry, colibacillosis is one of the most economically impactful diseases and it is caused by avian pathogenic E. coli (APEC) strains. In this study, we evaluate APEC antimicrobial resistance and its evolution over a period of ten years with the collection of 264 positive samples. All the samples were collected from broiler-breeder flocks that exhibited signs of disease. We found a very high resistance prevalence for amoxicillin and ampicillin, both above 70% which was not to be expected. Tetracycline also had a high resistance value of 63.3%. Multidrug-resistance (MDR) was present in 84% of tested strains. Despite these values, the general trend of all tested antimicrobials indicates that resistance levels have been decreasing, or at least, being stable over these ten years.
iv
Acknowledgements
Firstly, I would like to thank Professor Fernando Moreira for allowing me to use this data that was so carefully collected over these years, for the support during the internship and the writing of this report, and for giving me the possibility to explore an area of veterinary medicine that I was always curious about.
To Professor Alexandra Müller, for always being available to discuss any problems I ran into while writing this report and for keeping me focused and motivated to achieve my goals.
To Professor Margarida Fonseca Cardoso, for the help in the statistical analysis.
To Dr. Alice Silva, for guiding me during the internship and for the joyful moments we shared. To Grupo Lusiaves, for giving me the opportunity to improve my academic qualification and for providing me with a habitation for the duration of this internship.
To everyone in the several farms I visited, for welcoming me with open arms, with a special thanks to the technicians in Quinta da Cruz.
To my parents, my brother, and my sister, for the support and for the wisdom passed on to me. To Inês, for the care, patience, and understanding throughout these years and for always being present in the toughest situations.
v
Abbreviations
AMR - Antimicrobial resistance APEC - Avian Pathogenic E. coli CI - Confidence interval
CLSI - Clinical and Laboratory Standards Institute
E. coli - Escherichia coli
EU - European Union
EUCAST - European Committee on Antibiotic Susceptibility Testing ExPEC - Extraintestinal pathogenic E. coli
MIC - Minimum inhibitory concentration MDR - Multidrug-resistance
p - test value
vi
Index
Abstract ... iii Acknowledgements ... iv Abbreviations ... v Index ... vi 1. Introduction ... 11.1 Avian pathogenic E. coli and colibacillosis... 1
1.2 Antimicrobial resistance, multidrug-resistance, and resistance mechanisms ... 2
1.3 Susceptibility testing methods ... 4
1.4 Broiler breeders ... 5
1.5 Study objective ... 5
2. Materials and Methods ... 6
2.1 Sample size and collection ... 6
2.2 Sample processing ... 6
2.3 Determination of resistance and multidrug-resistance ... 7
2.4 Statistical analysis ... 7
3. Results ... 8
3.1 Overall resistance prevalence ... 8
3.2 Multidrug-resistance (MDR) ... 8 3.3 Trend analysis ... 9 4. Discussion ... 18 4.1 Resistance prevalences ... 18 4.2 Multidrug-resistance (MDR) ... 21 4.3 Trend analysis ... 22 5. Conclusion ... 24 6. References ... 25 7. Annex ... 29
1
1. Introduction
The world has over 23 billion poultry, about five times more than 50 years ago (FAOSTAT 2016). The animals are raised in various production systems and provide mainly meat, eggs, and manure for crop fertilization. Eggs and poultry meat are among the most common foods from animal sources to be consumed in the world, partly due to the inexistence of religious and cultural restrictions and due to the low production costs of this industry (Mottet & Tempio 2017). Highly cost-efficient and vertically integrated intensive livestock production systems, especially in emerging economies usually depend on antimicrobials to keep animals healthy and maintain productivity and are leading to an increase in antimicrobial use and consequently antimicrobial resistance (Van Boeckel et al. 2015). However, in the European Union (EU), antibiotics cannot be used as feed additives per Regulation 1831/2003 of the European Parliament and of the Council (EC (1831/2003) 2003).
1.1 Avian pathogenic E. coli and colibacillosis
E. coli is a normal inhabitant of the intestinal tract of warm-blooded animals. On birds, it is
present in the lower gastrointestinal tract, while also being found in the trachea and pharynx (Guabiraba & Schouler 2015). Many Escherichia coli strains are harmless, but there are pathogenic strains, which may become a bigger threat if they present or acquire certain antimicrobial mechanisms (Reygaert 2014). Virulent strains that are able to cause disease in birds are named avian pathogenic E. coli (APEC). The intestine constitutes their reservoir, potentiating the contamination of the house environment (Guabiraba & Schouler 2015). APEC is a subpathotype of extraintestinal pathogenic E. coli (ExPEC) that infects poultry. Recent studies have demonstrated that some APEC clones are very similar to ExPEC strains that affect humans, being indistinguishable from human ExPEC due to the possession of certain virulence factors. These strains are able to cause disease in mammalian models of human disease (Cunha et al. 2014). Additionally, some studies reported results that suggest that potential ExPEC transmission from food animal sources is probably responsible for human infections and chicken is a major reservoir (Bergeron et al. 2012).
APEC can act as a primary or secondary agent and provokes a considerable number of systemic and localized infections. These infections are regularly named avian colibacillosis, and it is among the major causes of mortality, morbidity, and economic loss in the world’s poultry industry. APEC is capable of infecting birds of all ages in the various types of production systems (Guabiraba & Schouler 2015). As a primary pathogen, APEC usually causes localized
2
infections in the reproductive tract, while as a secondary pathogen it can be responsible for bone and joint infections. Nonetheless, the systemic form of colibacillosis is the most worrisome as it has a respiratory origin and causes colisepticemia. Poor environmental conditions and/or concurrent infection by other agents, especially respiratory viruses, leads to immunocompromised birds, making them much more susceptible to APEC infection. It is assumed that this bacterium crosses the respiratory epithelia and penetrates into the mucosa and submucosa in order to reach the bloodstream thus causing septicemia. Birds that survive develop pericarditis, subacute fibrinopurulent airsacculitis, and perihepatitis (Guabiraba & Schouler 2015).
Good husbandry, strict biosecurity measures, and vaccination play important roles on the prophylaxis of this infection. However, the effectiveness of existing vaccines is low as avian pathogenic E. coli strains present high diversity (Guabiraba & Schouler 2015). The control and treatment of these infections are accomplished through the use of antimicrobials, which leads to the emergence of resistant and multidrug-resistant strains (Dou et al. 2016).
1.2 Antimicrobial resistance, multidrug-resistance, and resistance mechanisms
Antimicrobial resistance (AMR) is a worldwide problem with serious health and economic repercussions. Since the 1940s, overuse, and misuse of antimicrobial compounds has had a significant environmental and public health impact (Marinho et al. 2016). AMR is ancient, and results of the interaction of organisms with the environment (Munita et al. 2016). AMR is the unwelcome aftereffect of antimicrobial use in humans and animals as antimicrobials continuously select resistant bacterial strains, both pathogenic and commensal (European Food Safety Authority 2018).
Most antimicrobials are naturally-produced molecules, and, as such, co-resident bacteria have evolved mechanisms to resist their action and survive. These bacteria are deemed as “intrinsically” resistant. However, for the AMR problem we are discussing, bacteria with intrinsic determinants of resistance are not the focal point. AMR usually refers to “acquired resistance” of bacteria that were originally susceptible to an antimicrobial (Munita et al. 2016). This acquired resistance stems from the continued use of antimicrobials, both in humans and animals, and the selection pressure it applies. Contributing to this problem is the fact that the antimicrobials used in food‐producing animals are regularly the same, or belong to the same classes, as those used in human medicine (European Food Safety Authority 2018). This selective pressure and the amount of antimicrobials used are generally directly proportional. Furthermore,
3
the antimicrobial class and the misuse of antimicrobials are also important factors (Angulo et al. 2005). Additionally, the discharge of antimicrobial residues in the environment also contributes to the widespread dissemination of resistant bacteria. (Caniça et al. 2015).
Due to AMR, antimicrobial drugs are progressively losing effectiveness, which led to the development of new antimicrobials. The structural and antimicrobial mechanism similarities between new antimicrobials and the ones already in use have raised the concern that bacteria may rapidly develop resistance to them (European Food Safety Authority 2018).
The continuous increase of AMR led international authorities to take measures to guarantee treatment and prevention of infectious diseases with quality-assured, safe and effective medicines, today and in the future (World Health Organization 2015). In the May 2015 World Health Assembly, a global action plan on AMR was adopted. This plan was developed by the World Health Organization in collaboration with the Food and Agriculture Organization of the United Nations and the World Organization for Animal Health. This plan delineates five goals: to increase the level of awareness of AMR with the employ of adequate communication, education and training; to bolster the knowledge and evidence base through the promotion of surveillance and scientific research; to decrease infection through efficient hygiene and prophylaxis measures; to optimize the use of antimicrobials in humans and animals; and to promote investment in new antimicrobials, diagnostic procedures, vaccines and other interventions (World Health Organization 2015).
In September 2016, the United Nations General Assembly issued a Political Declaration on AMR. This declaration reaffirms that the model for combating AMR is the World Health Organization global action plan on AMR and its five fundamental purposes (United Nations. 2016). It also declares the commitment to work at national and global levels to create and implement action plans to consolidate adequate antimicrobial use in humans and animals. National and international collaboration is fundamental as the implementation of these plans requires heavy investment in research, education, and infrastructure(United Nations. 2016). The creation of a global action plan on AMR was a key step in the path to decrease AMR worldwide, but it now needs the cooperation of every sector, especially animal husbandry and, in this particular case, intensive poultry farming. According to the World Organization for Animal Health, progress has been made in later years as more and more member countries have official systems in place for collecting quantitative data on antimicrobial agents used in animals.
4
Additionally, the number of member countries with a regular national AMR surveillance system or plan has increased substantially (OIE 2018).
A bacterium is defined as resistant to an antimicrobial class when it is non-susceptible to at least one antimicrobial in that class. Non-susceptibility refers to either a resistant, intermediate or non-susceptible result obtained from in vitro antimicrobial susceptibility testing. The resistance of a bacterium to an antimicrobial is suggested as a crude indicator of resistance to the entire class. Therefore, multidrug-resistance (MDR) is described as non-susceptibility to at least one antimicrobial in three or more antimicrobial classes (Magiorakos et al. 2012).
Bacteria, in general, have four AMR mechanisms. They are decreasing uptake of the drug, modification of its molecular target, inactivation, and active efflux of the drug. These mechanisms occur naturally in all members of a species (intrinsic) or are obtained from other bacteria via plasmids (acquired). Presence of antimicrobials induces the expression of these genes. Gram-negative bacteria regularly use all four mechanisms and are also able to horizontally transfer resistance elements (Reygaert 2014).
1.3 Susceptibility testing methods
In terms of antimicrobial susceptibility testing methods, disk diffusion, broth dilution, and agar dilution are known to provide reproducible and repeatable results as long as the proper guidelines are followed (World Organisation for Animal Health 2015).
Bauer and Kirby first described the disk diffusion method in the 1950s (Hombach et al. 2013). It is one of the oldest methods of antimicrobial susceptibility testing and is still among the most commonly used antimicrobial susceptibility testing methods. It is appropriate for testing the bulk of bacterial pathogens and is also adaptable in terms of antimicrobials that can be tested (EUCAST 2019). Regarding disk diffusion test results, the susceptible category is defined as probable therapeutic success for the unique species/antimicrobial combination tested. For the European Committee on Antibiotic Susceptibility Testing (EUCAST), the resistant category suggests a high probability of therapeutic failure while for the Clinical and Laboratory Standards Institute (CLSI) it implies no reliable clinical efficacy (Hombach et al. 2013). EUCAST defines the intermediate category as unknown therapeutic success for the unique species/antimicrobial combination tested and it applies for antimicrobials that can be administered in higher dosages. CLSI defines the intermediate category as a lower response rate than for susceptible bacteria, but
5
clinical efficacy in case of accumulation of the antimicrobial at the site of infection (Hombach et
al. 2013). The disk diffusion method was our choice for this study.
Broth dilution and agar dilution test varying concentrations of an antimicrobial against a defined bacterium concentration. Broth dilution uses a liquid medium in which a bacterium suspension is made, while agar dilution involves the application of bacterial inoculum to the agar surface of the plate (World Organisation for Animal Health 2015). Both these tests try to determine the lowest concentration of a tested antimicrobial that inhibits the growth of the tested bacterium. This value is classified as minimum inhibitory concentration (MIC) (World Organisation for Animal Health 2015). MICs are considered the “gold standard” for susceptibility testing and as such are used to evaluate the performance of all other test methods (Andrews 2002).
1.4 Broiler breeders
The broiler breeders are separated between rearing farms and production farms. Each flock has roughly 30000 broiler breeders. They are transferred to production sites when the flock is 20 weeks old. A flock is not culled unless it is 60 weeks old or older. After culling, a period of cleaning and disinfection is mandatory, in order to receive new flocks in sanitary conditions. Strict biosecurity measures are in place on all farms.
Antibiotics cannot be used as feed additives and as such, antimicrobials are only used to treat diseased flocks. In terms of treatment, enrofloxacin and/or amoxicillin were most commonly used and always based on an antimicrobial susceptibility test. In rare cases, other antimicrobials could be used, following the test results.
Due to their big life-span, when compared to broilers, and only a few treatments during this time, the amount of data collected in each year is exceedingly small. The collection of data over the course of ten years allows us to determine if a trend is present, whether it is an increasing or decreasing trend.
1.5 Study objective
The constantly growing threat of AMR accentuates the need to review the data collected, discuss the findings, and evaluate underlying trends in a constant manner (European Food Safety Authority 2018). The aim of this study was to measure the resistance prevalence of different antimicrobials over ten years, while also evaluating the possible evolution of AMR within broiler breeders of the Portuguese poultry industry. Data from susceptibility tests performed when a
6
certain flock appeared to have a bacterial infection and needing treatment was available and used in this study.
2. Materials and Methods
2.1 Sample size and collection
Broiler-breeder flocks, both in rearing and production sites, that exhibited signs of septicemia were sampled. The confirmation of septicemia was made after performing a necropsy on all the dead birds at the moment of diagnosis. After confirmation of septicemia, three birds that represented the lesional pattern of the whole flock were sampled. Liver, spleen, and heart samples were collected aseptically and refrigerated until they were shipped to a certified laboratory (Controlvet©, Tondela, Portugal). All the sampled birds were dead for less than eight hours.
Over a period of ten years, from 2009 to October 2018, 264 flocks tested positive for E. coli.
2.2 Sample processing
The samples were processed in less than 24 hours after arriving at the laboratory and bacterial cultures were made using a selective and differential culture medium, McConkey Agar, and an enriched differential medium, Blood Agar. After the 24 hour incubation period, phenotypical identification is possible. E. coli, being lactose-fermenting, turns McConkey agar pink and itself has pink colonies (“MacConkey Agar (MAC): Composition, preparation, uses and colony characteristics”).
After phenotypic identification and bacterial isolation, antibiotic sensitivity tests with sixteen antimicrobials were conducted to assess the AMR pattern of each E. coli strain. These antimicrobials are amoxicillin, ampicillin, tetracycline, doxycycline, apramycin, neomycin, enrofloxacin, flumequine, co-trimoxazole (trimethoprim + sulfamethoxazole), florfenicol, lincospectin (lincomycin + spectinomycin), lincomycin, tilmicosin, tylosin, tiamulin, and colistin. The Kirby-Bauer disk diffusion susceptibility test was chosen for this purpose. It is a test suitable for aerobic and facultative anaerobic bacteria like E. coli (Hudzicki 2016). The antimicrobial disks were purchased from bioMérieux©. The EUCAST guidelines on antimicrobial susceptibility testing were followed (EUCAST). On a quick note, it is important to mention that colistin is in a complex situation as the current guidelines dictate that the suitable test to determine resistance is broth microdilution (EUCAST). Colistin does not diffuse properly in agar as it is a cyclic decapeptide bound to a fatty acid chain. These characteristics complicate
7
the differentiation of colistin-susceptible from colistin-resistant strains, as the inhibition zones are generally small. Furthermore, colistin binds to plastic panels, thus resulting in uncertainties on the active concentration in the medium (Kempf et al. 2016). Because of this, we decided not to use the data relating to colistin resistance when making a comparison with other reports, and when referring to trendlines.
2.3 Determination of resistance and multidrug-resistance
Regarding disk diffusion test results, the intermediate classification is considered the ‘grey zone’ in terms of therapeutic success (Hombach et al. 2013) and as such, we considered that for the purpose of the application of treatment in a diseased flock, intermediate resistance can be grouped with resistance, on the basis that there is no possibility to increase the dosage above standard values, which restricts us from using that antimicrobial.
An E. coli strain was considered multidrug-resistant when it was resistant to at least one antimicrobial in three or more antimicrobial classes. Six antimicrobial classes were considered for this calculation: β-Lactams, tetracyclines, aminoglycosides, fluoroquinolones, sulfonamides+diaminopyrimidines, and amphenicols.
2.4 Statistical analysis
The prevalence of resistance was calculated for each antimicrobial over the ten-year study period and organized by year. The number of APEC samples for each year are as follows: 2009, n=20; 2010, n=19; 2011, n=20; 2012, n=16; 2013, n=33; 2014, n=34; 2015, n=51; 2016, n=25; 2017, n=23; 2018, n=23. 95% Confidence intervals (CI) were calculated for all the reported values using the Wilson method. Graphs were built for each antimicrobial, to represent the resistance prevalence, in percentage, for each year. A linear trendline was also drawn to help interpret the graphs and to show what the general trend is, regarding the increase or decrease of the resistance prevalence over the years. Microsoft Excel was used to draw this trendline.
A time-trend analysis was made for every antimicrobial using Spearman’s test for non-parametric correlation. The test value (p) and the correlation coefficient (r) are shown for every graph, regardless of test significance. The statistical significance was two-sided and considered significant at p<0.05. All the tests were performed using IBM SPSS Statistics 25.
8
3. Results
3.1 Overall resistance prevalence
The overall percentage of strains resistant to each antimicrobial over the ten-year study period are reported in Table 1, along with the corresponding 95% CI.
Table 1. Overall resistance prevalence and correspondent 95% confidence intervals of APEC from broiler breeders in Portugal to different antimicrobials in the study period 2009 to 2018. All APEC isolates (n=264) were tested for susceptibility against every antimicrobial.
Antimicrobial Resistance prevalence 95%CI lower limit 95%CI upper limit
Amoxicillin 78,0% 72,7% 82,6% Ampicillin 73,5% 67,9% 78,4% Tetracycline 63,3% 57,3% 68,8% Doxycycline 56,4% 50,4% 62,3% Apramycin 34,5% 29,0% 40,4% Neomycin 68,2% 62,3% 73,5% Enrofloxacin 32,6% 27,2% 38,4% Flumequine 39,4% 33,7% 45,4% Co-trimoxazole 47,7% 41,8% 53,7% Florfenicol 46,6% 40,7% 52,6% Lincospectin 66,3% 60,4% 71,7% Lincomycin 89,8% 85,5% 92,9% Tilmicosin 86,0% 81,3% 89,7% Tylosin 96,6% 93,6% 98,2% Tiamulin 84,1% 79,2% 88,0% Colistin 30,7% 25,4% 36,5%
Prevalence values of 78% (95% CI 72,7-82,6) and 73,5% (95%CI 67,9-78,4) were obtained for the tested broad-spectrum β-Lactams amoxicillin, and ampicillin, respectively. Tetracycline had a resistance prevalence of 63.3% (95% CI 57.3-68.8), while doxycycline had a resistance prevalence of 56.4% (95% CI 50.4-62.3). On the other hand, the aminoglycosides apramycin, and neomycin presented resistance prevalences of 34.5% (95% CI 29- 40.4) and 68.2% (95% CI 62.3-73.5), respectively.
3.2 Multidrug-resistance (MDR)
We found that 222 of the 264 strains were multi-drug resistant (84.1%). Of these 222, 69 were resistant to 4 classes, 66 were resistant to 5 classes and 35 were resistant to all classes of the tested antimicrobials. In percentage, of all 264 tested strains, 19.7% were resistant to 3 classes 26.1% were resistant to 4 classes, 25% were resistant to 5 classes and 13.3% were resistant to all
9
classes of the tested antimicrobials. Only 7 strains were susceptible to all tested classes, which translates to 2.7% of all strains.
3.3 Trend analysis
To evaluate if a trend was present, graphs that display resistance prevalence data by antimicrobials and by year, are shown in Figures 1 to 16. The yearly figures are shown in the Table in the Annex. The error bars show the respective 95% CIs. The trendline was drawn on all graphs to aid the interpretation of the graph and show the general trend (decreasing, increasing, or stable). The Spearman test value (p) and the corresponding correlation coefficient value (r) are shown for every graph, but these values do not refer to the drawn trendline, as they were calculated using a non-parametric test. The statistical significance was two-sided and considered significant at p<0.05.
10
3.3.1 β-Lactams
The evolution of APEC resistance to the β-Lactams amoxicillin and ampicillin is shown in Figures 1 and 2.
Fig. 1. Yearly resistance prevalence of APEC to amoxicillin. The dotted line represents a linear trendline. Error bars represent the 95%CI for each year. Spearman test value: p=0.174, r=-0.467
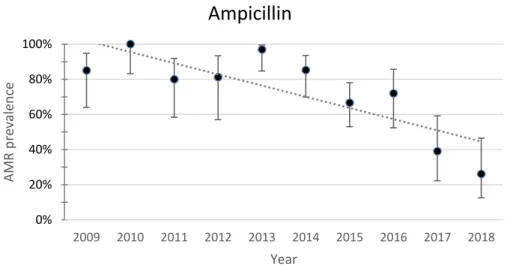
Fig. 2. Yearly resistance prevalence of APEC to ampicillin. The dotted line represents a linear trendline. Error bars represent the 95%CI for each year. Spearman test value: p=0.011, r=-0.758
The resistance to amoxicillin and ampicillin over the ten-year period showed a decreasing trend. Resistance to amoxicillin decreased from 100% (95%CI 83.9-100) in 2009 to 56.5% (95%CI 36.8-74.4) in 2018. Resistance to ampicillin decreased from 85% (95%CI 64-94.8) in 2009 to 26.1% (95%CI 12.5-46.5) in 2018. The Spearman test value was significant for ampicillin (p=0.011). 0% 20% 40% 60% 80% 100% 2009 2010 2011 2012 2013 2014 2015 2016 2017 2018 AMR p re valence Year
Amoxicillin
0% 20% 40% 60% 80% 100% 2009 2010 2011 2012 2013 2014 2015 2016 2017 2018 AMR p re valence YearAmpicillin
11
3.3.2 Tetracyclines
The evolution of APEC resistance to tetracycline and doxycycline are shown in Figures 3 and 4.
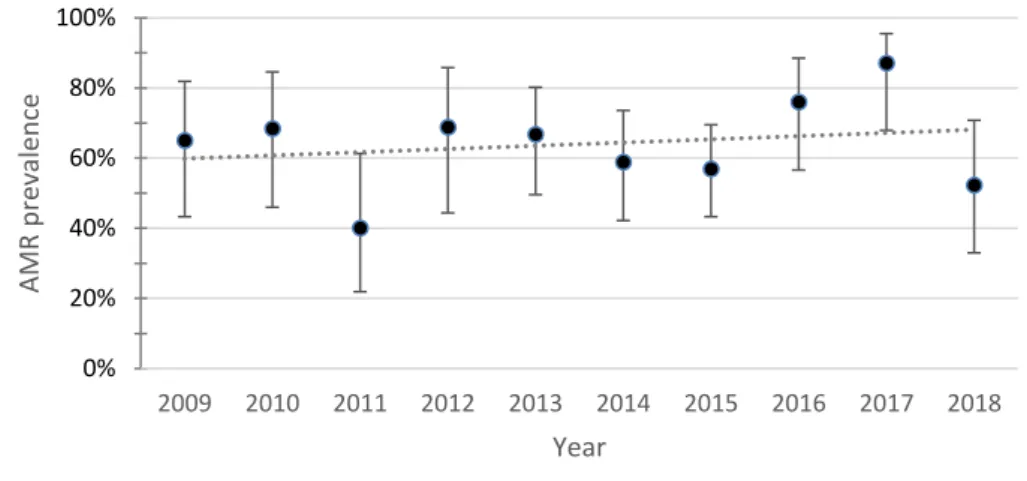
Fig. 3. Yearly resistance prevalence of APEC to tetracycline. The dotted line represents a linear trendline. Error bars represent the 95%CI for each year. Spearman test value: p=0.777, r=0.103
Fig. 4. Yearly resistance prevalence of APEC to doxycycline. The dotted line represents a linear trendline. Error bars represent the 95%CI for each year. Spearman test value: p=0.160, r=0.480
Resistance to both tetracycline and doxycycline showed an increasing trend. Despite having an increasing trend, resistance to tetracycline decreased from 65% (95%CI 43.3-81.9) in 2009 to 52.2% (95%CI 33-70.8) in 2018. Resistance to doxycycline increased from 60% (95%CI 38.7-78.1) in 2009 to 69.6% (95%CI 49.1-84.4) in 2018. 0% 20% 40% 60% 80% 100% 2009 2010 2011 2012 2013 2014 2015 2016 2017 2018 AMR p re valence Year
Tetracycline
0% 20% 40% 60% 80% 100% 2009 2010 2011 2012 2013 2014 2015 2016 2017 2018 AMR p re valence YearDoxycycline
12
3.3.3 Aminoglycosides
The evolution of APEC resistance to the aminoglycosides apramycin and neomycin are shown in Figures 5 and 6.
Fig. 5. Yearly resistance prevalence of APEC to apramycin. The dotted line represents a linear trendline. Error bars represent the 95%CI for each year. Spearman test value: p=0.108, r=0.539
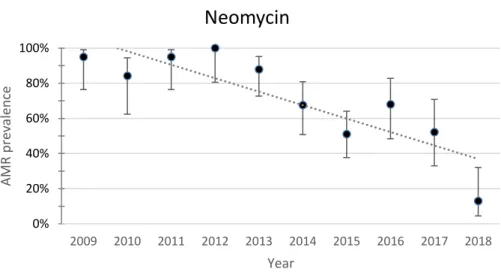
Fig. 6. Yearly resistance prevalence of APEC to neomycin. The dotted line represents a linear trendline. Error bars represent the 95%CI for each year. Spearman test value: p=0.005, r=-0.809
The resistance to apramycin and neomycin over the ten-year period showed opposing trends. Despite both being aminoglycosides, resistance to apramycin had an increasing trend while resistance to neomycin presented a decreasing trend. Resistance to apramycin increased from 15% (95%CI 5.2-36) in 2009 to 21.7% (95%CI 9.7-41.9) in 2018. Resistance to neomycin decreased from 95% (95%CI 76.4-99.1) in 2009 to 13% (95%CI 4.5-32.1) in 2018. The Spearman test value was significant for neomycin (p=0.005).
0% 20% 40% 60% 80% 100% 2009 2010 2011 2012 2013 2014 2015 2016 2017 2018 AMR p re valence Year
Apramycin
0% 20% 40% 60% 80% 100% 2009 2010 2011 2012 2013 2014 2015 2016 2017 2018 AMR p re valence YearNeomycin
13
3.3.4 Quinolones
The evolution of APEC resistance to second-generation quinolone (fluoroquinolone) enrofloxacin and first-generation quinolone flumequine are shown in Figures 7 and 8.
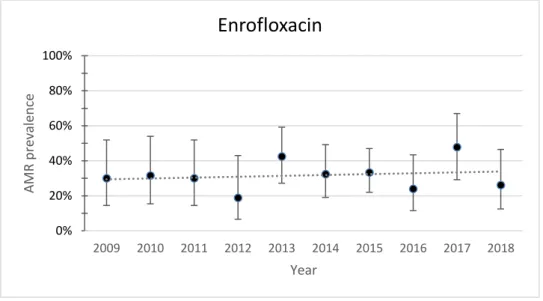
Fig. 7. Yearly resistance prevalence of APEC to enrofloxacin. The dotted line represents a linear trendline. Error bars represent the 95%CI for each year. Spearman test value: p=0.725, r=0.128
Fig. 8. Yearly resistance prevalence of APEC to flumequine. The dotted line represents a linear trendline. Error bars represent the 95%CI for each year. Spearman test value: p=0.603, r=-0.188
The resistance to enrofloxacin and flumequine showed opposing trends. Resistance to enrofloxacin presented an increasing trend while resistance to flumequine presented a decreasing trend. Both the increase of resistance to enrofloxacin and the decrease of resistance to flumequine is almost unnoticeable. Despite the increasing trend, resistance to enrofloxacin decreased from 30% (95%CI 14.5-51.9) in 2009 to 26.1% (95%CI 12.5-46.5) in 2018.
0% 20% 40% 60% 80% 100% 2009 2010 2011 2012 2013 2014 2015 2016 2017 2018 AMR p re valence Year
Enrofloxacin
0% 20% 40% 60% 80% 100% 2009 2010 2011 2012 2013 2014 2015 2016 2017 2018 AMR p re valence YearFlumequine
14
Resistance to flumequine increased from 25% (95%CI 11.2-46.9) in 2009 to 39.1% (95%CI 22.2-59.2) in 2018.
3.3.5 Sulfonamides+diaminopyrimidines and amphenicols
The evolution of APEC resistance to co-trimoxazole and florfenicol are shown in Figures 9 and 10.
Fig. 9. Yearly resistance prevalence of APEC to co-trimoxazole. The dotted line represents a linear trendline. Error bars represent the 95%CI for each year. Spearman test value: p=0.003, r=-0.830
Fig. 10. Yearly resistance prevalence of APEC to florfenicol. The dotted line represents a linear trendline. Error bars represent the 95%CI for each year. Spearman test value: p=0.003, r=-0.830
Resistance to both Trimethoprim+sulfamethoxazole (co-trimoxazole) and florfenicol presented a marked decreasing trend. Resistance to co-trimoxazole decreased from 90% (95%CI 69.9-97.2) in 2009 to 26.1% (95%CI 12.5-46.5) in 2018. Resistance to florfenicol decreased from 80%
0% 20% 40% 60% 80% 100% 2009 2010 2011 2012 2013 2014 2015 2016 2017 2018 AMR p re valence Year
Co-trimoxazole
0% 20% 40% 60% 80% 100% 2009 2010 2011 2012 2013 2014 2015 2016 2017 2018 AMR p re valence YearFlorfenicol
15
(95%CI 58.4-91.9) in 2009 to 8.7% (95%CI 2.4-26.8) in 2018. The Spearman test was significant for trimoxazole (p=0.003) and florfenicol (p=0.003).
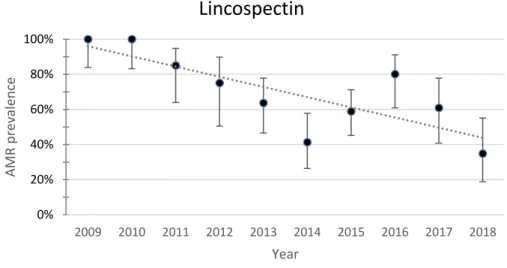
3.3.6 Lincosamides and lincosamides+aminoglycosides
The evolution of APEC resistance to lincomycin+spectinomycin and to lincomycin are shown in Figures 11 and 12.
Fig. 11. Yearly resistance prevalence of APEC to lincospectin. The dotted line represents a linear trendline. Error bars represent the 95%CI for each year. Spearman test value: p=0.005 ,r=0.802
Fig. 12. Yearly resistance prevalence of APEC to lincomycin. The dotted line represents a linear trendline. Error bars represent the 95%CI for each year. Spearman test value: p=0.013, r=0.745
The resistance to lincospectin and lincomycin showed opposing trends. Resistance to lincospectin showed a decreasing trend while resistance to lincomycin showed an increasing trend. Resistance to lincospectin decreased from 100% (95%CI 83.9-100) in 2009 to 34.8%
0% 20% 40% 60% 80% 100% 2009 2010 2011 2012 2013 2014 2015 2016 2017 2018 AMR p re valence Year
Lincospectin
0% 20% 40% 60% 80% 100% 2009 2010 2011 2012 2013 2014 2015 2016 2017 2018 AMR p re valence YearLincomycin
16
(95%CI 18.8-55.1) in 2018. Resistance to lincomycin increased from 80% (95%CI 58.4-91.9) in 2009 to 91.3% (95%CI 73.2-97.6) in 2018. The Spearman test was significant for lincospectin (p=0.005) and lincomycin (p=0.013)
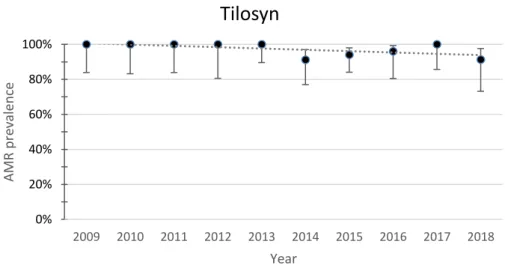
3.3.7 Macrolides
The evolution of APEC resistance to the macrolides tilmicosin and tylosin are shown in Figures 13 and 14.
Fig. 13. Yearly resistance prevalence of APEC to tilmicosin. The dotted line represents a linear trendline. Error bars represent the 95%CI for each year. Spearman test value: p=0.802, r=0.091
Fig. 14. Yearly resistance prevalence of APEC to tylosin. The dotted line represents a linear trendline. Error bars represent the 95%CI for each year. Spearman test value: p=0.070, r=-0.594
0% 20% 40% 60% 80% 100% 2009 2010 2011 2012 2013 2014 2015 2016 2017 2018 AMR p re valence Year
Tilmicosin
0% 20% 40% 60% 80% 100% 2009 2010 2011 2012 2013 2014 2015 2016 2017 2018 AMR p re valence YearTilosyn
17
The resistance to tilmicosin and tylosin showed opposing trends. Resistance to tilmicosin showed an increasing trend, but it is trending more towards stability than an actual increase. Resistance to tylosin showed a decreasing trend. Resistance to tilmicosin decreased from 95% (95%CI 76.4-99.1) in 2009 to 91.3% (95%CI 73.2-97.6) in 2018. Resistance to tylosin decreased from 100% (95%CI 83.9-100) in 2009 to 91.3% (95%CI 73.2-97.6) in 2018.
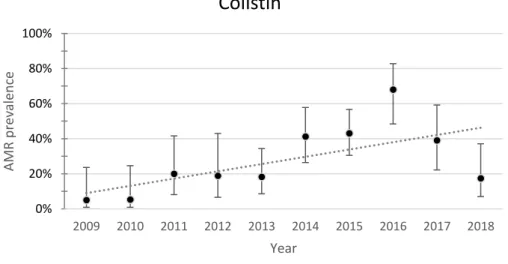
3.3.8 Pleuromutilins and polymyxins
The evolution of APEC resistance to tiamulin and colistin is shown in Figures 15 and 16.
Fig. 15. Yearly resistance prevalence of APEC to tiamulin. The dotted line represents a linear trendline. Error bars represent the 95%CI for each year. Spearman test value: p=0.000, r=0.899
Fig. 16. Yearly resistance prevalence of APEC to colistin. The dotted line represents a linear trendline. Error bars represent the 95%CI for each year. Spearman test value: p=0.108, r=0.539
0% 20% 40% 60% 80% 100% 2009 2010 2011 2012 2013 2014 2015 2016 2017 2018 AMR p re valence Year
Tiamulin
0% 20% 40% 60% 80% 100% 2009 2010 2011 2012 2013 2014 2015 2016 2017 2018 AMR p re valence YearColistin
18
The resistance to tiamulin and colistin presented opposing trends. Resistance to tiamulin showed a decreasing trend. Resistance to colistin showed an increasing trend. Resistance to tiamulin decreased from 100% (95%CI 83.9-100) in 2009 to 39.1% (95%CI 22.2-59.2) in 2018. Resistance to colistin increased from 5% (95%CI 0.9-23.6) in 2009 to 17.4% (95%CI 7.0-37.1) in 2018. Spearman test value was significant for tiamulin (p=0.000)
4. Discussion
The goal of this study was to determine the proportion of resistance of several avian pathogenic
E. coli strains of broiler breeder flocks to different antibiotics during a period of ten years, while
also evaluating the underlying trends. The data is organized by antimicrobial with the respective confidence interval values for each resistance proportion. It is also organized by year, allowing a trend analysis to be made. The representation of the data by year has its pros and cons. We have a higher definition, but the confidence intervals are much larger, as some years have a number of samples as low as 16. Still, we considered that the extra information provided by this layout was important for the understanding of the evolution of resistance over time. The total resistance proportion over the ten years is also present, which provides global insight into resistance patterns.
4.1 Resistance prevalences
In poultry, the most regularly used antimicrobial classes are the β-Lactams, polypeptides, aminoglycosides, macrolides, lincosamides, amphenicols (florfenicol), tetracyclines, sulphonamides, quinolones, and ionophores (Landoni & Albarellos 2015).
Macrolide antibiotics, such as Tylosin have a spectrum of activity that mainly includes Gram-positive, thus activity against Gram-negative bacteria is very limited (Hagren et al. 2005). Tylosin is considered as one of the most efficient compounds for treating mycoplasma infections in laying hens as it restores egg production, minimises transovarial transmission and reduces clinical signs (Landoni & Albarellos 2015). Tilmicosin is a bacteriostatic macrolide antibiotic for veterinary use only. It is mainly effective against Mycoplasma spp., Pasteurella spp., and several Gram-positive organisms (Abu-Basha et al. 2007).
Lincomycin has a spectrum of activity that includes most Gram-positive and some anaerobic bacteria, but not Gram-negative bacteria (Spížek & Řezanka 2004). In poultry, its major utility is the treatment of enteric infections, such as Clostridium perfringens-induced necrotic enteritis and intestinal spirochaetosis (Landoni & Albarellos 2015).
19
Tiamulin belongs to the Pleuromutilin class of antibacterials as it is a semi-synthetic derivative of Pleuromutilin. It is highly effective for treating Mycoplasma infections, and avian intestinal spirochaetosis (Landoni & Albarellos 2015).
The high resistance prevalence of these four previously mentioned antimicrobials is likely explained by the intrinsic resistance of Enterobacteriaceae. The remaining antimicrobials should have activity against E. coli.
The β-Lactams amoxicillin and ampicillin are broad-spectrum penicillins (Rang et al. 2011). Both have identical spectrums of activity that include all organisms susceptible to penicillin and lactamase-negative strains of Gram-negative cocci and bacilli such as E. coli (Katzung et al. 2009). In poultry, amoxicillin and ampicillin are indicated for the treatment of secondary infections in chronic respiratory disease caused by E. coli (Landoni & Albarellos 2015). On this study, both amoxicillin and ampicillin showed high resistance values. These values are very close to each other, which is normal as both belong to the same class. EUCAST considers that amoxicillin resistance could be inferred from ampicillin on disk diffusion tests (EUCAST). In Minnesota, Malik and colleagues found a resistance prevalence for ampicillin of 11.2% (Malik et
al. 2005) while in Egipt, a study on broilers obtained a value of 100% (Awad et al. 2016). In
Spain, a recent study on broilers reported a resistance prevalence of 78% for ampicillin, which is very similar to the values we obtained in this study (Solà-Ginés et al. 2015).
Tetracyclines have a very extensive spectrum of activity that encompasses Gram-positive and Gram-negative bacteria, Mycoplasma, Rickettsia, Chlamydia spp., spirochaetes and some protozoa (e.g. amoebae) (Rang et al. 2011). The antimicrobial activities of most tetracyclines are similar, except that strains resistant to tetracycline may still be susceptible to doxycycline, minocycline, and tigecycline, as these are poor substrates for the efflux pump (Katzung et al. 2009). Tetracycline and doxycycline had similar resistance prevalences. In Canada, Varga and colleagues found a tetracycline resistance prevalence of 57% for strains collected from broilers and broiler breeders(Varga et al. 2018). Solà-Ginés reported a tetracycline resistance prevalence of 91% (Solà-Ginés et al. 2015). In Thailand, Chansiripornchai and colleagues reported a resistance prevalence for doxycycline of 30% plus 18% of intermediate resistance (Chansiripornchai 2015).
The Aminoglycoside class of antimicrobials includes, among others, apramycin and neomycin. The spectrum of activity includes several aerobic Gram-negative and some Gram-positive
20
organisms. They are most commonly used to combat Gram-negative enteric bacteria and in sepsis (Rang et al. 2011). There is a big discrepancy between the values we obtained for apramycin and neomycin, despite both antimicrobials belonging to the same class. Varga and colleagues also found a high discrepancy between gentamycin, which had a resistance prevalence of 50%, and apramycin, with a resistance prevalence of 3% (Varga et al. 2018). Saidi and colleagues reported a resistance prevalence for neomycin of 54.4% plus 37.9% of intermediate resistance (Saidi et al. 2013) while Chansiripornchai and colleagues reported a resistance prevalence of 62% plus the 28% of intermediate resistance (Chansiripornchai 2015). Enrofloxacin is a fluoroquinolone antibacterial drug (Rang et al. 2011). Fluoroquinolones are effective against a wide array of critical poultry pathogens, including Mycoplasma, E. coli and
Pasteurella spp (Landoni & Albarellos 2015). Flumequine is useful in the treatment of
colibacillosis and may also be effective against other infections caused by Gram-negative bacteria (Ferraresi et al. 2013). In poultry, enrofloxacin is the most frequently used fluoroquinolone (Landoni & Albarellos 2015). Enrofloxacin and flumequine presented similar resistance prevalences. In China, Li and colleagues found a resistance prevalence of 83% (Li et
al. 2007) while Chansiriponchai and colleagues obtained a 24% prevalence plus 6% of
intermediate resistance for enrofloxacin (Chansiripornchai 2015). Malik and colleagues reported a resistance prevalence of 5.1% (Malik et al. 2005). In the USA, Huang and colleagues reported a resistance prevalence of and 3.4% plus 8.3% of intermediate resistance (Huang et al. 2009). These last two studies reported much lower resistance prevalence values when compared to our own.
Sulphonamides and diaminopyrimidines as folic acid synthesis inhibitors are bacteriostatic drugs, but in combination have a bactericidal activity and are effective against E. coli and
Pasteurella multocida (Landoni & Albarellos 2015). This antimicrobial combination blocks
sequential steps in folate synthesis, which results in an improvement of the activity of both antimicrobials (Katzung et al. 2009). We tested the combination of trimethoprim+sulfamethoxazole, most commonly known as co-trimoxazole. Malik and colleagues reported resistance prevalence for this combination of antimicrobials of 5% (Malik et
al. 2005). Varga and colleagues reported a resistance prevalence of 18% (Varga et al. 2018). In
Spain, Solá-Ginés and colleagues reported a much higher resistance value of 91% (Solà-Ginés et
21
Florfenicol is primarily bacteriostatic, and its spectrum of activity includes a wide diversity of Gram-negative and Gram-positive organisms as well as some chloramphenicol-resistant strains of E. coli (AL-Shahrani & Naidoo 2015). On account of its high effectiveness against E. coli,
Pasteurella spp. and Haemophilus spp., florfenicol is indicated for the treatment of respiratory
infections (Landoni & Albarellos 2015). Li and colleagues reported 29% (Li et al. 2007) while Huang and colleagues reported 12.8% resistance plus 62.7% intermediate resistance (Huang et
al. 2009). Solà-Ginés and colleagues obtained a much lower resistance prevalence of 6%
(Solà-Ginés et al. 2015).
Lincospectin combines lincomycin and spectinomycin, a lincosamide and an aminoglycoside. Lincomycin is also reported in this study, which allows a comparison between this antimicrobial and the combination of antimicrobials. Chansiripornchai and colleagues tested for Lincospectin resistance and reported a 30% resistance plus 42% intermediate resistance (Chansiripornchai 2015). The obtained resistance values for lincomycin is 89.8%, which may be expected as this antimicrobial does not have activity against E. coli. However, with the combination with spectinomycin, the resistance prevalence drops to 66.3%, which is still a high value, but it is considerably lower.
In general, the most worrying results are the high level of amoxicillin/ampicillin resistance, as broad-spectrum β-Lactams have higher priority in terms of treatment than tetracyclines, for example. Enrofloxacin, while being commonly used for the treatment of colibacillosis, does not have a remarkably high resistance prevalence.
4.2 Multidrug-resistance (MDR)
In terms of MDR, we considered a strain to be multidrug-resistant when it was non-susceptible, to one or more antimicrobials in three or more antimicrobial classes (Magiorakos et al. 2012). The 6 classes considered for this calculation were: β-Lactams, tetracyclines, aminoglycosides, fluoroquinolones, sulfonamides + diaminopyrimidines, and amphenicols. We found that 222 of the 264 strains (84.1%) were multidrug-resistant. The high number of multidrug-resistant strains is very alarming as it restricts treatment options. Also, the number of strains resistant to all tested antimicrobials classes is very substantial and it was not expected.
These values are, of course, dependent on the tested antimicrobial classes, which may make a comparison with other studies less plausible. Nonetheless, Solà-Ginés and colleagues, reported an MDR prevalence of 100% on APEC strains (Solà-Ginés et al. 2015). Zhang and colleagues,
22
in E. coli strains collected from chicken faecal samples, reported an MDR prevalence of 89.2% (Zhang et al. 2017). Both of these values are very high and close to the value we obtained in our study.
The European Union summary report on antimicrobial resistance in zoonotic and indicator bacteria from humans, animals and food in 2016, reports on MDR prevalence of indicator E. coli from poultry (European Food Safety Authority 2018). Of all the E. coli isolates from poultry tested by every country in the report, 50.2% were multidrug-resistant. However, in Portugal, roughly 79% of all isolates were multidrug-resistant. 22.2% of all isolates were susceptible to all tested antimicrobial classes, but in Portugal, only 2.5% were susceptible to all classes (European Food Safety Authority 2018). The values of the present study are very far from the values relating to all the isolates reported in the European Union summary report on antimicrobial resistance in zoonotic and indicator bacteria from humans, animals and food in 2016, but are very similar to the values that refer only to Portugal, despite being from indicator E. coli and not APEC. Overall, the values we obtained are very high, particularly the prevalence of strains that were resistant to all 6 tested classes, which may be very concerning. A quick comparison between the MDR prevalence we obtained for 2009 and for 2018 shows that in 2009 the prevalence of MDR strains was 100% while in 2018 it was 47.8%, which may indicate progress is being made on reducing resistance, and consequently multidrug-resistance.
4.3 Trend analysis
The resistance to amoxicillin, ampicillin, neomycin, flumequine, trimethoprim+sulfamethoxazole, florfenicol, lincospectin, tylosin, and tiamulin had a decreasing trend (Figures 1, 2, 6, 8, 9, 10, 11, 14, 15). Resistance to tetracycline, doxycycline, apramycin, enrofloxacin, lincomycin, tilmicosin, and colistin presented an increasing trend (Figures 3, 4, 5, 7, 12, 13, 16).
Spearman test values were significant for ampicillin, trimethoprim+sulfamethoxazole, florfenicol, neomycin, tiamulin, lincospectin, and lincomycin.
While test significance is relevant, it is very hard to obtain test values <0,05 with such a small n. Nonetheless, we can still draw conclusions from this data.
Excluding tylosin, tilmicosin, tiamulin, lincomycin, and colistin for the reasons stated above, most antimicrobials presented decreasing resistance trends, with just apramycin, enrofloxacin, tetracycline, and doxycycline presenting an increasing trend. It is also important to mention that
23
in the case of these increasing trends, there seems to be more stability instead of a marked increase. Contrarily, when there is a decreasing trend, there usually is a marked decrease in the resistance prevalence. This is a particularly important factor as it seems there has been a tendency for the decrease of resistance against most of the tested antimicrobials while maintaining similar levels of resistance against the others over the years, which is also a good indicator. Another good indicator is the stability of resistance against enrofloxacin, which is one of the most used antimicrobials for the treatment of colibacillosis.
The European Union summary report on antimicrobial resistance in zoonotic and indicator bacteria from humans, animals and food in 2016 (European Food Safety Authority 2018) has information on trends from 2008 to 2016, that include some antimicrobials that are also present in this study, but the strains of E. coli are indicator E. coli instead of APEC. Ampicillin and tetracycline are the two antimicrobials that have a trend analysis starting in 2008 and are both in the EU summary report and in this study. Resistance to ampicillin has decreased in 6 and increased in 4 out of the 13 countries that have been reporting resistance data since 2008. Resistance to tetracycline has decreased in 8 and increased in 1 (European Food Safety Authority 2018).
In general, the occurrence of AMR in the European Union in 2016 is similar, or lower by up to 5%, when compared with data from 2014 (European Food Safety Authority 2018). These results coincide with our findings that in general, resistance prevalence has been decreasing or, at least, being stable in later years.
Our results seem to indicate there have been significant decreases of resistance prevalence over these ten years, including resistance to antimicrobials that are regularly used such as amoxicillin. AMR tends to increase when antimicrobials are used frequently and inappropriately. To combat AMR, the use of antimicrobials must be reserved for situations where there is no other viable option. Therefore, a possible solution to reduce antimicrobial use is to prevent the occurrence of infection.
Over these ten years, much has changed in the sector, as knowledge increased in all areas, including husbandry, biosecurity, prophylaxis, and genetics. From 2009 to 2018, in the farms that were part of this study, there was a bigger investment in prophylaxis, with the use of nutraceuticals being much more common. Better husbandry along with better and more appropriate infrastructure also played a key role in disease prevention. Additionally, vaccinal
24
plan restructuring and the creation of new vaccines allowed for more efficient control of viral diseases. Infectious bronchitis virus and Newcastle disease virus infections are particularly harmful as they often cause immunosuppression that leads to secondary bacterial infection (Guabiraba & Schouler 2015). Genetics, on the other hand, may not have a direct impact either on the increase or decrease of disease occurrence, but it is still a factor that changed over these ten years. Finally, an E. coli vaccine was implemented five years ago and continues to be part of vaccinal plans. However, vaccine effectiveness may be low as APEC strains are very diverse (Guabiraba & Schouler 2015).
All these factors may have played a role in decreasing the occurrence of infection, which by itself reduces the quantity of administered antimicrobials. This reduction in antimicrobial use over these years may have been the cause for the apparent decreases in the resistance to several antimicrobials.
5. Conclusion
In conclusion, this study seems to indicate that AMR over these ten years is decreasing, or at least, being stable. However, the total resistance prevalence for some antimicrobials, especially β-Lactams and tetracyclines, is very high which is worrisome. The MDR values are also concerning, as it may indicate these E. coli strains have several resistance mechanisms, which allows them to be resistant to various antimicrobial classes simultaneously. While the resistance prevalence and MDR values may be alarming, the fact that the trend seems to be the decrease of resistance, allows us to also be optimistic. Resistance is likely to continue to increase if the selective pressure of antimicrobial use continues and resistant organisms are allowed to spread, therefore the control of antibiotic resistance needs to focus on both rational and adequate antimicrobial use to reduce selective pressure, and the practice of infection control measures to prevent the dissemination of resistant organisms, while also reducing the number of antimicrobial treatments. Constant awareness and monitoring are also fundamental in order to fight against AMR.
25
6. References
Abu-Basha EA, Idkaidek NM, Al-Shunnaq AF (2007) “Pharmacokinetics of tilmicosin (Provitil powder and pulmotil liquid AC) oral formulations in chickens.” Veterinary Research
Communications 31, 477–485
AL-Shahrani S, Naidoo V (2015) “Florfenicol induces early embryonic death in eggs collected from treated hens.” BMC Veterinary Research 11
Andrews JM (2002) “Determination of minimum inhibitory concentrations.” Journal of
Antimicrobial Chemotherapy 48, 5–16
Angulo FJ, Collignon P, Wegener HC, Braam P, Butler CD (2005) “The Routine Use of Antibiotics to Promote Animal Growth Does Little to Benefit Protein Undernutrition in the Developing World.” Clinical Infectious Diseases 41, 1007–1013
Awad A, Arafat N, Elhadidy M (2016) “Genetic elements associated with antimicrobial resistance among avian pathogenic Escherichia coli.” Annals of Clinical Microbiology and
Antimicrobials 15, 1–8
Bergeron CR, Prussing C, Boerlin P, Daignault D, Dutil L, Reid-Smith RJ, Zhanel GG, Manges AR (2012) “Chicken as reservoir for extraintestinal pathogenic Escherichia coli in Humans, Canada.” Emerging Infectious Diseases 18, 415–421
Van Boeckel TP, Brower C, Gilbert M, Grenfell BT, Levin SA, Robinson TP, Teillant A, Laxminarayan R (2015) “Global trends in antimicrobial use in food animals.” Proceedings of
the National Academy of Sciences 115, 5649–5654
Caniça M, Manageiro V, Jones-Dias D, Clemente L, Gomes-Neves E, Poeta P, Dias E, Ferreira E (2015) “Current perspectives on the dynamics of antibiotic resistance in different reservoirs.”
Research in Microbiology 166, 594–600
Chansiripornchai N (2015) “Antimicrobial sensitivity of avian pathogenic Escherichia coli ( APEC ) isolated from chickens during 2007-2010 Antimicrobial Sensitivity of Avian Pathogenic Escherichia coli.” The Thai Journal of Veterinary Medicine 41, 519–522
Cunha MPV, De Oliveira MGX, De Oliveira MCV, Da Silva KC, Gomes CR, Moreno AM, Knöbl T (2014) “Virulence profiles, phylogenetic background, and antibiotic resistance of Escherichia coli isolated from turkeys with airsacculitis.” Scientific World Journal 2014, 1–8
26
Dou X, Gong J, Han X, Xu M, Shen H, Zhang D, Zhuang L, Liu J, Zou J (2016) “Characterization of avian pathogenic Escherichia coli isolated in eastern China.” Gene 576, 244–248
EC (1831/2003) (2003) “Regulation (EC) No 1831/2003 of the European Parliament and of the Council of 22 September 2003.” Official Journal of the European Union 4, L 268/29-42 EUCAST EC on AST “The European Committee on Antimicrobial Susceptibility Testing. Breakpoint tables for interpretation of MICs and zone diameters Version 8.1, 2018.”
EUCAST EC on AST (2019) “Antimicrobial susceptibility testing EUCAST disk diffusion method - Version 7.0.” European Society of Clinical Microbiology and Infectious Diseases 0, 1–21
European Food Safety Authority (2018) “European Union summary report on antimicrobial resistance in zoonotic and indicator bacteria from humans, animals and food 2012 published.”
Eurosurveillance 19
FAOSTAT (2016) “Animal Data.” http://www.fao.org/faostat/en/#data/QA
Ferraresi C, Lucatello L, Meucci V, Intorre L, Grilli G, Piccirillo A, Russo E, Villa R, Montesissa C, Cagnardi P (2013) “Pharmacokinetic/pharmacodynamic evaluation of the efficacy of flumequine in treating colibacillosis in turkeys.” Poultry Science 92, 3158–3165
Guabiraba R, Schouler C (2015) “Avian colibacillosis: Still many black holes.” FEMS
Microbiology Letters 362
Hagren V, Peippo P, Lövgren T (2005) “Detecting and controlling veterinary drug residues in poultry.” Food Safety Control in the Poultry Industry
Hombach M, Böttger EC, Roos M (2013) “The critical influence of the intermediate category on interpretation errors in revised EUCAST and CLSI antimicrobial susceptibility testing guidelines.” Clinical Microbiology and Infection 19, 59–71
Huang T-M, Lin TL, Wu CC (2009) “Antimicrobial Susceptibility and Resistance of Chicken Escherichia Coli, Salmonella spp., and Pasteurella Multocida Isolates.” Avian Diseases 53, 89– 93
27
for microbiology 1–14
Katzung B., Masters SB, Trevor AJ (2009) Basic and Clinical Pharmacology
Kempf I, Jouy E, Chauvin C (2016) “Colistin use and colistin resistance in bacteria from animals.” International Journal of Antimicrobial Agents 48, 598–606
Landoni MF, Albarellos G (2015) “The use of antimicrobial agents in broiler chickens.”
Veterinary Journal 205, 21–27
Li XS, Wang GQ, Du XD, Cui BA, Zhang SM, Shen JZ (2007) “Antimicrobial susceptibility and molecular detection of chloramphenicol and florfenicol resistance among Escherichia coli isolates from diseased chickens.” Journal of Veterinary Science 8, 243–247
“MacConkey Agar (MAC): Composition, preparation, uses and colony characteristics” 2013 Magiorakos AP, Srinivasan A, Carey RB, Carmeli Y, Falagas ME, Giske CG, Harbarth S, Hindler JF, Kahlmeter G, Olsson-Liljequist B, Paterson DL, Rice LB, Stelling J, Struelens MJ, Vatopoulos A, Weber JT, Monnet DL (2012) “Multidrug-resistant, extensively drug-resistant and pandrug-resistant bacteria: An international expert proposal for interim standard definitions for acquired resistance.” Clinical Microbiology and Infection 18, 268–281
Malik YS, Chander Y, Gupta SC, Goyal SM (2005) “A retrospective study on antimicrobial resistance in Mannheimia (Pasteurella) haemolytica, Escherichia coli, Salmonella species, and Bordetella avium from chickens in Minnesota.” Journal of Applied Poultry Research 14, 506– 511
Marinho CM, Santos T, Gonçalves A, Poeta P, Igrejas G (2016) “A decade-long commitment to antimicrobial resistance surveillance in Portugal.” Frontiers in Microbiology 7
Mottet A, Tempio G (2017) “Global poultry production: Current state and future outlook and challenges.” World’s Poultry Science Journal 73, 245–256
Munita JM, Arias CA, Santiago A De (2016) “Mechanism of Antibiotic Resistance.”
Microbiology Spectrum 4
OIE (2018) “http://www.oie.int/amr2018/en/.” http://www.oie.int/amr2018/en/
Rang H, Dale M, Ritter J, Flower R, Henderson G (2011) “Drugs used for the treatment of infections, cancer and immunulogical disorders” in Rang and Dale’s Pharmacology, 7º ed,
28 London: Churchill Livingstone Elsevier, 622-633
Reygaert WC (2014) “Antimicrobial Mechanisms of Escherichia coli.” Intech open 2, 64
Saidi B, Mafirakureva P, Mbanga J (2013) “Antimicrobial Resistance of Escherichia coli Isolated from Chickens with Colibacillosis in and Around Harare, Zimbabwe.” Avian Diseases 57, 152–154
Solà-Ginés M, Cameron-Veas K, Badiola I, Dolz R, Majó N, Dahbi G, Viso S, Mora A, Blanco J, Piedra-Carrasco N, González-López JJ, Migura-Garcia L (2015) “Diversity of multi-drug resistant avian pathogenic Escherichia coli (APEC) Causing outbreaks of colibacillosis in broilers during 2012 in Spain.” PLoS ONE 10
Spížek J, Řezanka T (2004) “Chemical Structure, Biosynthesis, Mechanism of Action, Resistance, and Applications.” Advances in Applied Microbiology
United Nations. (2016) “Political Declaration of the High-Level Meeting of the General Assembly on Antimicrobial Resistance.” Draft resolution submitted by the President of the
General Assembly
Varga C, Brash ML, Slavic D, Boerlin P, Ouckama R, Weis A, Petrik M, Philippe C, Barham M, Guerin MT (2018) “Evaluating Virulence-Associated Genes and Antimicrobial Resistance of Avian Pathogenic Escherichia coli Isolates from Broiler and Broiler Breeder Chickens in Ontario, Canada.” Avian Diseases 62, 291–299
World Health Organization (2015) “Global action plan on antimicrobial resistance.” Geneva:
World Health Organization
World Organisation for Animal Health (2015) OIE Standards, Guidelines and Resolution on
antimicrobial resistance and the use of antimicrobial agents.
Zhang P, Shen Z, Zhang C, Song L, Wang B, Shang J, Yue X, Qu Z, Li X, Wu L, Zheng Y, Aditya A, Wang Y, Xu S, Wu C (2017) “Surveillance of antimicrobial resistance among Escherichia coli from chicken and swine, China, 2008–2015.” Veterinary Microbiology 203, 49–55.
29
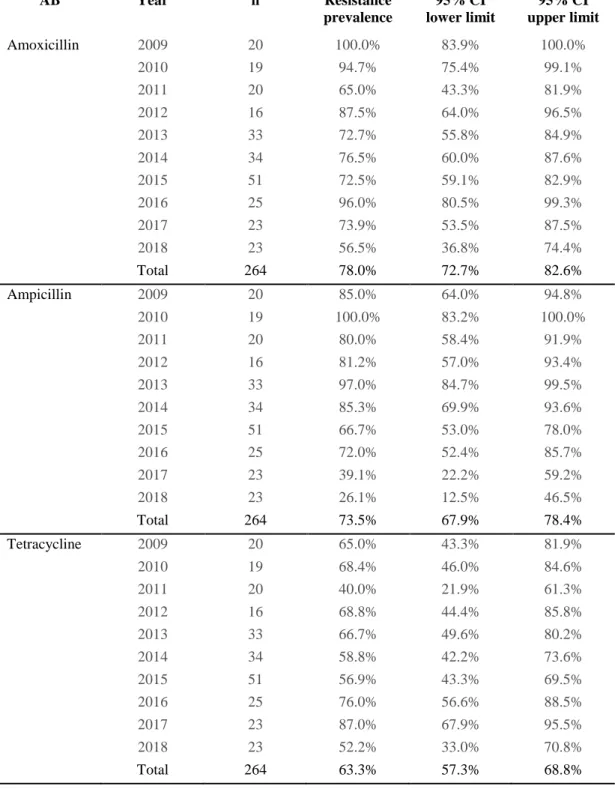
7. Annex
Table 1. Resistance prevalences and respective 95% confidence interval limits.
AB Year n Resistance prevalence 95% CI lower limit 95% CI upper limit Amoxicillin 2009 20 100.0% 83.9% 100.0% 2010 19 94.7% 75.4% 99.1% 2011 20 65.0% 43.3% 81.9% 2012 16 87.5% 64.0% 96.5% 2013 33 72.7% 55.8% 84.9% 2014 34 76.5% 60.0% 87.6% 2015 51 72.5% 59.1% 82.9% 2016 25 96.0% 80.5% 99.3% 2017 23 73.9% 53.5% 87.5% 2018 23 56.5% 36.8% 74.4% Total 264 78.0% 72.7% 82.6% Ampicillin 2009 20 85.0% 64.0% 94.8% 2010 19 100.0% 83.2% 100.0% 2011 20 80.0% 58.4% 91.9% 2012 16 81.2% 57.0% 93.4% 2013 33 97.0% 84.7% 99.5% 2014 34 85.3% 69.9% 93.6% 2015 51 66.7% 53.0% 78.0% 2016 25 72.0% 52.4% 85.7% 2017 23 39.1% 22.2% 59.2% 2018 23 26.1% 12.5% 46.5% Total 264 73.5% 67.9% 78.4% Tetracycline 2009 20 65.0% 43.3% 81.9% 2010 19 68.4% 46.0% 84.6% 2011 20 40.0% 21.9% 61.3% 2012 16 68.8% 44.4% 85.8% 2013 33 66.7% 49.6% 80.2% 2014 34 58.8% 42.2% 73.6% 2015 51 56.9% 43.3% 69.5% 2016 25 76.0% 56.6% 88.5% 2017 23 87.0% 67.9% 95.5% 2018 23 52.2% 33.0% 70.8% Total 264 63.3% 57.3% 68.8%
30 Doxycycline 2009 20 60.0% 38.7% 78.1% 2010 19 47.4% 27.3% 68.3% 2011 20 60.0% 38.7% 78.1% 2012 16 43.8% 23.1% 66.8% 2013 33 51.5% 35.2% 67.5% 2014 34 38.2% 23.9% 55.0% 2015 51 52.9% 39.5% 65.9% 2016 25 76.0% 56.6% 88.5% 2017 23 73.9% 53.5% 87.5% 2018 23 69.6% 49.1% 84.4% Total 264 56.4% 50.4% 62.3% Apramycin 2009 20 15.0% 5.2% 36.0% 2010 19 15.8% 5.5% 37.6% 2011 20 31.6% 15.4% 54.0% 2012 16 25.0% 10.2% 49.5% 2013 33 30.3% 17.4% 47.3% 2014 34 23.5% 12.4% 40.0% 2015 51 37.3% 25.3% 51.0% 2016 25 88.0% 70.0% 95.8% 2017 23 43.5% 25.6% 63.2% 2018 23 21.7% 9.7% 41.9% Total 264 34.5% 29.0% 40.4% Neomycin 2009 20 95.0% 76.4% 99.1% 2010 19 84.2% 62.4% 94.5% 2011 20 95.0% 76.4% 99.1% 2012 16 100.0% 80.6% 100.0% 2013 33 87.9% 72.7% 95.2% 2014 34 67.6% 50.8% 80.9% 2015 51 51.0% 37.7% 64.1% 2016 25 68.0% 48.4% 82.8% 2017 23 52.2% 33.0% 70.8% 2018 23 13.0% 4.5% 32.1% Total 264 68.2% 62.3% 73.5% Enrofloxacin 2009 20 30.0% 14.5% 51.9% 2010 19 31.6% 15.4% 54.0% 2011 20 30.0% 14.5% 51.9% 2012 16 18.8% 6.6% 43.0% 2013 33 42.4% 27.2% 59.2% 2014 34 32.4% 19.1% 49.2% 2015 51 33.3% 22.0% 47.0% 2016 25 24.0% 11.5% 43.4% 2017 23 47.8% 29.2% 67.0% 2018 23 26.1% 12.5% 46.5% Total 264 32.6% 27.2% 38.4%
31 Flumequine 2009 20 25.0% 11.2% 46.9% 2010 19 57.9% 36.3% 76.9% 2011 20 35.0% 18.1% 56.7% 2012 16 50.0% 28.0% 72.0% 2013 33 39.4% 24.7% 56.3% 2014 34 47.1% 31.5% 63.3% 2015 51 39.2% 27.0% 52.9% 2016 25 28.0% 14.3% 47.6% 2017 23 34.8% 18.8% 55.1% 2018 23 39.1% 22.2% 59.2% Total 264 39.4% 33.7% 45.4% Co-trimoxazolea 2009 20 90.0% 69.9% 97.2% 2010 19 68.4% 46.0% 84.6% 2011 20 45.0% 25.8% 65.8% 2012 16 62.5% 38.6% 81.5% 2013 33 69.7% 52.7% 82.6% 2014 34 50.0% 34.1% 65.9% 2015 51 27.5% 17.1% 40.9% 2016 25 28.0% 14.3% 47.6% 2017 23 39.1% 22.2% 59.2% 2018 23 26.1% 12.5% 46.5% Total 264 47.7% 41.8% 53.7% Florfenicol 2009 20 80.0% 58.4% 91.9% 2010 19 84.2% 62.4% 94.5% 2011 20 100.0% 83.9% 100.0% 2012 16 87.5% 64.0% 96.5% 2013 33 81.8% 65.6% 91.4% 2014 34 44.1% 28.9% 60.5% 2015 51 13.7% 6.8% 25.7% 2016 25 12.0% 4.2% 30.0% 2017 23 13.0% 4.5% 32.1% 2018 23 8.7% 2.4% 26.8% Total 264 46.6% 40.7% 52.6% Lincospectinb 2009 20 100.0% 83.9% 100.0% 2010 19 100.0% 83.2% 100.0% 2011 20 85.0% 64.0% 94.8% 2012 16 75.0% 50.5% 89.8% 2013 33 63.6% 46.6% 77.8% 2014 34 41.2% 26.4% 57.8% 2015 51 58.8% 45.2% 71.2% 2016 25 80.0% 60.9% 91.1% 2017 23 60.9% 40.8% 77.8% 2018 23 34.8% 18.8% 55.1% Total 264 66.3% 60.4% 71.7%
32 Lincomycin 2009 20 80.0% 58.4% 91.9% 2010 19 84.2% 62.4% 94.5% 2011 20 95.0% 76.4% 99.1% 2012 16 87.5% 64.0% 96.5% 2013 33 87.9% 72.7% 95.2% 2014 34 88.2% 73.4% 95.3% 2015 51 90.2% 79.0% 95.7% 2016 25 96.0% 80.5% 99.3% 2017 23 95.7% 79.0% 99.2% 2018 23 91.3% 73.2% 97.6% Total 264 89.8% 85.5% 92.9% Tilmicosin 2009 20 95.0% 76.4% 99.1% 2010 19 100.0% 83.2% 100.0% 2011 20 90.0% 69.9% 97.2% 2012 16 68.8% 44.4% 85.8% 2013 33 81.8% 65.6% 91.4% 2014 34 55.9% 39.5% 71.1% 2015 51 90.2% 79.0% 95.7% 2016 25 100.0% 86.7% 100.0% 2017 23 95.7% 79.0% 99.2% 2018 23 91.3% 73.2% 97.6% Total 264 86.0% 81.3% 89.7% Tylosin 2009 20 100.0% 83.9% 100.0% 2010 19 100.0% 83.2% 100.0% 2011 20 100.0% 83.9% 100.0% 2012 16 100.0% 80.6% 100.0% 2013 33 100.0% 89.6% 100.0% 2014 34 91.2% 77.0% 97.0% 2015 51 94.1% 84.1% 98.0% 2016 25 96.0% 80.5% 99.3% 2017 23 100.0% 85.7% 100.0% 2018 23 91.3% 73.2% 97.6% Total 264 96.6% 93.6% 98.2% Tiamulin 2009 20 100.0% 83.9% 100.0% 2010 19 100.0% 83.2% 100.0% 2011 20 100.0% 83.9% 100.0% 2012 16 100.0% 80.6% 100.0% 2013 33 100.0% 89.6% 100.0% 2014 34 79.4% 63.2% 89.7% 2015 51 76.5% 63.2% 86.0% 2016 25 96.0% 80.5% 99.3% 2017 23 65.2% 44.9% 81.2% 2018 23 39.1% 22.2% 59.2% Total 264 84.1% 79.2% 88.0%
33 Colistin 2009 20 5.0% 0.9% 23.6% 2010 19 5.3% 0.9% 24.6% 2011 20 20.0% 8.1% 41.6% 2012 16 18.8% 6.6% 43.0% 2013 33 18.2% 8.6% 34.4% 2014 34 41.2% 26.4% 57.8% 2015 51 43.1% 30.5% 56.7% 2016 25 68.0% 48.4% 82.8% 2017 23 39.1% 22.2% 59.2% 2018 23 17.4% 7.0% 37.1% Total 264 30.7% 25.4% 36.5% aTrimethoprim + Sulfamethoxazole bLincomycin + Spectinomycin