1
Behavior of thin lightly reinforced flat slabs under concentric loading
1Ala Torabiana,b, Brisid Isufib, Davood Mostofinejada and António Pinho Ramosb,c
2
aDepartment of Civil Engineering, Isfahan University of Technology (IUT), Isfahan, Iran
3
bDepartment of Civil Engineering, Faculty of Science and Technology, Universidade NOVA
4
de Lisboa, Caparica, Portugal
5
cCERIS, Lisbon, Portugal
6
Corresponding author: Ala Torabian; ala.torabian@cv.iut.ac.ir 7
Abstract
8
The current research aims to study the behavior of thin reinforced concrete (RC) slabs under
9
concentrated loads as well as to investigate the application of Critical Shear Crack Theory
10
(CSCT) to such slabs. For this purpose, four square 100-mm-thick slabs were cast and
11
subjected to concentrated punching monotonic loading. The experimental parameters were
12
the flexural reinforcement ratio, 0.38% and 1.00%, and the presence or absence of shear
13
headed stud reinforcement. It is shown that the failure criteria of CSCT describe reasonably
14
well the observed failure modes and the ultimate loads of the specimens. However, attention
15
is brought to some peculiarities in the analytical derivation of the load-rotation curve for thin
16
lightly reinforced flat slabs, in which large deformations are experienced. Results showed that
17
in such slabs, the behavior can be highly influenced by the post-yield stress-strain curve of
18
the flexural steel reinforcement. As a result, the constitutive law of steel reinforcement should
19
be explicitly taken into account in such cases. The versatility of CSCT to adapt to these
20
conditions is demonstrated.
21
Keywords: Critical shear crack theory; punching; thin flat slab; flexural reinforcement ratio;
22
shear headed stud; post-yield.
23
Declarations of interest: none.
24
1 Introduction
25
The use of RC flat slabs for buildings has some advantages over other RC structural systems
26
such as beam supported slabs or slabs with column capitals or drop-down panels. These
2
advantages include providing more clear space for a given story height and reducing the total
28
height and weight of the building. On the other hand, thin flat slabs suffer from low punching
29
shear capacity and higher deformability. An effective solution for improving the punching
30
shear strength is to employ shear reinforcement around the column, for instance, headed
31
shear studs [1-3] or stirrups [4], which enables the design of thinner flat slabs with higher
32
punching shear capacity, provided that the serviceability limit states are fulfilled. Using shear
33
reinforcement, however, has noticeable effects on the ultimate behavior of flat slabs, which
34
need to be recognized. According to previous researches, ductility of flat slabs can
35
significantly be enhanced by using shear stud reinforcement [1,2]. External shear
36
strengthening of RC slabs using post-installed steel bolts or using fiber-reinforced polymer
37
(FRP) rods, fans, or grids was proved to have similar effects on the slab behavior [5-8].
38
In two-way RC slabs with no shear reinforcement, the general behavior is highly dependent
39
on the flexural reinforcement ratio. There are several studies in the literature investigating the
40
behavior of two-way slabs with different flexural reinforcement ratios [1, 9-11]. According to
41
them, three general behaviours can be observed based on the amount of flexural
42
reinforcement, as follows:
43
- The behavior of lightly reinforced slabs is generally ductile, identified by an entire spread
44
of rebars yielding through the full yield-line pattern, deep intrusion of tension cracks, and
45
large plastic deflection of slab prior to failure. Despite the general ductile behavior of
46
such slabs throughout the plastic plateau, the ultimate punching failure remains brittle and
47
leads to a sudden drop in the load carrying capacity of the slab. This type of punching
48
failure is referred to as “flexure-induced punching” [12] and it can lead to an apparent
49
overestimation of the punching shear capacity of lightly reinforced slabs when compared
50
to current code provisions [12]. Yield-line analysis can be used to estimate the capacity of
51
this type of slabs, although the failure loads obtained from the experimental tests are
52
usually larger than the theoretical yield-line, attributed to different causes, e.g. membrane
53
forces, boundary restraints, second-order effects which allow the slab to act as a folded
54
plate, and the neglect of tensile strength of plain concrete [11, 13-15]. While the lightly
55
reinforced slab experiences considerable rotation, a horizontal asymptote is often
56
observed in its load-rotation curve which represents yielding of the entire flexural
57
reinforcement.
3
- Slabs with medium reinforcement ratio generally fail in a combined flexural-shear failure.
59
Partial yielding of flexural reinforcement occurs in the vicinity of the column and
60
probably along diagonal yield-lines, depending on the level of flexural reinforcement.
61
The lower the reinforcement ratio is, the more the propagation of yielding approaches the
62
full yield-line pattern. In such slabs, punching can occur before yielding of the entire
63
reinforcement at a load level which is lower than the flexural capacity of slab determined
64
by yield-line analysis.
65
- At high levels of reinforcement, the failure of the slab under concentric loading generally
66
occurs by a brittle punching shear mode, with limited or no yielding of the reinforcement.
67
In this case, the formation of tension cracking prior to the ultimate failure is minimal and
68
the rotation of the slab is relatively small.
69
The punching shear failure of two-way RC slabs with or without shear reinforcement is a
70
relatively well-studied subject. Accordingly, intense efforts have been made to predict the
71
punching shear capacity of slabs in interior and exterior connections with different
72
characteristics, including different flexural reinforcement ratios, presence or absence of shear
73
reinforcement, and different external strengthening systems.
74
Based on experimental investigations, design codes present expressions for estimating the
75
punching shear strength of RC slabs, mostly empirical. In most expressions proposed by
76
codes, punching shear strength of slabs without shear reinforcement is defined as a function
77
of concrete compressive strength, slab thickness, column size, and flexural reinforcement
78
ratio. The expressions proposed by ACI 318 [16] and Eurocode 2 [17] are presented in Table
79
1. The basic ACI 318 provision for punching capacity has not changed since 1963 and is
80
independent of the reinforcement ratio [16]. On the other hand, the punching shear strength
81
provision of Eurocode 2, which is based on Model Code 1990 [18], is depended on the
82
flexural reinforcement ratio [17]. Formulations to evaluate the punching shear capacity of
83
slabs reinforced with different types of punching shear reinforcement can also be found in
84
codes of practice. Crushing of the concrete struts in the vicinity of the column, punching
85
within the shear-reinforced slab zone, and punching outside this zone are the failure modes
86
that are considered in the codes. Criteria or expressions are presented by codes to consider the
87
strength of the slab corresponding to each of the above-mentioned failure modes, and the
88
minimum strength specifies the governing failure mode of the slab.
4
Table 1 ACI 318 and Eurocode 2 expressions for punching shear
90 Code Expressions ACI 318 [16] v min ⎩ ⎪ ⎨ ⎪ ⎧ 0.33 f 0.17 1 2 β f 0.083 α d b 2 f where
fc is the specified compressive strength of concrete
β is the ratio of long to short sides of the column
αs is 40, 30, and 20 for an interior, edge, and corner column, respectively
d is the effective depth of slab
b0 is the perimeter length of the critical section assumed at a distance 0.5d from the column edge
Eurocode 2 [17] 𝑣 0.18 𝛾⁄ 𝑘 100𝜌𝑓 / 𝑣 where
𝑘 1 200/𝑑 2.0
γc is the partial factor for concrete
fck is the characteristic compressive strength of concrete at 28 days
𝜌 𝜌 ∙ 𝜌 0.02
ρy and ρz are the ratios in two perpendicular y and z directions, respectively. ρy and ρz are calculated as mean values considering a slab width equal to the column width plus 3d each side.
𝑣 0.035𝑘 / 𝑓 /
One of the most comprehensive approaches to describe the behavior of flat slabs under
91
concentric loading is the Critical Shear Crack Theory (CSCT). The fundamentals of the
92
theory were first presented by Muttoni and Schwartz [19], based on earlier work by Kinnunen
5
and Nylander [20], according to which- for structural elements without shear reinforcement-
94
“a critical shear crack” propagating through the strut that carries the shear force to the column
95
is responsible for the punching shear failure and that the punching resistance is a function of
96
slab's rotation outside the critical shear crack. In Muttoni [21], the theory was completed by
97
including a failure criterion and a code-like formulation for the punching shear design of flat
98
slabs (refer to Section 2 for details). The application of CSCT for punching shear-reinforced
99
slabs was later extended by Ruiz and Muttoni [22] (refer to Section 2). Afterwards, the CSCT
100
was extended to different types of flat slabs by several researchers. Clément et al. [23, 24]
101
proposed its application to prestressed slabs. In 2014, Faria et al. [25] extended the
102
application of CSCT to slabs strengthened with FRP composites, by proposing changes to the
103
analytical derivation of the load-rotation curve as well as changes in the failure criterion
104
resulting from the application of FRP. Lapi et al. [26] demonstrated the versatility of CSCT
105
by applying it to flat slabs strengthened with a reinforced concrete overlay. A review and
106
summary of the work related to the extension of CSCT to various punching shear
107
strengthening techniques are presented in Lapi et al. [27].
108
In the current study, relatively thin slabs (with depth 100 mm) with and without shear studs
109
are tested under concentric punching shear load and the experimental results are compared
110
with CSCT predictions. Two different flexural reinforcement ratios are considered, 0.38%
111
and 1.00%. The present study sheds light on the applicability of CSCT in extreme cases (thin
112
slabs and low flexural reinforcement) and contributes towards the completeness of the theory.
113
In practice, the low flexural reinforcement ratio can be found in cases of high corrosion of
114
steel reinforcement or deficient initial design, for instance. The low thickness can represent a
115
deficient initial design in an existing structure or a poorly executed slab with a concrete cover
116
higher than the designed one. It should be noted that the main body of work on which the
117
CSCT theory is calibrated refers to interior slab-column connections; therefore, this study
118
focuses on internal slab-column connections to extend this theory in the above-mentioned
119
conditions.
120
2 Critical Shear Crack Theory
121
2.1 Description
122
An illustration of the application of CSCT is given in Fig. 1. According to the theory,
123
punching failure occurs at the intersection of the load-rotation curve with the failure criterion.
6
The load-rotation curve can be constructed using a nonlinear finite element analysis or
125
analytically for simple cases. The analytical solution for axisymmetric slabs is obtained by
126
dividing the slab into sector elements extended from the critical shear crack (located at a
127
radius r0=rc+d, where rc is the radius of the column, assumed circular and d is the slab’s
128
effective depth) to a radius equal to the radius of the hogging moment region of the slab. It is
129
assumed that the slab rotation, ψ, is constant outside the critical shear crack. Inside the radius
130
r0, the radial and tangential moments are assumed constant and the radial curvature is
131
assumed to be equal to the tangential curvature. Internal forces are then calculated assuming a
132
quadrilinear moment-curvature relationship and the equilibrium conditions of the sector
133
elements are used to calculate the shear force, V, for a given slab rotation, ψ [21].
134
135
Fig. 1. Example of application of CSCT for a slab-column connection without shear
136
reinforcement
137
For the construction of the load-rotation curve, Muttoni [21] also proposed a simplified
138
formulation based on the assumption that the load-rotation curve up to the flexural strength
139
Vflex follows a parabola with an exponent equal to 3/2:
140 3/2 1.5 s y s flex r f V dE V (1)
where, ψ is the slab rotation, rs is the radius of the slab (which, in the simplified approach can
141
be assumed equal to the radius of the zero moments line), fy is the steel yield stress, d is the
142
effective depth of the slab, Es is the modulus of elasticity of steel and V is the applied shear
143
force.
7
Based on a semi-empirical formulation, assuming crack width proportional to the slab
145
rotation (ψ) and effective depth (d) as well as taking into account the roughness of the crack,
146
the failure criterion (Fig. 1) for slabs without shear reinforcement is expressed as follows
147 [21]: 148 0 0 3 / 4 1 15 c g g V d b d f d d (2)
where, b0 is the control perimeter, taken at a distance d/2 from the face of the column; dg is
149
the maximum aggregate size and dg0=16 mm is a reference aggregate size.
150
Ruiz and Muttoni [22] extended the application of CSCT to the design of flat slabs with shear
151
reinforcement. In this case, the load-rotation relationship is assumed to be the same as in
152
slabs without shear reinforcement, because it only depends on the flexural properties of the
153
slab. For slabs with shear reinforcement, failure can occur through the shear reinforcement,
154
outside the shear-reinforced zone or near the face of the column due to the crushing of
155
concrete (Fig. 2). The resistance for each of these three failure modes is determined at the
156
intersection of the load-rotation curve with the corresponding failure criteria.
157
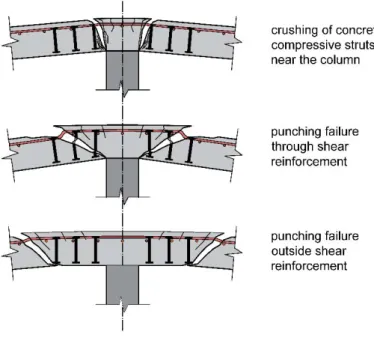
158
Fig. 2. Possible punching failure modes for slabs with punching shear reinforcement
8
The criterion for failure within the shear-reinforced zone is based on a simple mechanical
160
model consistent with CSCT, which considers the stress and bonding conditions in each shear
161
reinforcement leg. In contrast to the provisions of major design codes [16, 17], the
162
contribution of shear reinforcement is not considered constant for all levels of slab rotation in
163
CSCT [22].
164
The failure criterion for punching outside the shear reinforcement is calculated as in case of
165
slabs without shear reinforcement, but with an adapted perimeter (taken at a distance d/2
166
from the outermost shear reinforcement units) and with a reduced effective depth. This
167
accounts for the geometry of the crack outside the shear-reinforced zone due to pull-out of
168
shear reinforcement as a block [22].
169
Equations for the failure due to the crushing of concrete near the column are also provided in
170
Ruiz and Muttoni [22]. In this case, the right-hand side of Equation (2) is multiplied by a
171
factor λ equal to 3.0 for headed studs and 2.0 for other types of shear reinforcement. The
172
control perimeter is taken at a distance d/2 from the edges of the column.
173
2.2 Experimental validation of CSCT
174
CSCT for flat slabs without shear reinforcement was validated in Muttoni [21] against 87
175
experiments of isolated slab-column connections under monotonic concentric loading. The
176
failure criterion was based on a slightly larger database of 99 specimens. The database of
177
tests used in Muttoni [21] to validate the CSCT contained slabs with an effective depth
178
ranging from 96 mm to 464 mm.
179
An experimental campaign addressing specifically the behavior of flat slabs with low
180
amounts of flexural reinforcement was presented in Guandalini et al. [28]. In total, 11
181
specimens were tested under concentric loading, with a longitudinal reinforcement ratio
182
varying from 0.22% to 1.50% and slab thickness from 125 mm to 500 mm. Two of the
183
specimens, named PG-8 and PG-9 in Guandalini et al. [28], were both thin (thickness equal to
184
only 125 mm) and lightly reinforced (with a longitudinal ratio equal to 0.28% and 0.22%
185
respectively). In these two specimens, punching failure occurred after relatively large plastic
186
rotation of the slab. The experimental results of the 11 specimens fitted well with the failure
187
criterion of CSCT. Guandalini et al. [28] also reported a lightly reinforced thick slab
188
(thickness 500 mm). The thick lightly reinforced slab did not exhibit full yielding of the
9
flexural reinforcement and prematurely failed in punching in contrast to observations on
190
lightly reinforced thin slabs. CSCT predicted reasonably well the behavior of this specimen.
191
The extension of CSCT proposed in Ruiz and Muttoni [22] for shear-reinforced flat slabs was
192
validated against 45 concentric punching tests. In the database used by the authors [22], 19 of
193
the tests contained studs (either with smooth or deformed shaft). The effective depths of the
194
specimens varied from 124 mm to 350 mm.
195
Further verification of CSCT is presented in Einpaul et al. [29], where it was shown that
196
CSCT considers the influence of slab slenderness in a consistent manner and gives better
197
results compared to EC2 [17] and ACI 318 [16] codes. The 13 specimens reported in Einpaul
198
et al. [29] and 21 additional ones from the literature had an effective depth from 118 mm to
199
218 mm. Three of the specimens contained shear reinforcement.
200
3 Experimental campaign
201
3.1 Experiment preparation and test scheme
202
Four RC slabs of 1.85 1.85 0.1 m were constructed and tested as simply supported at their
203
perimeter with corners free to lift, whereas the effective flexural span was 1.7 m. The tests
204
were carried out in structural laboratory of Isfahan University of technology (IUT). A layout
205
of the tested slabs is shown in Fig.3, which also shows the specimens’ flexural reinforcement
206
details. Two different reinforcement ratios of 0.38% and 1.00% were used. The clear concrete
207
cover to the flexural rebars was set as 20 mm in all specimens. The specimens were cast
208
upside-down, meaning that the flexural reinforcement was placed next to the bottom of the
209
mould; therefore, proper control over the effective depth was possible. It should be
210
mentioned that since thin slabs are sensitive to construction tolerances, the locations of
211
flexural and shear reinforcement were properly adjusted in the mould; moreover, accurate
212
measurements of the effective depth were taken during casting as well as after testing.
213
Two of the test specimens were reinforced with a total of 12 shear stud rails with 8 layers.
214
The shear stud reinforcement was designed according to punching shear principles of ACI
215
318 and Eurocode 2 such that the shear reinforced specimens could reach their flexural
216
capacity before they fail in punching. The shear reinforcement arrangement is shown in Fig.4.
217
The available shear studs, with a shaft diameter of 19 mm and overall head diameter of 32
10
mm, were welded to an 8-mm-thick rail with a spacing of 55 mm using a stud welding gun
219
based on ASTM A1044 criteria [30]. Studs with such large shaft diameter were employed for
220
economic purposes since they were the only available studs in the local market, and the
221
available stud welding gun only fitted this size of the shaft. The diameter of the bearing
222
surface of the head was 30 mm. Based on ASTM A1044 [30] and ACI 318 [16], the area of
223
the head of headed shear studs is required to be at least 10 times the area of the shaft.
224
Accordingly, the effective diameter of the shaft was calculated as 9.5 mm fulfilling this
225
requirement considering the provided head bearing area. It should be noted that the effective
226
diameter was sufficient for the aim of this study since the purpose of employing the shear
227
studs was hindering occurrence of punching failure before achieving the flexural capacity;
228
and yielding of the studs was not aimed in this study. The stud rails were placed into the
229
mould such that the distance between the first row of studs and the column face was 30 mm.
230
The designation of the specimens along with a summary of their characteristics is presented
231
in Table 2.
232
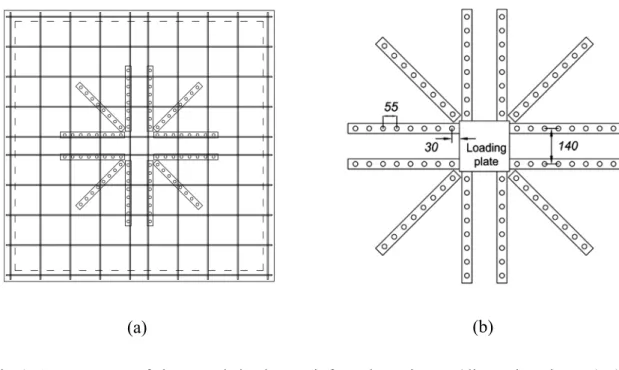
(a) (b)
Fig.3. Layout of test specimens and flexural reinforcement details (dimensions are in mm,
233
L1-L3 refer to LVDTs, and D1-D4 refer to dial gauges); (a) specimens with reinforcement
234
ratio of 0.38%; (b) specimens with reinforcement ratio of 1.00%
235
The compressive strength of the concrete used for the construction of specimens was
236
measured on average as 42 MPa by carrying out compression tests on 150 300 mm
237
cylindrical concrete samples in accordance with ASTM C39 [31]. The values for each
11
specimen are given in Table 2. The aggregates employed in the concrete included 5-12 mm
239
coarse aggregates and 0-5 mm sand. According to standard tensile tests conducted on steel
240
bars, the yield and ultimate strength of the employed rebars were 450 and 700 MPa,
241
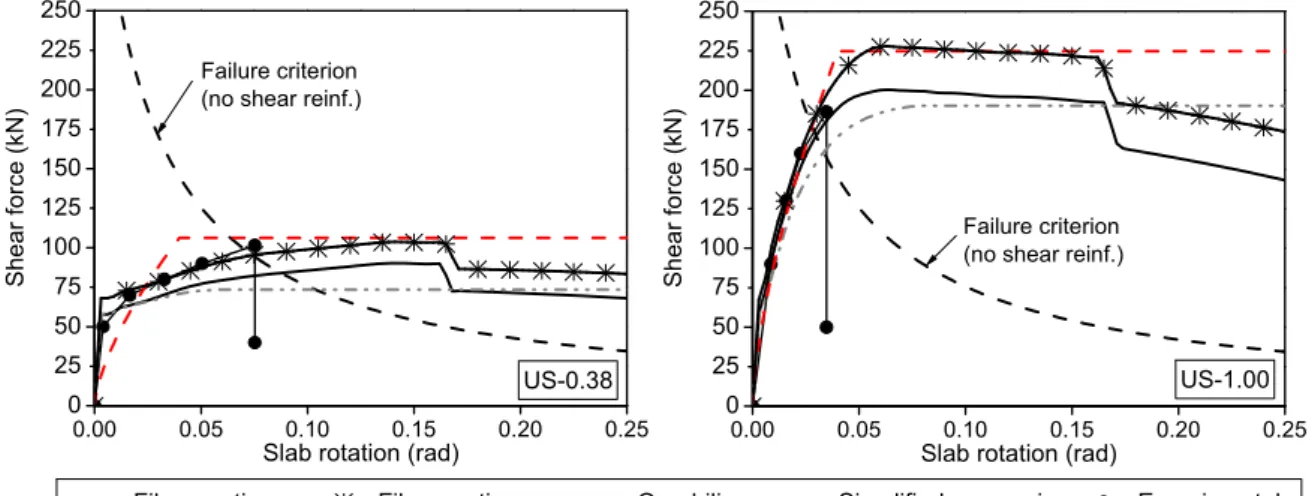
respectively. Tensile strength and yield strength of shear studs were respectively 450 MPa
242
and 350 MPa, based on the data reported by the manufacturer.
243
(a) (b)
Fig.4. Arrangement of shear studs in shear reinforced specimens (dimensions in mm); (a)
244
position of shear studs with respect to the flexural reinforcement; (b) close-up of shear
245
reinforcement
246
Table 2 Summary of specimens' characteristics and test results
247 Specimen Concrete strength fc (MPa) Flexural reinforcement ratio (%) Punching shear reinforcement Failure load (kN) Ultimate rotation (rad) US-0.38 43.0 0.38 Unreinforced 101.6 0.075
US-0.38-stud 41.7 0.38 Shear studs 117.1 0.189*
US-1.00 41.9 1.00 Unreinforced 186.3 0.035
US-1.00-stud 42.2 1.00 Shear studs 224.0 0.100
* Exact ultimate rotation was not measured due to limitations of the instruments, but it was
248
only marginally larger than the shown value
12
The specimens were tested using a reaction steel frame and the load was applied in the center
250
of the slab over an area of 200 200 mm2 (Fig.5).The load was measured by an external load
251
cell. Two linear variable differential transducers (LVDTs), L1-L2, and three dial gauges,
D1-252
D3, were installed along the width of the specimen with the arrangement shown in Fig.3. One
253
LVDT, L3, and one dial gauge, D4, were also placed along the diagonal direction of the
254
specimen: L3 at a distance of 350 mm from the central LVDT and D4 on top of the slab
255
corner (Fig.3).
256
257
Fig.5. Reaction frame and test setup
258
3.2 Experimental results
259
3.2.1 Deflections and load-rotation behavior
260
Fig.6 demonstrates the deflected shapes of the test specimens along their width for varying
261
load levels, which were obtained by measurements of the installed LVDTs and dial gauges.
262
According to CSCT, the deflected shape of the slab is conical outside the critical shear crack,
263
meaning that the rotation ψ of the slab can be considered constant in this region [21]. The
264
experimental results in the current study also confirm this claim, as the deflection profile of
265
each specimen represents a nearly conical shape of the deflected specimen (Fig.6).
13
(a)
(b)
Fig.6. Deflection profiles; (a) specimens with reinforcement ratio of 0.38%; (b)specimens
267
with reinforcement ratio of 1.00%
268
The load-rotation curves of all the tested specimens are presented in Fig.7. The slab’s rotation
269
at each load level was computed using the deflection profile outside the critical shear crack,
270
considering as the angle of the deformed shape of the slab upward from the undeformed
271
shape in this region. After a linear elastic branch, flexural cracking decreases the stiffness of
14
the specimens, which is then remarkably dependent on the flexural reinforcement ratio. As it
273
can be observed in Fig.7, the post-cracking stiffness of the specimens with low reinforcement
274
ratio (0.38%) is much lower than that of the specimens with 1.00% flexural reinforcement. In
275
lightly reinforced specimens with relatively small slab depths, large deflections are
276
experienced due to the spread of steel yielding while a plastic plateau can be observed. In
277
cases that the flexural steel reinforcement reaches the strain hardening region of the
stress-278
strain curve, the load capacity is gently increased while considerable deflection is
279
experienced. The post-cracking behavior of specimens with large deflections is therefore
280
influenced by the stress-strain curve of the flexural reinforcement.
281
282
Fig.7. Load-rotation curves of specimens
283
The deflection profiles of the specimens along half of their diameter were obtained using the
284
measurements of the LVDTs L1 and L3 and the dial gauge D4 (see Fig. 3). Fig. 8 shows
285
these profiles at different load levels. Accordingly, the distance between the central point and
286
the zero-deflection point was around 0.9 m.
287 0 50 100 150 200 250 0 0,05 0,1 0,15 0,2 Load (kN) Rotation (rad) US-0.38 US-0.38-stud US-1.00 US-1.00-stud
15
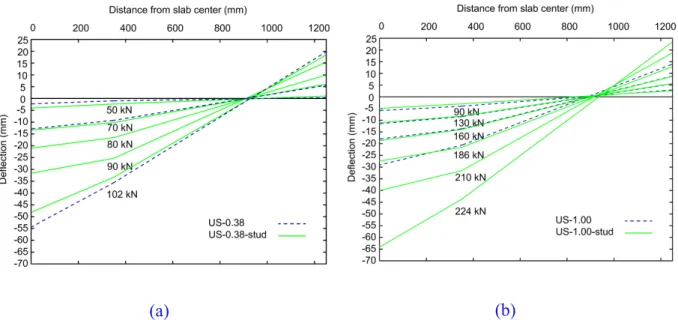
(a) (b)
Fig. 8. Deflection profiles along diagonal direction of specimens; (a) specimens US-0.38 and
288
US-0.38-stud; (b) specimens US-1.00 and US-1.00-stud
289
3.2.2 Cracking and failure modes
290
Fig.9 demonstrates the tension and compression faces of the tested specimens after failure.
291
The final failure mode for all specimens was punching shear. The behavior of each specimen
292
before ultimate failure was strongly influenced by the flexural reinforcement ratio as well as
293
the presence of shear reinforcement. In specimens US-0.38 and US-0.38-stud, radial flexural
294
cracks propagated in the tension face of the slab. By increasing the applied load, the
295
propagation and width of the cracks increased, yielding of the flexural reinforcement
296
approached the full yield-line pattern, and consequently, the slab experienced large plastic
297
deflections. Afterward, punching shear failure as the ultimate failure mode led to an abrupt
298
load drop. In specimen US-0.38, punching failure happened with a clearly delimited
299
punching cone (Fig.9a), and specimen US-0.38-stud experienced punching failure outside the
300
shear stud reinforcement. In the specimens with a reinforcement ratio of 1.00%, the behavior
301
of the slab was dependent on the existence of shear studs. In specimen US-1.00, hairline
302
flexural cracks with limited propagation formed, and then abrupt punching shear failure
303
occurred. In specimen US-1.00-stud, however, a significant spread of flexural cracks in the
304
radial direction was observed, and then the ultimate punching failure occurred outside the
305
shear studs after large deformation of the slab (Fig.9d). The general behavior and mode of
306
failure of shear stud reinforced specimens show that the employed studs reinforcement
307
worked properly although the provided anchorage was less than the anchorage required by
16
ACI 318 [16]. Indeed, as mentioned before, the provided anchorage for the studs is sufficient
309
for shaft diameter of 9.5 mm according to ACI 318 [16], which satisfies the required area of
310
shear reinforcement to resist punching shear failure inside the shear reinforcement.
311 (a) (b) Tension face Tension face Compression face Compression face
17
(c)
(d)
Fig.9. Specimens after failure; (a) specimen US-0.38; (b) specimen US-0.38-stud; (c)
312
specimen US-1.00; (d) specimen US-1.00-stud
313
3.2.3 Effect of shear reinforcement
314
The values of the failure load and ultimate rotation of the specimens are presented in Table 2.
315
Referring to these values and the load-rotation curves in Fig.7, it can be concluded that using
316
shear stud reinforcement leads to an enhancement of the load-bearing capacity of the slab as
317
well as an increase of its ultimate rotation. In fact, as can be observed in Fig.7, the specimen
318
Tension face
Tension face
Compression face
18
with shear studs behaved similarly to the specimen with no shear reinforcement up to the
319
maximum load level of the later, in accordance with the assumption presented by Ruiz and
320
Muttoni [22] for the extension of CSCT to shear-reinforced flat slabs.
321
In lightly reinforced specimens (US-0.38 and US-0.38-stud), utilizing shear studs did not
322
change the mode of failure as in both tests full yield-line pattern and flexural cracks formed
323
and then the slab finally failed in punching. However, shear reinforcement considerably
324
increased the ultimate rotation from 0.075 rad in specimen US-0.38 to more than 0.189 rad in
325
specimen US-0.38-stud. The load capacity of specimen US-0.38-stud was 117.1 kN while the
326
maximum load in specimen US-0.38 was 101.6 kN. This 15% improvement in load capacity
327
is due to the effectiveness of shear studs in postponing the punching shear failure. In
328
specimens with higher reinforcement ratio (US-1.00 and US-1.00-stud), the employment of
329
studs considerably influenced the general behavior of the slabs: specimen US-1.00 failed
330
abruptly in punching after limited formation of hairline flexural cracks, while specimen
US-331
1.00-stud failed in a much more ductile manner since flexural steel bars were allowed to
332
reach higher strains, causing a plastic plateau in the load-rotation curve after which the
333
ultimate punching failure occurred. Accordingly, the failure load in US-1.00 and
US-1.00-334
stud was measured as 186.3 and 224.0 kN, respectively, showing an increase of 20%. It
335
should be noted that the increase in failure load due to the application of studs in the present
336
tests was relatively small when compared to tests available in the literature because the
337
maximum load carried by the specimens was limited by their flexural capacity, as discussed
338
in detail in Section 4. Ultimate rotation also increased from 0.035 rad in specimen US-1.00 to
339
0.1 rad in specimen US-1.00-stud as a result of using shear reinforcement.
340
4 Comparison of experimental results with CSCT
341
4.1 Peculiarities of thin lightly reinforced flat slabs
342
The specimens described in Section 3 are relatively thin. They are thinner than the specimens
343
described in Section 2.2 in publications with which CSCT was validated. Nevertheless, these
344
experimental results serve to check the applicability of the CSCT failure criterion and of the
345
load-rotation curve based on the CSCT assumptions for such extreme conditions.
346
When the slab is thin and lightly reinforced, it can deflect considerably before punching
347
failure, as it was observed in Section 3 for specimen US-0.38-studs. Due to the large slab
348
rotation, ψ, the strains in the longitudinal steel bars can become very large. The strain
19
hardening region of the stress-strain curve of the longitudinal reinforcement steel is therefore
350
expected to significantly influence the load-rotation curve of such specimens. The effect of
351
the post-yielding curve of the longitudinal reinforcement steel is further accentuated for the
352
specimens described in this paper by the fact that the longitudinal steel bars exhibited a
353
relatively short yielding plateau, as shown in Fig. 10. The influence of the post-yield behavior
354
of the longitudinal reinforcement steel in the flexural capacity as determined by a yield-line
355
analysis is demonstrated in Table 3.
356
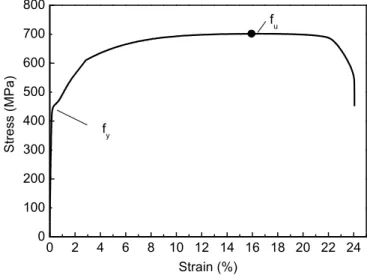
357
Fig. 10. Stress-strain relationship for the longitudinal steel bars used in the experimental
358
campaign
359
Table 3. Effect of strain hardening on the flexural capacity
360 Flexural reinforcement ratio (%) fy (MPa) fu (MPa) Vflex,y (kN) Vflex,u (kN) Vflex,u/Vflex,y 0.38 450 700 73.7 106.3 1.44 1.00 450 700 190.4 224.7 1.18 361
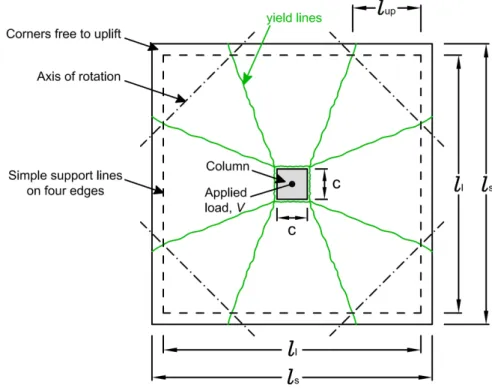
Fig. 11 illustrates the conditions of support and loading as well as the yield-line pattern in the
362
current study. In this figure, ls, ll, and c are the slab side length, the distance between the
363
supports and the column size, respectively. As shown in the figure, the slab corners are
364
permitted to lift by rotation about axes at 45 degrees. These conditions cause the formation of
365
circumferential yield lines around the column and diagonal yield lines intersecting the
366
support lines at a distance lup shown in Fig. 11[11, 32, 33]. Based on Elstner and Hognestad
367
[11], lup can be approximately estimated as (1-2/2)(ll–c). Accordingly, the value of lup would
368 0 2 4 6 8 10 12 14 16 18 20 22 24 0 100 200 300 400 500 600 700 800 fu Stres s (MP a) Strain (%) fy
20
be approximately 440 mm for the conditions in this study. Considering the slabs’ geometry,
369
this value is compatible with the deflection of the slab along its diagonal described in Section
370
3.2.1 and shown in Fig. 8. Further verification of the yield-line pattern is provided in Section
371
5.2.
372
373
Fig. 11. Support and loading conditions and yield-line pattern
374
In Table 3, the yield stress is denoted as fy. The ultimate steel stress, i.e., considering strain
375
hardening is denoted as fu. The flexural capacity Vflex,y is calculated assuming steel stress fy,
376
whereas the ultimate flexural capacity, Vflex,u is calculated assuming a compressive strain
377
equal to 0.38% for concrete and a nonlinear stress-strain curve for steel in accordance with
378
Fig. 10. The table shows that the ratio between Vflex,u and Vflex,y in the specimen with flexural
379
reinforcement ratio of 0.38% and 1.00% is 1.44 and 1.18, respectively. Table 3 reveals that
380
the influence of the post-yield behavior of steel in the flexural capacity is significant for both
381
cases but it is more significant for the specimens with low reinforcement ratio.
382
4.2 Moment-curvature relationships
383
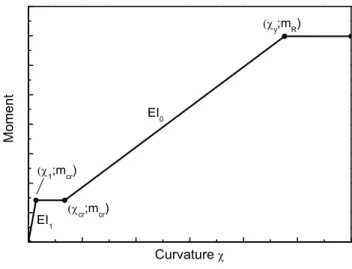
For simple cases, Muttoni [21] proposes the use of a quadrilinear moment-curvature
384
relationship for the slab section (Fig. 12, using symbols from Muttoni [21]), to be used in the
385
formulation of equilibrium equations for the construction of the load-rotation curve in
21
accordance with the assumptions of CSCT. For the reasons described in Section 4.1, the slab
387
load-rotation curve is expected to deviate significantly from the experimental one if the
post-388
yield stress-strain relationship of the longitudinal reinforcement steel is not taken into
389
account.
390
To account for the post-yield behavior of the longitudinal reinforcement steel, the
moment-391
curvature relationship of the slab section was constructed considering the actual stress-strain
392
relationship of steel from Fig. 10, simplified into a series of linear segments closely matching
393
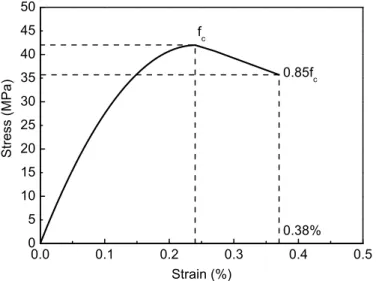
the original curve. The stress-strain relationship of concrete in compression was assumed to
394
be in accordance with the modified Hognestad’s model [34], as demonstrated in Fig. 13. For
395
concrete in tension, the stress-strain curve was assumed linear up to the tensile strength
396
(equal to 4.1 MPa). For larger tensile strains, cracking occurs and a linear softening branch
397
intersecting the strains axis at a strain equal to 0.001 is employed to reflect in an approximate
398
manner the tension-stiffening effect in cracked concrete.
399
400
Fig. 12. Simplified quadrilinear moment-curvature relationship
401 EI0 EI1 y;mR) 1;mcr) cr;mcr) Moment Curvature
22 402
Fig. 13. Adopted stress-strain relationship for concrete in compression according to modified
403
Hognestad’s model
404
The moment-curvature curve was constructed following a numerical approach based on force
405
equilibrium of a layered cross-section and strain compatibility, assuming that plane sections
406
remain plane after deformations (a linear strain profile). Since the material and geometrical
407
properties for slab specimens with the same longitudinal reinforcement ratio varied
408
insignificantly, the moment-curvature relationships are presented in Fig. 14 for only two slabs
409
(differing by the reinforcement ratio). The quadrilinear moment-curvature is plotted for
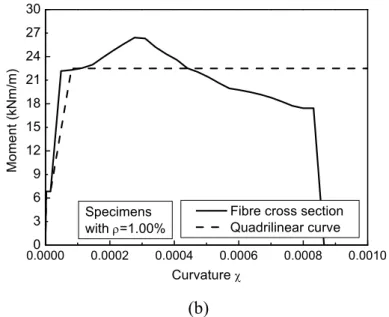
410 comparison. 411 412 (a) 413 0.0 0.1 0.2 0.3 0.4 0.5 0 5 10 15 20 25 30 35 40 45 50 0.38% 0.85fc fc St re ss ( MP a) Strain (%) 0.00000 0.0002 0.0004 0.0006 0.0008 0.0010 3 6 9 12 15 18 21 24 27 30
Fibre cross section Quadrilinear curve Mom ent (k N m/ m ) Curvature Specimens with =0.38%
23 414
(b)
415
Fig. 14. Moment-curvature relationships considering the real nonlinear stress-strain curve of
416
steel and simplified quadrilinear moment-curvatures; (a) specimens with ρ=0.38%; (b)
417
specimens with ρ=1.00%.
418
As previously demonstrated in Table 3, Fig. 14confirms that there is a significant increase of
419
the resisting bending moment of the slab beyond the yielding bending moment. The
moment-420
curvature relationships corresponding to the fiber cross-section approach are implemented
421
into the CSCT in the analyses that follow.
422
4.3 Radius of the slab for the purpose of implementing CSCT
423
For the implementation of CSCT, it is necessary to determine the radius rs of a circular slab
424
that has the same flexural resistance Vflex as the experimentally tested square slab [35].
425
However, since the flexural capacity of the slab is determined by the equilibrium of slab
426
sector elements and since the stress-strain relationships for concrete and steel are realistically
427
modelled (see Section 4.2), fixing the value of rs to have the same Vflex as the real slab
428
specimen becomes challenging. For this reason, several alternatives are tested, resulting in
429
different approaches for the consideration of the radius rs, as described below:
430
- full implementation of the analytical model, with the moment-curvature relationships
431
shown in Fig. 14 for fiber cross sections with steel and concrete in accordance with Fig.
432
10 and Fig. 13, respectively.
433 0.00000 0.0002 0.0004 0.0006 0.0008 0.0010 3 6 9 12 15 18 21 24 27 30
Fibre cross section Quadrilinear curve Mom ent (k N m/ m ) Curvature Specimens with =1.00%
24
- full implementation of the analytical model but with simplified quadrilinear
moment-434
curvature relationships as shown in Fig. 14, in accordance with Muttoni [21], using steel
435
yield stress fy in accordance with Fig. 10.
436
- simplified load-rotation relationship in accordance with Eq. (1), using Vflex = Vflex,u from
437
Table 3.
438
In the cases above, the radius is denoted as rsy when its calculation is based on Vflex,y and rsu
439
when calculated based on Vflex,u. To calculate the radius rs, the corresponding value of Vflex
440
presented in Table 3 is equated with the Vflex calculated assuming a fan yield line mechanism
441
of a circular slab with radius rs supported on a circular column [35]. The radius of the column
442
is taken equal to half the side dimension of the column’s cross section. For the calculation of
443
rs,u, the same approach is followed in a first tentative, but then a correction factor is applied to
444
the radius in order to obtain matching values of Vflex. This correction is necessary because the
445
value of the tangential moments varies along the radius of the slab sector elements when the
446
moment-curvatures from Fig. 14 with stress-strain curves from Fig. 10 and Fig. 13are used.
447
Considering a quadrilinear moment-curvature (Fig. 12), the radius resulted in rsy=1013 mm
448
for the specimens with longitudinal reinforcement ratio equal to 0.38%, whereas for the
449
specimens with 1.00% longitudinal reinforcement ratio the radius was rsy=1029 mm.
450
Calculating the moment capacity using the stress-strain curve of steel as described in Fig. 10
451
and concrete in accordance with Fig. 13, the radii resulted in rsu=1194 mm and rsu=1182 mm
452
for specimens with longitudinal reinforcement ratio equal to 0.38% and 1.00%, respectively.
453
Also, it is necessary to know the radius rq of the load application points. Using a similar test
454
setup, Gosav et al. [36] showed that the radius rq can be approximated by the radius of the
455
inscribed circle to the square formed by the support lines. For the test setup of Fig.5, the
456
radius is rq=1700/2=850 mm.
457
For the simplified version of CSCT represented by Eq. (1), it is necessary to determine only
458
rs, which is assumed equal to the radius of the zero moment line (equal to rq=850 mm in this
459
case). In Eq. (1), the value of Vflex is entered manually (i.e., it is not derived by the
460
equilibrium of sector elements) based on Table 3.
25
4.4 Results
462
The experimental results for specimens without shear reinforcement (US-0.38 and US-1.00)
463
are compared with the predictions of CSCT in Fig. 15. Fig. 16 shows the results of the
464
comparison between CSCT and the experiments for specimens with shear reinforcement
(US-465
0.38-stud and US-1.00-stud). As discussed in Section 4.3, the load-rotation curve is
466
constructed for several cases, considering different approaches for estimating the
moment-467
curvature and different values of the radius of the equivalent circular slab.
468
Due to the relatively high amount of punching shear reinforcement used in the experimental
469
campaign (Section 3), it was noticed that failure through the shear reinforcement is not
470
relevant for the specimens under consideration. The same is true even if the diameter of the
471
studs is reduced to account for the insufficient area of anchorage offered by the heads to
472
develop full yield of the studs. The failure criterion for this failure mode (constructed in
473
accordance with Ruiz and Muttoni [22]) is not shown in Fig. 16, for clarity of the figure,
474
because it lays above the range of plotted values of the shear force.
475
476
Fig. 15. Comparison of experimental results with CSCT for specimens without shear
477 reinforcement 478 0.00 0.05 0.10 0.15 0.20 0.25 0 25 50 75 100 125 150 175 200 225 250 0.00 0.05 0.10 0.15 0.20 0.25 0 25 50 75 100 125 150 175 200 225 250
Fibre section, rsy Fibre section, rsu Quadrilinear Simplified expression Experimental
S hea r fo rc e (k N )
Slab rotation (rad)
US-0.38 Failure criterion
(no shear reinf.)
Failure criterion (no shear reinf.)
US-1.00 Sh ea r fo rce (kN)
26 479
Fig. 16. Comparison of experimental results with CSCT for specimens with shear
480
reinforcement
481
The failure loads predicted by four versions of the load-rotation curve considered as well as
482
the experimental loads, Vexp, are summarized in Table 4.The failure loads calculated using a
483
fiber section with radius rsy and rsu are denoted as Vfiber,y and Vfiber,u respectively. The failure
484
load in case the quadrilinear moment-curvature is used is denoted as Vquadrilinear. When the
485
simplified approach is used, the failure load is denoted as Vsimplified.
486
Table 4. Failure loads based on CSCT for different approaches of constructing the
load-487
rotation curve
488
Specimen Vexp (kN) Vfiber,y (kN) Vfiber,u (kN) Vquadrilinear (kN) Vsimplified (kN)
US-0.38 101.6 84.0 95.3 73.7 106.3
US-0.38-stud 117.1 flexure* flexure* 73.7 106.3
US-1.00 186.3 170.9 178.1 160.8 177.1
US-1.00-stud 224.0 198.1 226.9 190.4 224.7
*Flexural failure detected prior to punching. Punching prediction is therefore not reliable.
489
4.4.1 Failure modes and failure criteria
490
Referring to the load-rotation curves determined experimentally (Fig. 15 and Fig. 16), it is
491
concluded that failure occurs reasonably close to the corresponding failure criteria of CSCT.
492
This means that, regardless of the approach used to construct the load-rotation curve, the
493
validity of the CSCT criteria is confirmed for the specimens under consideration. CSCT was
494 0.00 0.05 0.10 0.15 0.20 0.25 0 25 50 75 100 125 150 175 200 225 250 0.00 0.05 0.10 0.15 0.20 0.25 0 25 50 75 100 125 150 175 200 225 250 Approximately estimated rotation after exceeding the
measuring range Failure outside
shear reinf.
Concrete crushing
Fibre section, rsy Fibre section, rsu Quadrilinear Simplified expression, with rsu Experimental
Sh ea r forc e (k N )
Slab rotation (rad)
US-0.38-studs Failure outside shear reinforcement Concrete crushing US-1.00-studs Sh ea r fo rc e ( kN)
27
able to predict not only the ultimate loads but also the failure modes. According to Fig. 16,
495
the specimens with shear reinforcement are predicted to fail outside the shear reinforced
496
zone. This is the failure mode actually observed for these specimens (Section 3).
497
There is a slight underestimation by CSCT of the deformation capacity of the specimens with
498
shear reinforcement (Fig. 16). This is already acknowledged in Ruiz and Muttoni [22], where
499
it is argued that the failure criterion for failure outside the shear-reinforced zone adopts the
500
conservative assumption of slab rotation concentrated in the region outside the critical shear
501
crack (in this case, outside the shear-reinforced zone). The exact ultimate rotation of the
502
specimen US-0.38-stud was not measured during the experiment, but this does not affect the
503
discussion above. The ultimate rotation of this specimen was only marginally larger than the
504
last measured value.
505
The fact that the experimental load-rotation curve intersects the corresponding failure criteria
506
near the actual failure, means that, regardless of the discussions in the following section
507
regarding the analytical construction of the load-rotation curve, a detailed nonlinear finite
508
element analysis to construct the load-rotation curve of the slab can always be used in the
509
framework of CSCT, as permitted in fib Model Code 2010 [37] for Level IV of
510
Approximation. The following sections, however, shed light on limitations of the analytical
511
approach described in [21] when used to construct the load-rotation curve.
512
4.4.2 Load-rotation curves for slab radius rsy
513
Table 4 as well as Fig. 15 and Fig. 16 show that the predicted load-rotations curves for slab
514
radius rs,y for the specimens with 1.00% longitudinal reinforcement ratio are closer to the
515
experiment compared to those of the specimens with 0.38% reinforcement ratio. Comparing
516
the load-rotation curves constructed based on different approaches in Fig. 15 and Fig. 16, it is
517
noticed that modelling assumptions are more critical in the case of specimens US-0.38 and
518
US-0.38-stud. In these specimens (specimens with low flexural reinforcement), the
load-519
rotation curve constructed neglecting the post-yield behavior of the steel is relatively far from
520
the experimental result. In specimen US-0.38, the ultimate load is severely underestimated
521
(by nearly 27%) when the quadrilinear curvature is used. Even with the
moment-522
curvature constructed using a fiber section, there is an underestimation of the ultimate load by
523
approximately 17% when the radius is taken equal to rsy.
28
Referring to the lightly reinforced specimen with studs (US-0.38-stud), the ultimate load
525
remains underestimated (by nearly 37%) in case of a quadrilinear moment-curvature without
526
a strain hardening region of the steel reinforcement. More importantly, Fig. 16 shows that the
527
load-rotation curve is not captured well by the analytical models with the radius of the slab
528
equal to rsy. A flexural failure, resulting in a softening of the load-rotation curve, is detected
529
for a slab rotation considerably lower than the rotation corresponding to the intersection with
530
the failure criteria. Since the deformed shape of the slab may change after a flexural failure,
531
the assumption of a conical deflected shape of the slab outside the critical shear crack is no
532
longer valid, and the results are therefore not reliable after this point. It is important to notice
533
that such a failure was not detected during the experimental campaign.
534
Looking at the predictions for specimens US-1.00 and US-1.00-stud in Fig. 15 and Fig. 16, it
535
is noticed that the situation is different from that described for the specimens with lower
536
longitudinal reinforcement ratio (equal to 0.38%). The load-rotation curves corresponding to
537
different approaches (but with radius rs,y) are relatively close to each other and the behavior is
538
less depended on the assumptions related to steel’s stress-strain relationship. Neglecting the
539
post-yield behavior of steel while using the quadrilinear moment-curvature leads to an
540
underestimation of the ultimate load of about 14% in specimen US-1.00 and of about 15% in
541
specimen US-1.00-stud. The predictions are better (8% and 12% underestimation of the
542
ultimate load respectively) when the actual stress-strain curve of steel is used (refer to Table
543
4).
544
The initial branch of the load-rotation curve is predicted reasonably well when the
545
experimental stress-strain relationship of steel is used (Fig. 10). However, the analytical
546
curves and the experimental ones diverge for larger slab rotations when the radius is
547
maintained equal to rs,y.
548
For both levels of longitudinal reinforcement ratio, the curve corresponding to a simplified
549
quadrilinear moment-curvature relationship yields lower forces than the curve corresponding
550
to the exact moment-curvature relationship. This difference is expected to be smaller in
551
normally reinforced specimens when steel with a more pronounced yielding plateau is used
552
(unlike the steel shown in Fig. 10). Two specimens reported in Guandalini et al. [28] had a
553
longitudinal reinforcement ratio of 0.33% and thickness 250 mm, but one of the specimens
554
had steel without a clear yielding plateau. No significant difference was observed in the
29
behavior of the two specimens, indicating that the effect of the longitudinal reinforcement
556
steel post-yield behavior is more pronounced in thin lightly reinforced slabs.
557
4.4.3 Load-rotation curves for slab radius rsu
558
This section presents the analysis results assuming a hypothetical slab radius equal to rsu,
559
calculated on the basis of Vflex,u. Fig. 15 and Fig. 16 indicate that this approach is suitable for
560
the specimens under consideration. Using rsu leads to a load-rotation curve that is able to
561
track the entire experimental curve. However, the approach worked better for specimens with
562
1.00% longitudinal reinforcement ratio.
563
Table 4 shows that the predictions of the model considering a fiber section and slab radius rsu
564
result in ultimate loads that are closer to Vexp compared to alternatives assuming a radius rsy.
565
The failure load prediction was underestimated by 6% in specimen US-0.38, by only 4% in
566
specimen US-1.00 and it was slightly overestimated by nearly 1% in US-1.00-stud.In
567
specimen US-0.38-studs, a flexural failure before punching is predicted, the same as in case
568
of radius rs,y. Nonetheless, the predicted flexural failure is relatively close to the failure
569
criterion for punching outside the shear-reinforced zone.
570
Looking at the load-rotation curve corresponding to the simplified version of CSCT with
571
radius rs,u, it is noticed that it deviates significantly for specimens with low longitudinal
572
reinforcement ratio. On the other hand, it is reasonably close to the experimental curve in
573
specimens with 1.00% longitudinal reinforcement ratio. It should be noted that the effect of
574
post-yield stress-strain relationship of steel is already included in an approximate manner in
575
the simplified load-rotation curve through the use of Vflex,u in Eq. (1).
576
Although the failure loads predicted using the simplified approach are close to the
577
experimental loads (Table 4), this approach should be considered with caution in thin lightly
578
reinforced flat slabs because it does not follow the experimental curve closely for each value
579
of the slab’s rotation.
30
5 Further verifications and discussion
581
5.1 Re-examination of tests from the literature
582
In Section 4 it was shown that the approach to analytically construct the load-rotation curve
583
that is closer to the experimental results of the specimens presented in Section 3 is to consider
584
a radius of the slab equal to rs,u and to explicitly take into account the nonlinear behavior of
585
concrete and steel. Further verification of the assumptions employed in Section 4 with
586
specimens from the literature is not straightforward, because the information required is
587
seldom provided in the literature (i.e., the complete stress-strain curve of steel, slab rotations
588
as a function of the load, etc.).
589
Tests on thin and lightly reinforced flat slabs presented in Guandalini et al. [28] are
re-590
examined in this Section. For these specimens, it was possible to find relevant additional
591
information in [38]. Although a numerical model considering strain hardening was used in
592
[38] for the derivation of the analytical load-rotation curves, a direct comparison with a
593
model that neglects strain hardening was not found. As already mentioned in Section 2.2, the
594
thin lightly reinforced specimens of Guandalini et al. [28] are named PG-8 and PG-9. The
595
specimens of Guandalini et al. [28] had a ratio fu/fy equal to 1.12 and a clear yielding plateau
596
in the stress-strain curve of steel. In contrast, the specimens tested in the current study,
597
presented in Section 3, had a higher ratio fu/fy equal to 1.56 and a short yielding plateau of
598
steel (Fig. 10). Furthermore, the greater thickness in the specimens of Guandalini et al. [28]
599
means a less ductile behavior and less excursion into the post-yield region of the stress-strain
600
curve of steel. For all these reasons, the influence of the stress-strain relationship of steel is
601
expected to be milder in specimens of Guandalini et al. [28]. Fig. 17 presents a comparison of
602
the analytically derived load-rotation curves based on the approach described in Section 4 for
603
specimens PG-8 and PG-9. The strain at the onset of strain hardening and strain at steel
604
rupture was not found for specimens PG-8 and PG-9, but the information provided in [38] for
605
other specimens tested in the same experimental campaign was assumed to apply for these
606
two specimens as well.
31 608
Fig. 17. Role of steel stress-strain curve in specimens of Guandalini et al. [28]
609
Fig. 17 confirms that the stress-strain curve of steel does play a role in the analytical
610
derivation of the load-rotation curve for the specimens of Guandalini et al. [28], although
611
small and with a negligible effect on the load capacity prediction in this case. For the reasons
612
stated above, the behavior is not affected as much as in the case of specimens presented in
613
this paper in Section 3. The range of values in the axes in Fig. 17 was intentionally kept the
614
same as in Fig. 15 and Fig. 16. A comparison of Fig. 17 with Fig. 15 and Fig. 16 shows that
615
specimens US-0.38 and US-0.38-studs failed for larger slab rotations compared to PG-8 and
616
PG-9. This observation further indicates that the thinner the slab and the shorter the yielding
617
plateau of the steel, the more pronounced is the effect of the post-yield stress-strain curve of
618
steel.
619
5.2 Finite Element Analysis
620
A Finite Element Analysis (FEA) was conducted to further analyze the role of the
stress-621
strain curve of steel in thin lightly reinforced flat slabs. The analysis was conducted using the
622
commercial software ABAQUS [39]. A quarter of the specimen US-0.38 was modelled, as
623
demonstrated in Fig. 18, to benefit from the symmetrical conditions. Two versions of the
624
model were analyzed, with the only difference between them being the stress-strain curve of
625
steel used for the reinforcing bars.
626 0.00 0.05 0.10 0.15 0.20 0.25 0 25 50 75 100 125 150 175 200 225 250 0.00 0.05 0.10 0.15 0.20 0.25 0 25 50 75 100 125 150 175 200 225 250 Experimental strength
Fibre section, rsy Fibre section, rsu
S
hear forc
e (kN)
Slab rotation (rad)
PG-8 Failure criterion Failure criterion PG-9 Sh ear fo rce (k N )
Slab rotation (rad) Experimental strength
32 627
Fig. 18. Numerical model of the specimen US-0.38
628
The recommendations from Genikomsou and Polak [40] were followed closely since they
629
directly refer to the problem of punching shear in flat slabs. To model concrete, the Concrete
630
Damaged Plasticity (CDP) model was used, with a dilation angle equal to 40 degrees,
631
eccentricity 0.1, the ratio between biaxial and uniaxial concrete strength equal to 1.16 and a
632
shape factor of the yield surface equal to 0.667 [40]. The analysis was conducted under static
633
loading, with a viscosity parameter equal to 5×10⁻⁵. This parameter was chosen sufficiently
634
large to ensure convergence of the analysis when localized cracking occurs. This viscosity
635
regularization is at the expense of the accuracy of the determination of the punching shear
636
failure point [41]. For the purposes of this study, however, the main interest is on the effect of
637
steel’s stress-strain curve on the load-displacement curve, and the discussion is valid
638
regardless of the load level in which punching shear failure occurs. Tension and compression
639
damages were neglected because these factors are most relevant in cases of cyclic loading
640
[40, 41].
641
The uniaxial concrete and steel properties already described in Section 4 were used, with the
642
difference that the tensile behavior of concrete was modelled as described in [40], with the
643
fracture energy calculated in accordance with Model Code 2010 [37] and a tensile strength
644
reduced to 50% of the theoretical value to account for early cracking that occurred in the
645
specimen. This reduction of the tensile strength does not affect the post-yield load-rotation
646
curve. In one model, a hypothetical bilinear linear perfectly-plastic stress-strain curve of steel
33
with yield stress equal to fy was used, while maintaining all the other model parameters
648
unchanged.
649
The loading plate and the supports were modelled using steel elements with dimensions as in
650
the experimental test. Symmetry boundary conditions were imposed along the axes of
651
symmetry of the model (Fig. 18). A contact interaction was defined to accurately model the
652
support conditions of the slab, allowing uplift of the corners. The cylindrical supports were
653
substituted with prismatic supports with a small enough contact area to avoid large
654
concentration of stresses and no friction. The slab was modelled with brick elements (5
655
elements along the depth of the slab, resulting in finite elements with the size the same as in
656
[40]). The reinforcement bars were modelled as embedded truss elements with the perfect
657
bond. The choices above (e.g., regarding mesh size and energy of fracture) were based on a
658
series of preliminary analyses, keeping in mind the purpose and limitations of the presented
659
model as described earlier.
660
Fig. 19 demonstrates that the model worked as intended. The deformed shape of Fig. 19a for
661
a maximum deflection of 60 mm shows that the boundary conditions were modelled properly
662
because uplift of the corners of the specimen comparable with the experiment was detected
663
(Fig. 8). The crack pattern demonstrated in Fig. 19b matches reasonably well with the
664
flexural crack pattern observed during the test (Fig.9). More importantly, Fig. 19a and Fig.
665
19b support the assumed yield line pattern used throughout this study to calculate the flexural
666
capacity Vflex of the specimens (Fig. 11).
667
668
(a)