PUNCHING SHEAR ANALYSIS OF SLAB-COLUMN CONNECTIONS
CARLOS L. MORENO*AND ANA M. SARMENTO†
* Laboratory for the Concrete Technology and Structural Behaviour (LABEST)
Polytechnic Institute of Bragança, School of Technology and Management Campus de Santa Apolónia – Apartado 134, 5301-857 Bragança, Portugal
E-mail: [email protected]; webpage: http://www.fe.up.pt/labest
†
Laboratory for the Concrete Technology and Structural Behaviour (LABEST) University of Porto, Faculty of Engineering
Rua Dr. Roberto Frias, s/n, 4200-465 Porto, Portugal e-mail: [email protected]; webpage: http://www.fe.up.pt/labest
Key words: Punching shear, Fracture mechanics, Load eccentricity, Shear reinforcement.
Summary: In this study, numerical simulations of the experimental behaviour of reinforced concrete slabs tested under punching by the authors are presented. The capabilities and limitations of the numerical model to reproduce the brittle shear failure are discussed.
1 INTRODUCTION
Punching in slabs is usually associated with the application of concentrated loads or the presence of columns. One of the main problems of flat slabs is its punching shear capacity at slab-column connection, which is subjected to a very complex triaxial stress state. Punching failure is characterized by the development of a truncated cone shaped surface at the slab-column connection. This type of failure is usually both brittle and catastrophic and may generate the global collapse of the structure by increasing the load transfer to neighbouring columns.
In the experimental program carried out by the authors, high strength (HSC) concrete slabs (2.5×2.5×0.18 m), with and without shear reinforcement, are loaded through a central column and subjected to concentric and eccentric loading [1, 2]. Normal and steel fibre self-compacting concretes are used for the slab models. The effect of double-headed studs and of the steel fibres as shear reinforcement is also observed.
Numerical simulation of brittle shear behaviour as punching failure is complex and a great research effort has been made in the development of models to reproduce the behaviour of concrete flat slabs under punching. The accuracy and the reliability of these numerical models can be achieved by comparing them with data from experimental tests on properly instrumented real scale models.
(without taking care of symmetrical conditions) in order to account for the eccentrically applied loading.
The experimental behaviour of the slab-columns connections is successfully reproduced. The ultimate punching shear capacity shows, as well, good agreement with test data. The numerical brittle shear collapse is identified by the comparison between the critical stress state and the failure surface.
2 EXPERIMENTAL PROGRAMME 2.1 Specimens geometry
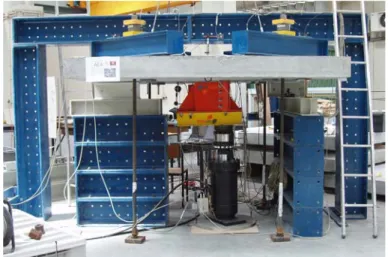
Six reinforced concrete flat slab models, 2500 mm square and 180 mm height, supported on eight points equally spaced on a 2165 mm diameter perimeter, were loaded through a central square concrete column 250 × 250 mm2 (Figure 1).
2.2 Test setup
A central load was applied on slabs AC0, FC0 and ACA1, and with the eccentricity of 200 mm (0.8 of the column side dimension) on slabs AE0, FE0 and AEA1. Eccentrically tests were carried out by using a steel adapter confining the column stub and by moving the actuator by a distance equal to the value of the specified eccentricity.
Figure 1: General overview of tests setup (eccentric test in photo)
Tests were performed with a servo-hydraulic test system by controlling the vertical displacement of the column under a constant displacement rate of 0.18 mm/min, so that the response after peak load is captured. A deformation-controlled hydraulic jack with a nominal range of 1000 kN was used. Tests were carried out at the Laboratory for the Concrete Technology and Structural Behaviour (LABEST) of the University of Porto.
2.3 Materials
is the used water proportion in order to maintain acceptable workability.
Cement CEM II\A 42.5R (c) 390
Fly ashes 110
Sand 1 (fine) 351
Sand 2 (coarse) 437
Gravel 897
Super-plasticiser (Sp) 7.5
Water (w) 157 (HSC) – 164 (SFRC)
Table 1: Concrete mix composition (kg/m3)
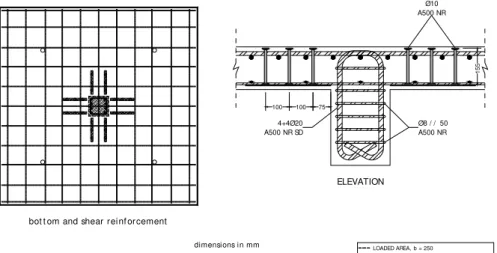
The bending reinforcement of slabs [3, 4] was: on the top (tensile) orthogonal reinforcement, 16 mm diameter (fy = 550 MPa; fu = 650 MPa; Es = 200 GPa), spaced 125
mm. The bars were folded up at both ends to promote better anchorage. The ratio of top flexural reinforcement was 1.17%. On the bottom (compressive) the flexural reinforcement was 8 mm bars (fy = 550 MPa) each direction spaced 250 mm. Concrete cover (c = 20 mm)
was assured by using concrete spacers. Figure 2 presents the details of flexural reinforcement. Shear reinforcement [3, 5] was used in two of the slabs, ACA1 and AEA1, comprising twenty four headed studs well anchored at their extremities and made with 10 mm diameter rebar (fyw = 500 MPa), placed in three perimeters perpendicularly to the column face, as
shown in Figure 2. The first perimeter of shear elements was placed at a distance of approximately half effective depth (d/2) from the column face.
dimensions in mm
Ø8 / / 50 A500 NR 4+4Ø20
A500 NR SD
bot t om and shear reinf orcement
ELEVATION
15
5
100 100 75
Ø10 A500 NR
LOADED AREA, b = 250
Figure 2: Details of flexural and shear reinforcement
Slabs FC0 and FE0 were casted with SFRC. The steel fibres are Dramix RC-65/60-BN with hooked ends (characteristics as defined by supplier: fyf = 1000 MPa, f = 0.90 mm, lf =
Slab
Age
(days)
Average specific weight
(kg/m3)
Modulus of elasticity
Ecm
(N/mm2)
Compressive strength
fcm,cil
(N/mm2)
Tensile strength
fct
(N/mm2)
AC0 71 56.1 3.78
ACA1 64 54.4 3.94
AE0 149 65.6 3.74
AEA1 142
2 255 31 550
66.2 4.53
FC0 79 39.3 3.49
FE0 73 2 291 29 500 36.9 3.50
Table 2: Concrete mechanical properties
2.4 Instrumentation
Measurements of concrete deformations and shear reinforcement strains were carried out. Loading was measured directly by a load cell, incorporated in the test system, and indirectly by the strains in the supporting rods by two resistance strain gauges glued to opposite sides of the bars (average value). Test data was automatically stored in a personal computer by a data acquisition system.
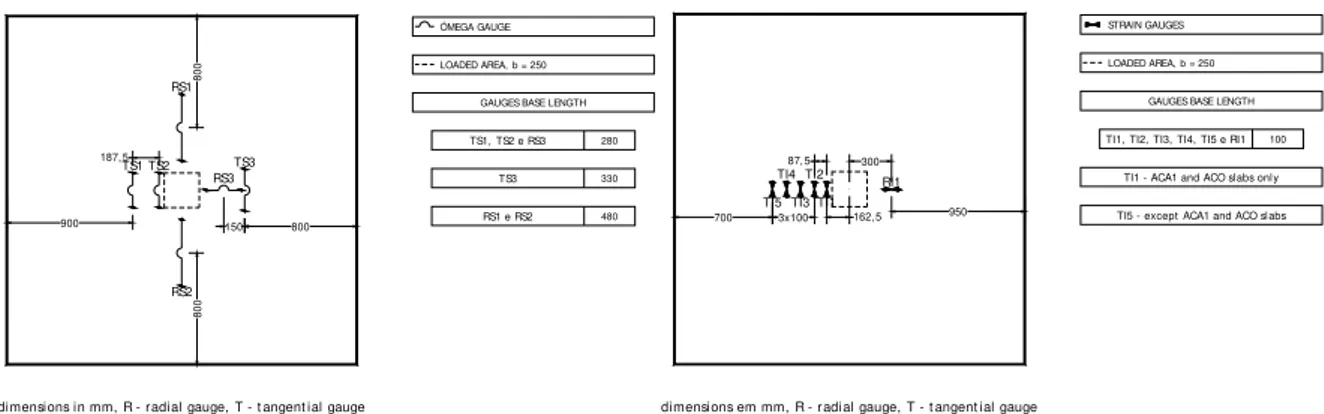
Concrete strains in radial and tangential directions were measured on the bottom (compression) side and on the top side (crack opening) of the slabs with electrical resistance gauges (Omega), fixed to the concrete surface at various distances from the column, see Figure 3. Gauge lengths of 100 mm were used for compression strain measurement; for tension (crack opening) strains gauge lengths are indicated in Figure 3 (left hand side). Strains in six of the shear studs were measured by strain gages, 8 mm length.
RS1 e RS2 480
TS3 330 280
TS1, TS2 e RS3
GAUGES BASE LENGTH
187,5
150 800 900
RS3 RS1
RS2
80
0
80
0
TS3 TS1 TS2
ÓMEGA GAUGE
LOADED AREA, b = 250
dimensions in mm, R - radial gauge, T - t angent ial gauge
TI5
87, 5
TI4 TI3
TI2 TI1
950 700
RI1
STRAIN GAUGES
100
TI1, TI2, TI3, TI4, TI5 e RI1
GAUGES BASE LENGTH LOADED AREA, b = 250
dimensions em mm, R - radial gauge, T - t angent ial gauge
3x100 TI5 - except ACA1 and ACO slabs TI1 - ACA1 and ACO slabs only 300
162,5
Figure 3: Location of the strain gauges on the top (left) and bottom (right) slabs’ concrete surface
1 st eel plat e 120x120x20 LVDT
1
LOADED AREA, b = 250 B - NEGATIVE MOMENT LIMIT, Ø = 2165
541,2 541,2 541,2
541,2
dimensions in mm
E2 I2 C I1 E1
Figure 4: LVDT’s location
3 NUMERICAL SIMULATION OF PUNCHING TESTS 3.1 Introduction
The quality of the results obtained by a nonlinear analysis is strongly influenced by the experience of the user who must choose appropriate iterative process, convergence criterion and crack model. Also, problems related to shear and punching are complex and sensitive to the iterative method, the increment size and the tolerance used for convergence: the solution quickly diverges when very tight tolerances are adopted; however for wide tolerances a poor reliability of the numerical solution may be expected.
Performance of a numerical model can be assessed by comparing FEM results with known experimental tests properly instrumented. In this study the capability of DIANA [10] software to simulate the punching behaviour of the tested slabs is discussed.
3.2 Element type and mesh
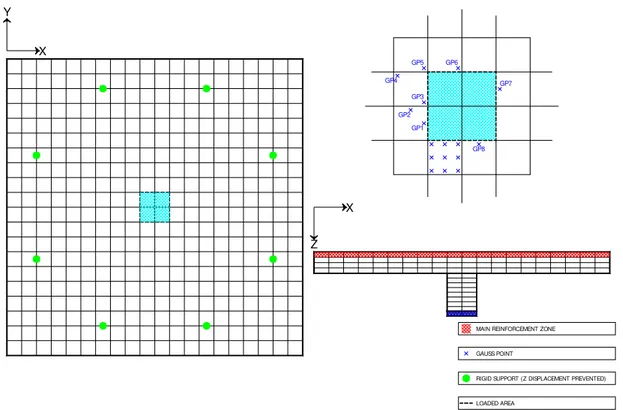
The slab models were discretized in 1600 20 nodded isoparametric solid elements, each element divided in four horizontal layers of equal thickness 18/4 (slab thickness equal to 18 cm). Quadratic interpolation with reduced 3 3 2 integration Gauss rule was adopted.
Finite elements’ meshing was carried out automatically from the geometry of the slabs. In the three lower layers (Figure 5) the crack bandwidth, h, is related to the size of the finite element mesh by:
3V n
h el (1)
being, Vel - finite element volume; n - number of Gauss points of finite element.
The crack bandwidth is considered to be equal to the edge size of the cube with the same volume as the one associated with each Gauss point of the finite element.
LOADED AREA
RIGID SUPPORT (Z DISPLACEMENT PREVENTED)
Y
X
Z X
MAIN REINFORCEMENT ZONE
GAUSS POINT
GP1 GP2 GP4
GP5
GP3 GP6
GP7
GP8
Figure 5: Geometry, mesh with location of Gauss points, load and support conditions
3.3 Formulation
Nonlinear tensile behaviour of cracked concrete is modelled by using two available formulations: the smeared crack model based on both the concept of strain decomposition (SD) and the total strain with fixed orthogonal cracks (TSF). Different behaviours were observed as shown above.
The convergence criteria is formulated in terms of energy with tolerance = 1 10-4, allowing the analysis to continue in the occurrence of a non converged increment. For the SD based analysis, the employed iterative method is the Secant method (BFGS); for TSF analysis the algorithm that minimizes the iterative calculation time has shown to be the modified Newton-Raphson method.
Shear reinforcement and concrete strains (top and bottom faces) are compared with those obtained by numerical analysis in the corresponding Gauss points.
In the SD concept based analysis the values 0 = 35º, 0 = 12.5º and = 60º were taken for
the internal friction angle, dilatancy angle and the limit value of the threshold angle, respectively. The Poisson's ratio of concrete was taken = 0.20 together with the linear tension cut-off criteria.
TSF based analysis does not correctly take in account the decrease of elastic strains with the decrease of orthogonal strains as a constant value is adopted for Poisson's coefficient, , even for cracked concrete. Consequently the value = 0 was assumed in the analysis.
All the results presented below correspond to converged increments, unless otherwise indicated.
3.4 Numerical simulations
In a first SD numerical analysis the bond between concrete and longitudinal reinforcement was indirectly modelled by applying the tension stiffening concept to the concrete layer comprising the flexural reinforcement (red elements in Figure 5). Linear tension softening is considered in the remaining 3 layers, along with fracture mode I, GF, according to CEB -FIP
MC 90 [11], as shown in Table 3. Due to cracking the concrete shear stiffness is usually reduced. This remaining stiffness is quantified by the shear retention factor, SD. In the
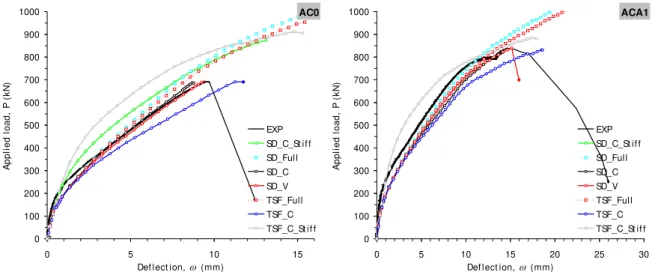
simulation the value SD = 0.100 was adopted. The obtained load-deflection curves
(SD_C_Stiff) are consistently stiffer than the experimental response (Figure 6). For the same load the modelled behaviour presents lower deflections than those experimentally observed.
Similar results were obtained for a second analysis carried out using the TSF cracking model (TSF_C_Stiff curves in Figure 6) which may be justified by the slow degradation of available energy on cracks.
Other analyses were then conducted neglecting the contribution of concrete between cracks in top layer, maintaining the above referred softening law in the lower layers, and enforcing a full shear stiffness retention, SD = TSF = 1.0, to the entire slab (SD_Full and TSF_Full
curves in Figure 6). The numerical approximation to the experimental response is then enhanced but still it was not possible to identify numerical evidence of failure.
0 100 200 300 400 500 600 700 800 900 1000
0 5 10 15
Def lect ion, (mm)
A p p li e d l o ad , P ( kN ) EXP SD_C_St if f SD_Full SD_C SD_V TSF_Full TSF_C TSF_C_St if f
AC0 0 100 200 300 400 500 600 700 800 900 1000
0 5 10 15 20 25 30
Def lect ion, (mm)
A p p li e d l o ad , P ( kN ) EXP SD_C_St if f SD_Full SD_C SD_V TSF_Full TSF_C TSF_C_St if f
ACA1
Figure 6: Comparison between experimental and numerical load-deflection responses
As known, an accurate simulation of structures failing in shear is extremely difficult to achieve. In punching failure, the deformation characteristics in the cracked region and the generated shear stresses must be precisely defined. Also, the interaction between parameters as the crack normal strain εnncr, characterized by mode I, and the crack distortion, cr,
associated to fracture modes II and III must be accounted for. Such interaction is not always taken into consideration in most computer codes, as is the case of DIANA. Therefore, the influence of shear retention model should appear of utmost importance. The accuracy of the simulations of punching shear behaviour is strongly influenced by the value of the shear retention factor (), which appears to be the main accuracy determining parameter.
Several authors sustain that when failure is dominated by fracture mode I the influence of the value of is irrelevant. However, for failures evolving simultaneous I and II fracture modes, as for flat slabs failing in punching, the numerical response is strongly dependent on the function that defines the cracked concrete shear stiffness [12, 13].
Consequently, further simulations (SD and TSF cracking models) were conducted using different values of which were successively adjusted in order to optimize the concordance between numerical and experimental behaviour. The values of constant, which provided the best estimation for the different simulations (SD e TSF), are showed in Table 3. It is
important to note that this was the only parameter subjected to successive iteration trough the numerical analysis. The corresponding obtained load-deflection responses are also presented in Figure 6, referenced as SD_C and TSF_C. For these simulations, the different values indicated in Table 3 can be justified by the following expression:
SD SD
TSF
1 (2)
Furthermore, SD cracking model simulations were improved by the inclusion of a user supplied subroutine that allows the variation of retention factor according to the Pruijssers variable shear stiffness law [14]. These simulations also produced accurate results. As can be seen in Figure 6, the structural behaviour of the different slabs was correctly reproduced. The convergence with the experimental response was achieved solely by successive variations of the parameter (see Table 3).
SD_C SD_V TSF_C Slab GF
(Nm/m2) Pu,exp
(kN)
SD
(%)
Pu,num/Pu,exp
(-)
Pruijssers
(-)
Pu,num/Pu,exp
(-)
TSF
(%)
Pu,num/Pu,exp
(-)
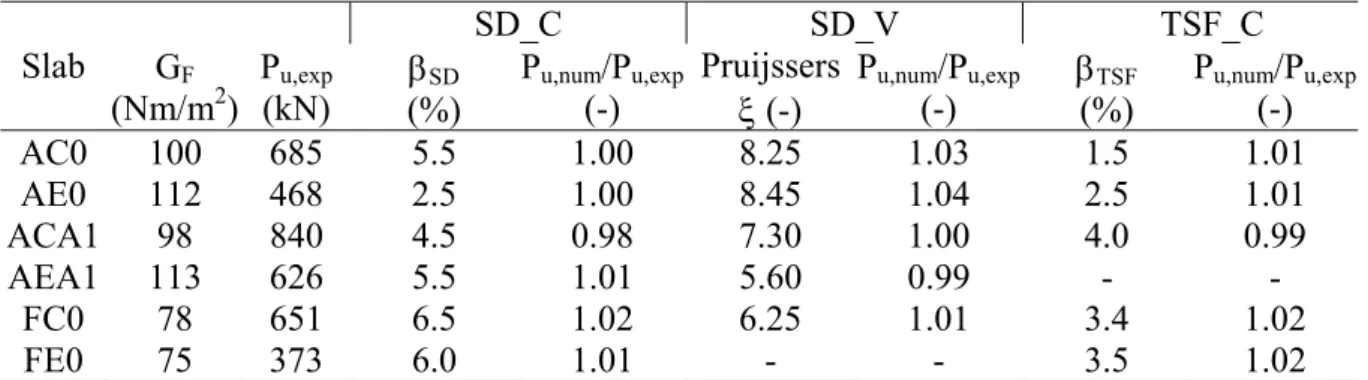
AC0 100 685 5.5 1.00 8.25 1.03 1.5 1.01
AE0 112 468 2.5 1.00 8.45 1.04 2.5 1.01
ACA1 98 840 4.5 0.98 7.30 1.00 4.0 0.99
AEA1 113 626 5.5 1.01 5.60 0.99 - -
FC0 78 651 6.5 1.02 6.25 1.01 3.4 1.02
FE0 75 373 6.0 1.01 - - 3.5 1.02
Table 3: Values of main parameters used in the numerical simulations
non-converged displacement increment. In fact, for those analyses, it was not possible to reach convergence beyond that increment even when the increments size was reduced. It should be noted that the numerical failure - no converged iterative procedure - may not correspond to the experimental collapse of the structure.
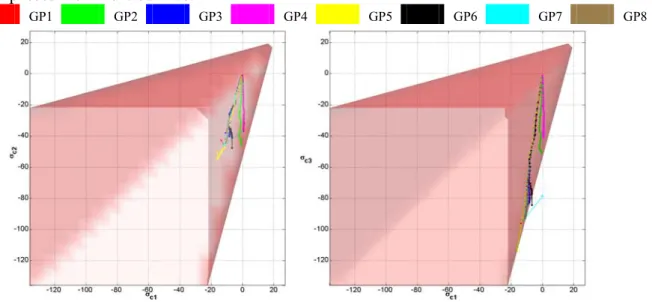
In order to verify the correspondence between the numerical and experimental failure, the comparison of the stress state of the Gauss points located on the concrete bottom layer (see Figure 5) with the associated failure surface was performed. Figure 7 illustrates the obtained result for the SD_V analysis of ACA1 slab.
The bottom layer from the eight layers of Gauss points distributed in the slab thickness, (Figure 5) is considered for comparison as major compressive stresses are located near the slab to column connection. As shown, for the load increment corresponding to the numerical failure, the stress state of several Gauss points presenting an important softening behaviour overpasses the failure surface.
GP1 GP2 GP3 GP4 GP5 GP6 GP7 GP8
Figure 7: Gauss points stress state evolution (ACA1 slab, SD_V analysis)
By the variation of the principal stresses orientation for ultimate load, crossing the failure surface, it can be confirmed that the punching failure is well captured by the numerical analysis.
The identification of numerical shear failures is mainly achieved by the crack pattern as well as by the concrete softening diagram at the slab-column edge.
4 COMPARISON OF NUMERICAL AND EXPERIMENTAL RESULTS 4.1 Crack pattern
a) Cracking pattern with normal crack opening vectors (50 ) b) Experimental cracking pattern
c) Slab deformed shape (10 ) at numerical ultimate load d) Slab incremental deformed shape (300 ) at numerical ultimate load
Figure 8: Comparison between numerical and experimental results (ACA1 slab, SD_V analysis)
4.2 Concrete tensile strains
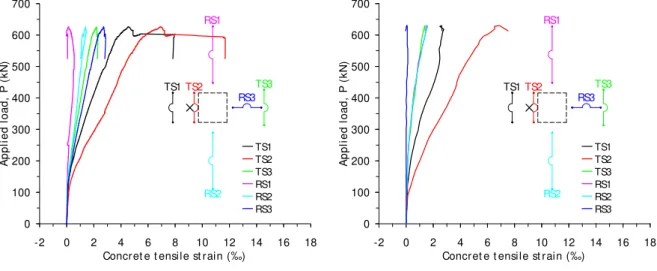
Figure 9 shows the evolution of concrete tensile strains with applied load P both for experimental and numerical results, on tangential (T) and radial (R) directions.
0 100 200 300 400 500 600 700
-2 0 2 4 6 8 10 12 14 16 18 Concret e t ensile st rain (‰)
A
p
p
li
e
d
l
o
ad
,
P
(
kN
)
TS1 TS2 TS3 RS1 RS2 RS3 RS3
RS1
RS2
TS3
TS1TS2
0 100 200 300 400 500 600 700
-2 0 2 4 6 8 10 12 14 16 18 Concret e t ensile st rain (‰)
A
p
p
li
e
d
l
o
ad
,
P
(
kN
)
TS1 TS2 TS3 RS1 RS2 RS3 RS3
RS1
RS2
TS3
TS1TS2
a) Experimental b) Numerical
4.3 Concrete compressive strains
The evolution of concrete compressive strains (bottom face) with applied load P both for experimental and numerical results can be observed in Figure 10.
0 100 200 300 400 500
-5.0 -4. 0 -3. 0 -2. 0 -1. 0 0. 0 Concret e compressive st rain (‰)
A p p li e d l o ad , P ( kN ) TI2 TI3 TI4 TI5 RI1 RI1 TI2 TI3 TI4 TI5 0 100 200 300 400 500
-5.0 -4. 0 -3. 0 -2. 0 -1. 0 0. 0 Concret e compressive st rain (‰)
A p p li e d l o ad , P ( kN ) TI2 TI3 TI4 TI5 RI1 RI1 TI2 TI3 TI4 TI5
a) Experimental b) Numerical
Figure 10: Comparison between numerical and experimental compressive concrete strains (AE0 slab, TSF_C analysis)
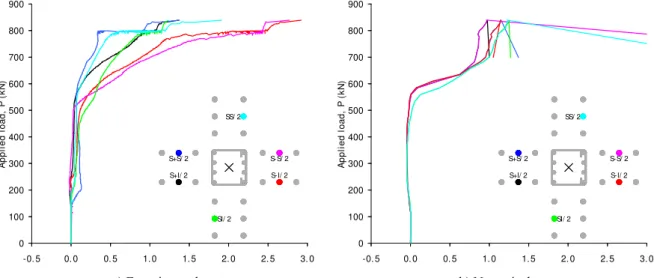
4.4 Shear reinforcement strains
Shear reinforcement strains evolution with increasing applied load can be observed in Figure 11. 0 100 200 300 400 500 600 700 800 900
-0. 5 0. 0 0. 5 1.0 1.5 2. 0 2. 5 3. 0
A p p li e d l oa d , P ( kN ) S+S/ 2
S+I/ 2 S-I/ 2
S-S/ 2 SS/ 2 SI/ 2 0 100 200 300 400 500 600 700 800 900
-0. 5 0. 0 0. 5 1.0 1.5 2. 0 2. 5 3. 0
A p p li e d l oa d , P ( kN ) S+S/ 2
S+I/ 2 S-I/ 2
S-S/ 2 SS/ 2
SI/ 2
a) Experimental b) Numerical
Figure 11: Comparison between numerical and experimental shear reinforcement strains (ACA1 slab, SD_V)
2.5 ‰, which corresponds to a 500 MPa steel stress. This value is however higher than the corresponding design value suggested by several codes [11, 15]. The values of the shear reinforcement strains measured in the punching tests show a good accordance with the obtained by those numerical modelling.
5 CONCLUSIONS
An extensive experimental program on real scale flat slab models under shear punching was carried out in order to assess the influence of load eccentricity and the contribution of shear reinforcement to the punching resistance and failure mechanism.
The behaviour of tested slabs was simulated by a non linear analysis performed with software DIANA. The smeared crack model based on both the concept of strain decomposition (SD) and total strain with fixed orthogonal cracks (TSF) was used for the analysis.
The comparison between experimental and numerical results leads to the following conclusions:
The indirect simulation of bond between concrete and reinforcement by using the tension retention concept revealed an excessive rigid structural behaviour. This could be due to the dissipation mechanism of available energy along cracks. Results demonstrate that the mechanical properties assigned to the element layer containing the bending reinforcement impose the load deflection stiffness behaviour.
Good agreement was found between the predicted and the observed deformation behaviour. Nevertheless, the reproduction of the punching ultimate capacity is strongly dependent from the value adopted for the retention factor (), which appears to be the major decisive parameter. The capture of experimental failures was obtained by successive adjustments of this parameter.
Among the different numerical analysis the best agreement was obtained with the model in which the value of varies according to the Pruijssers variable shear stiffness law.
The values of the concrete and shear reinforcement strains measured in the punching tests show a good accordance with the ones obtained by the numerical modelling. The experimental crack pattern could also be reproduced.
REFERENCES
[1] Moreno, C.; Sarmento, A.M. - Punching Shear in Eccentrically Loaded Flat Slabs, CCC2008 International Conference - Challenges for Civil Construction 2008 - “Bridge Science and Applications with Engineering Towards Innovative Solutions for Construction". 2008, A. Torres Marques: Porto. p. 12 (Abstract: 140-141).
[2] Moreno, C. - Lajes Fungiformes. Contribuições para a Compreensão do seu Comportamento., Departamento de Engenharia Civil. 2010, Faculdade de Engenharia da Universidade do Porto: Porto. p. 220.
[4] LNEC - E 460-2002 - Especificação LNEC - Varões de aço A500 NR de ductilidade especial para armaduras de betão armado - características, ensaios e marcação. 2002, LNEC: Lisboa.
[5] ITeC - Documento de adecuación al uso. 2006, Institut de Tecnologia de la Construcció de Catalunya: Barcelona. p. 40.
[6] IPQ - Norma Portuguesa Definitiva NP EN 12390-7: Ensaios do betão endurecido - Parte 7: Massa volúmica do betão endurecido. 2003.
[7] IPQ - Norma Portuguesa Definitiva NP EN 12390-3: Ensaios do betão endurecido - Parte 3: Resistência à compressão dos provetes de ensaio. 2003.
[8] IPQ - Norma Portuguesa Definitiva NP EN 12390-6: Ensaios do betão endurecido - Parte 6: Resistência à tracção por compressão de provetes. 2003.
[9] LNEC - E 397-1993 - Especificação LNEC - BETÕES - determinação do módulo de elasticidade em compressão. 1993, LNEC: Lisboa.
[10] DIANA - Finite Element Analysis - Release 9.3, D.o.C. Research, Editor. 2008, TNO Diana BV: Delft, The Netherlands.
[11] CEB-FIP - Model Code 1990, Comité Euro-International du Béton. 1993, Thomas Telford Services Ltd: Lausanne. p. 437.
[12] Barros, J.A.O.d. - Comportamento do Betão Reforçado com Fibras - Análise Experimental e Modelação Numérica. 1995, Faculdade de Engenharia da Universidade do Porto: Porto.
[13] Frénaij, J.W.I.J. - Time-dependent Shear Transfer in Cracked Reinforced Concrete. 1989, Delft University of Technology: Delft, The Netherlands. p. 183.
[14] Pruijssers, A.F. - Aggregate interlock and dowel action under monotonic and cyclic loading. 1988, Delft University of Technology: Delft, The Netherlands. p. 165.