Aspects of Finite Element Modeling of Punching Shear Behavior of
Reinforced Concrete Flat Slabs
Abstract
A series of nonlinear FE analyses was conducted in this paper to model the punching shear failure of RC flat slabs. The analyses were carried out in the soft-ware DIANA using three-dimensional continuum elements. These analyses in-volve the test of different modeling choices in order to evaluate their influences on punching shear failure modeling. The parameters examined are the size of the FE mesh, the convergence methods and the concrete material input parameters. These parameters were investigated by comparing the results of load carrying capacity, load-deflection response and crack patterns from the FE analyses with a reliable experimental test. From the results obtained, it could be concluded that the numerical model was able to reproduce accurately the behavior of the tested slab and capture the punching shear failure.
Keywords
Punching Shear; Flat Slabs; Numerical Modeling; Reinforced Concrete.
1 INTRODUCTION
Punching shear failure is a complex phenomenon that occurs in reinforced concrete flat slab as a consequence of the stress concentration on slab-column region. A large number of experimental tests and analytical studies have been con-ducted on the last decades in order to determine the parameters that influence the punching shear behavior. Also, several models have been proposed, e.g. Kinnunen and Nylander (1960), Moe (1961), Nielsen and Braestrup (1976), Shehata (1990), Menétrey (1995) and more recently the Critical Shear Crack Theory (CSCT) proposed by Muttoni (2008). How-ever, there is a still discussion about which one is the most accurately approach for the design of flat slabs. Besides, most of the design codes recommendation related to punching shear are based on empirical methods, e.g. Eurocode 2 (2004), ACI 318-14 (American Concrete Institute, 2014), and provided different methods that may differ significantly.
On the other hand, with the development of computational facilities, nonlinear finite element analysis (NLFEA) have become an interesting alternative for the assessment of concrete structures. These analyses may account nonlinear behav-iors as concrete cracking and reinforcement yielding. Also, numerical parameter studies can be conducted to study the sensibility of each variable. In the case of modeling RC-flat slab, different investigations have been conducted. Early numerical studies implemented two-dimensional (2D) models using axisymmetric elements, e.g. Hallgreen (1996) and Menétrey (1995) for modeling circular slabs with ring reinforcement. However, this same approach was not suitable for slabs with orthogonal reinforcement. For that reason, tridimensional elements were adopted by other authors in order to represent in a more realistic way the punching shear behavior, e.g. Mamede et al. (2012), Belletti et al. (2015) and Shu et al. (2016). Those mentioned works have in common the use of the Smeared Crack approach for take into account the concrete cracking. The mean feature of this model is that the cracked concrete is assumed to remain as continuum material and the mechanical properties are modified to account for the effect of cracking, according to the evolving states of strain and stress (Cervera and Chiumenti, 2006).
Despite of all the numerical investigations, modeling shear failure modes in slabs elements is still a challenging task using NLFEA models, mainly because of the lack of a general methodology and the quantity of input parameters. Few
Rafael A. Sanabria D.a*
Leonardo H. B. de Oliveiraa,b*
Leandro Mouta Trautweina
Luiz Carlos de Almeidaa
Antônio Carlos dos Santosc
a Faculdade de Engenharia Civil, Arquitetura e Urbanismo, Universidade Estadual de Campinas - UNICAMP, Campinas, São Paulo, Brazil. E-mail: [email protected], [email protected], [email protected], [email protected]
b
Universidade Federal Rural do Semi-Árido – UFERSA, Pau dos Ferros, Rio Grande do Norte, Brazil.
c Faculdade de Engenharia Civil, Universidade Federal de Uberlândia – UFU, Uberlândia, Minas Gerais, Brazil. E-mail: [email protected]
*Corresponding authors
http://dx.doi.org/10.1590/1679-78255004
guidelines about nonlinear finite element modeling can be found in the literature (fib-Bulletin 45 (CEB-FIP, 2007), Hen-driks et al. (2016)) but no one deals with the particular case of punching shear in flat slabs. Recently, Shu (2017) presented a “Multi-level Assessment Strategy” aiming to predict the punching shear behavior. This study included the evaluation of different modeling alternatives, involving meshing and input material parameters.
In this paper, a series of NLFEA were carried out in order to development a methodology for assess punching shear capacity in slab-column connection. It was selected a slab without shear reinforcement tested by Ramos (2003). Different model alternatives were analyzed, including meshing, input material parameters and also convergence techniques. The obtained results and the comparison with the experimental ones allowed to evaluate the accuracy of the development methodology.
2 EXPERIMENTAL MODEL
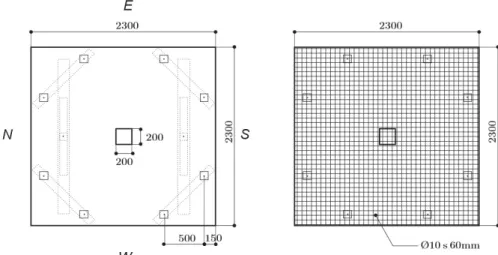
The studied flat slab was tested by Ramos (2003) and it had dimensions of 2300×2300×100 mm, supported by 8 steel plates with 100×100×50 mm and a square column of 200×200 mm located in its center. According to the nomenclature used by Ramos (2003), the slab was named AR2. The flexural reinforcement on the tension face of the slab was provided by 10 mm diameter steel bars in each direction with a spacing of 60 mm. The average yield strength was 639 MPa and the effective depth was 80 mm (𝜌 = 0.0169). On the compression face, the reinforcement was provided by 80 mm with a spacing of 200 mm approximately. The average value of concrete strength was measured using cube specimens. For this slab, the concrete strength was 48.9 MPa and the cylinder compression strength was considered of 80% of that value (𝑓 = 39.1MPa). Figure 1 illustrates the studied slab in this paper. Full details of the reference model could be found in Ramos (2003).
During the test the displacement on the top surface of the slab were measured using LVDT’s. Also, the deformation of the bars close to the column was measured. The cracking pattern was monitored at the top of the slab. The slab had a punching shear failure with an ultimate load of 258 kN.
Figure 1: Dimensions and rebar layout of the experimental slabs. Adapted from Ramos (2003).
3 FINITE ELEMENT MODELING
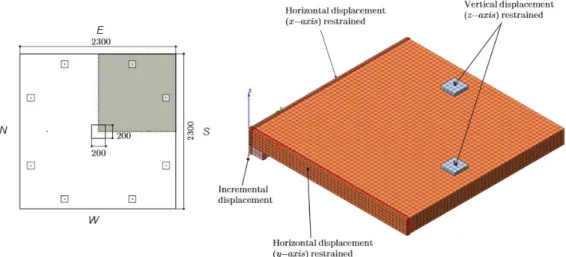
Figure 2. Typical mesh of the model with the boundaries conditions.
The bars were modeled using standard reinforcement embedded elements, which does not take into account the dowel effect and perfect bond between concrete and bars is assumed. The constitutive behavior of reinforcement is modeled using an elasto-plastic stress strain relationship without hardening. Finally, the loading was applied using an incremental dis-placement control through the central steel plate.
3.1 Baseline analysis
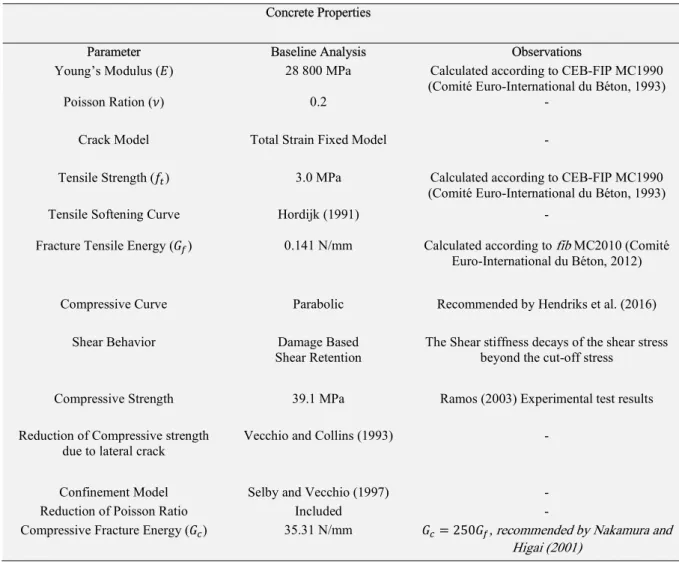
Table 1: Baseline materials input parameters. Concrete Properties
Parameter Baseline Analysis Observations
Young’s Modulus (𝐸) 28 800 MPa Calculated according to CEB-FIP MC1990
(Comité Euro-International du Béton, 1993)
Poisson Ration (𝜈) 0.2 -
Crack Model Total Strain Fixed Model -
Tensile Strength (𝑓) 3.0 MPa Calculated according to CEB-FIP MC1990
(Comité Euro-International du Béton, 1993)
Tensile Softening Curve Hordijk (1991) -
Fracture Tensile Energy (𝐺) 0.141 N/mm Calculated according to fib MC2010 (Comité Euro-International du Béton, 2012)
Compressive Curve Parabolic Recommended by Hendriks et al. (2016)
Shear Behavior Damage Based
Shear Retention The Shear stiffness decays of the shear stress beyond the cut-off stress
Compressive Strength 39.1 MPa Ramos (2003) Experimental test results
Reduction of Compressive strength due to lateral crack
Vecchio and Collins (1993) -
Confinement Model Selby and Vecchio (1997) -
Reduction of Poisson Ratio Included -
Compressive Fracture Energy (𝐺) 35.31 N/mm 𝐺 = 250𝐺 , recommended by Nakamura and
Higai (2001)
Table 2: Baseline convergence parameters
Convergence Parameters
Parameter Baseline Analysis Observations
Iteration Solution Procedure Quasi-Newton (Secant)-BFGS -
Maximum Number of Iteration per step 200 -
Incremental-iterative Procedure Displacement Control -
Loading incremental step size 0.2 mm -
Convergence Criteria Displacement Norm (0.01) Force Norm (0.01) Energy Norm (0.001)
Default Values of the Software
Line Search Technique Included Recommended for improving the conver-gence rate of iteratives procedure
The following sections will discuss the influence of each parameters analyzed in this work.
4 MESH DISCRETIZATION
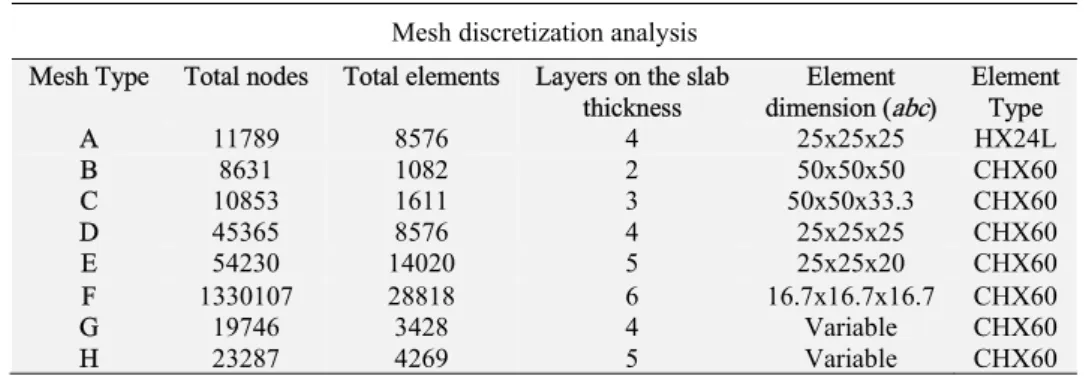
3. The Figure 3 illustrates the HX24L and CHX60 used in the mesh of the numerical models. The concrete material and convergence parameters were the same presented in the Tables 1 and 2.
Table 3: Mesh configurations and their properties. The nomenclature used for the element dimension (abc) is illustrated in the Figure 3
Mesh discretization analysis Mesh Type Total nodes Total elements Layers on the slab
thickness
Element dimension (abc)
Element Type
A 11789 8576 4 25x25x25 HX24L
B 8631 1082 2 50x50x50 CHX60
C 10853 1611 3 50x50x33.3 CHX60
D 45365 8576 4 25x25x25 CHX60
E 54230 14020 5 25x25x20 CHX60
F G H 1330107 19746 23287 28818 3428 4269 6 4 5 16.7x16.7x16.7 Variable Variable CHX60 CHX60 CHX60
Figure 3. Finite element types and nomenclature used in Table 3.
The Figure 4 shows the comparison of load-displacement curves from the meshes A to F. The mesh type A analysis was performed in order to investigate the influence of the element selection. In this case, the HX24L (eight nodes brick element) was selected. The predicted load obtained was 209.374 kN (0.81P , where 𝑃 is the load-carrying capacity of the experimental test by Ramos, 2003). The load-displacement curves for the Mesh A and D are shown in the Figure 4a. The behavior of both curves is similar, however the Mesh A response did not reach convergence after 14.5 mm. In addition, the crack pattern was less clear in comparison with other analyses in which were selected the CHX60 element (see Figure 5). Due to the poor results obtained, the HX24L element was dismissed for the others analyses.
The analysis of meshes B to F were carry out to study the relation between the mesh density and accuracy of the numerical solution. The idea was to prove that upon a certain mesh refinement, the structural response remains the same. A course mesh size was proposed with only two layers of elements on the slab thickness (Mesh B). The number of elements was gradually increased until obtain the finest mesh (Type F, see Table 3). The Figure 6 shows the comparison between mentioned meshes.
Figure 5. Comparison of crack pattern (principal tensile strain 𝜀 ) obtained from the mesh A (left) and mesh D (right) models, both meshes had the same size but different type of element.
Figure 6. Discretization of a) coarse mesh B and b) fine mesh F.
Table 4: Results obtained from the Meshes B to F varying the element size.
Mesh discretization size analysis Mesh Type Layers on the slab thickness Elapsed time Peak Load
(kN) (kN) 𝚫P
Displacement at Peak Load (mm)
B 2 00:22:14 190.35 - 13.6
C 3 00:25:47 214.70 24.35 14.4
D E F
4 5 6
01:32:58 02:20:00 26:27:00
243.45 261.29 268.22
28.75 17.85 6.92
19.8 22.2 23.6
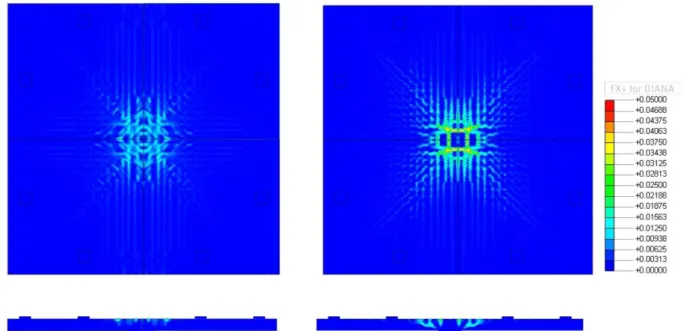
The crack pattern obtained from the meshes B and F are show in the Figure 7. As expected, the coarse mesh has a less clear pattern, however it was possible to see the punching cone failure at the last convergence step at the mid cut section. The crack pattern obtained from the Mesh F allows differentiate the tangential and radial cracks on the top surface of the slab.
The last study related to mesh discretization was conducted to analyze a variable mesh size distribution. The aim was to reduce the number of elements and nodes of the mesh without affecting the accuracy of the numerical solution. An optimized discretization was proposed based on the layout used in the meshes D and E (see Figure 8a). Around the column, at a distant of three times the slab thickness, the mesh size was kept the same and outside that region was adopted a bigger element size as it is illustrated in Figure 8b. Two configurations with 4 and 5 layers of elements were tested (Mesh G and Mesh H respectively).
Figure 7. Comparison of crack pattern (principal tensile strain 𝜀) obtained from the mesh B (left) and mesh F (right) models.
Figure 8. a) Typical element size used for meshes D and E b) Optimized size element distribution used for meshes G and H. The meshes D and G had 4 layers of elements on the slab thickness while the E and H had 5 layers.
In addition, the Table 5 shows that the elapsed time of each model was reduced. For that reason, was verified that the optimized meshes achieved the objective of reducing the computation time process without affecting the accuracy of the numerical solution, both for the Mesh G and for the Mesh H. For next analyses described in this paper the mesh H was adopted.
Table 5: Result obtained from the mesh optimization analysis. Mesh Type Layers on the slab
Thickness Elapsed time Peak Load (kN) Peak Load (mm) Displacement at
D 4 01:32:58 243.45 19.8
G 4 01:05:30 243.62 18.4
E 5 02:20:00 261.29 22.2
H 5 01:42:36 261.64 22.0
Figure 9. Load- displacement curves obtained from the mesh optimization analysis a) Comparison between the meshes D and G (4 element layers on slab thickness) b) Comparison between the meshes E and H (5 element layers on slab thickness).
5 MATERIAL PARAMETERS STUDY
the punching shear failure. This study includes the influence of the Young’s modulus, fracture energy, tension softening behavior, tensile strength and shear retention factor.
This parametric study was conducted by varying the main parameters of the concrete and investigate its sensibility on load-deflection relationship and compressive strain behavior. All parameters mentioned were analyzed one at the time, and the other parameters remain as described in the baseline section of this paper (see Tables 1 and 2). Regarding the results, the load-deflection relationship describes the behavior of the model in the loading procedure. Also, the compressive strain behavior provides information regarding punching shear failure of the tests.
Figure 10 shows the general behavior of the mentioned load-radial compressive strain curves. According to Shu (2017), when the load applied in the slabs reaches 0.7 from the load-carrying capacity, the compressive radial strain by the side of the column reaches a peak and begins to decrease, indicating a change of internal forces. On the other hand, Guan-dalini (2006) assumes this radial strain peak at 0.8-0.9 P . In general, from the results of this paper, it was observed this internal force change above 0.9P.
Figure 10. Position where was measured the radial strain on the numerical model (left) and typical load- radial strain (right).
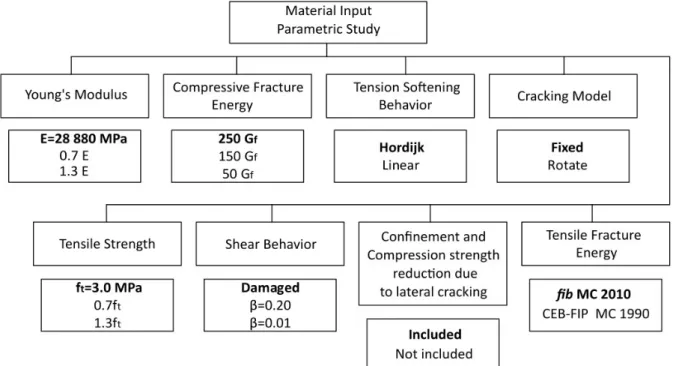
By analyzing both mentioned curves, it was possible to estimate the load-carrying capacity of each parameter studied in this section by measuring the sensibility of all parameters on the behavior of the model and compare the results each other. Figure 11 illustrates a schematic chart indicating the varied parameter choices. Figures 12 to 15 illustrate the results from the models mentioned in the material input parametric study.
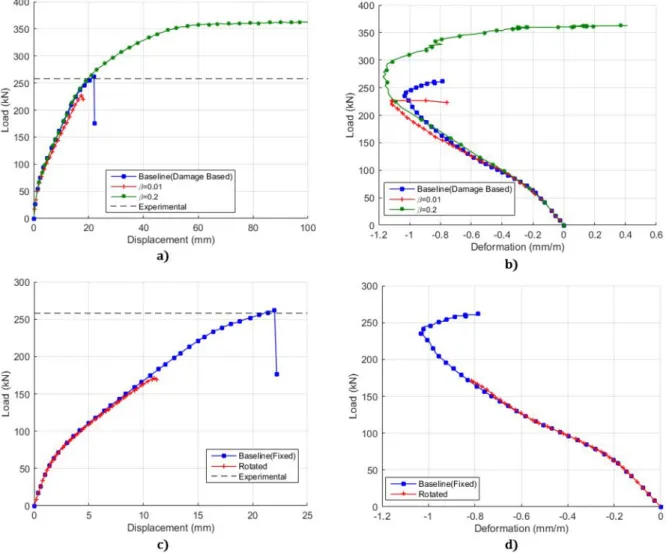
Figure 12 shows the results from the materials input parameters that are associated to shear behavior. These parame-ters provide a relevant change in the response of the model in the loading procedure. It was observed a flexural failure behavior of the test by increasing the constant shear retention factor. This can be observed in the 𝛽 = 0.2 curve (see Figure 12a and Figure 12b). The increase of the shear retention factor provides the model an increase of the punching shear strength leading the structure to a flexural failure.
Figure 12 (continued). Results from the materials input parameters associated to shear behavior.
The reduction of the shear retention factor (𝛽) does not achieve the load-carrying capacity observed in the experi-mental results (see Figure 12a, 𝛽 = 0.01). The model with a smaller shear retention factor does not consider the aggregate interlock on crack opening phenomena leading to a smaller load-carrying capacity.
Figure 13(continued). Results from the materials input parameters associated to the compressive behavior.
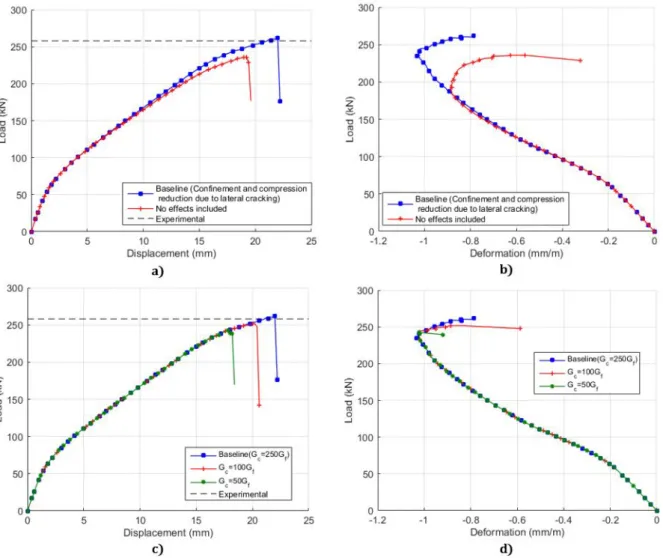
Figure 13 shows the results from the material parameters related to compressive behavior of the parametric analysis. By comparing the results from confinement and compression reduction due to lateral cracking (Figure 13a and 13b), it observed that the model in which these effects are not included reaches a smaller load-carrying capacity and strain peak in comparison with the reference model. According to Selby and Vecchio (1997), the confinement phenomena on concrete provides an increase of the compressive strength and strain peak. This leads to an increase of the load-carrying capacity observed in Figure 13a. Besides the confinement, the compressive fracture energy was another analysis related to com-pressive stresses. From the results observed in Figure 13c and 13d, the fracture energy does not provide a significant change in the behavior of the radial strain. This also was observed in the load-deflections curves.
According to the formulations related to the confinement and compressive fracture energy, both parameters provide a change in the ultimate compressive strain. In addition, the confinement model provides an increase of the compressive strength in order to remain the same compressive fracture energy value along the loading procedure. This leads to conclude that the slabs tested did not reach the final compressive strain of the constitutive law along the loading procedure, reaching the same strain peak.
The same compressive strain peak mentioned was associated with the tensile strain from the equilibrium procedure. The modification of the tensile behavior of the concrete provides the slab to achieve a different equilibrium state and, consequently, different compressive strain peak. This can be observed in the softening behavior analysis (see Figure 14a and 14b). The linear softening modeled with the same tensile strength and tensile fracture energy has a different ultimate tensile strain in comparison with the reference Hordijk softening model. This leads to an equilibrium state that provides an increase of the compressive strain peak. Regarding load-carrying capacity, it was observed that the linear softening model reaches almost the same results in comparison with the reference Hordijk softening model and the curve of load-deflection relationship present a good agreement each other (See Figure 14a).
of the load-carrying capacity of the tests. However, the compressive radial strain peak remained almost the same indicating that the tensile strength does not influences in the results from the compressive strain.
In relation to the tensile fracture energy, the formulation of CEB-FIP MC 1990 leads to a tensile fracture energy almost 50% smaller than the fib MC 2010 (0.77 N/mm against 0.141 N/mm, respectively). The tensile fracture energy was directly proportional to the load-carrying capacity obtained from the model. This also conducts the model to a ductile behavior reaching larger strains at the end of the loading procedure.
Figure 14. Results from the materials input parameters associated to the tensile behavior.
Figure 15. Results from the Young’s modulus analysis.
6 CONVERGENCE ANALYSIS
In order to investigate the influence of the convergence parameters in the behavior of the studied slab, a parametric study was performed. The results from the convergence study was conducted to evaluate the elapsed time until the con-vergence of all the loads steps, number of iterations converged and load-displacement response. The material parameters from the baseline section remained the same for all analysis presented in this section. First of all, the influence in the behavior of the numerical response of the iteration methods Regular Newton-Raphson, Modified Newton-Raphson and the Secant Method were investigated. In this first analysis, the convergence criteria was based on force, energy and dis-placement simultaneously and the disdis-placement load was applied in 200 steps with the size increment step of 0.2 mm, see CM01, CM02 and CM06 in Table 6.
In the second analysis, the Secant method was chosen to carry out the numerical model varying the convergence criteria by energy, force and displacement one at the time. The incremental size of the load step model remained 0.2 mm applied in 200 steps, see CM03, CM04, CM05 in Table 6.
CM03, CM07 and CM08 were studied in order to investigate the influence of the load step incremental size on the numerical analysis. The Secant convergence model was chosen in CM03, CM07 and CM08 based on energy convergence criteria with a tolerance of 10 . CM03 was carried out with a load step incremental size of 0.2 mm, in order to CM07 and CM08 have its load step incremental size of 0.5 mm and 1.0 mm, respectively.
Then, CM03, CM09 and CM10 were carried out to evaluate the response of the model by varying the tolerance of the convergence criteria. All these FE models use the Secant iterative method based on energy criteria. CM03, CM09 and CM10 were carried out with a tolerance of 10 , 10 and 10 , respectively. See Table 6 for more details about the convergence parametric study. All the other numerical, physical and geometrical parameters remained the same as de-scribed in section 3.1 (Baseline analysis). The maximum number of iterations per steps for all models were 200.
Table 6: Convergence parametric study.
Model Convergence Method Criteria Tolerance Load incremental step size
(mm/step) Force Displacement Energy
CM01 Regular Newton Raphson 10 10 10 0.2
CM02 Modified Newton-Raphson 10 10 10 0.2
CM03 Secant N/A N/A 10 0.2
CM04 Secant 10 N/A N/A 0.2
CM05 Secant N/A 10 N/A 0.2
CM06 Secant 10 10 10 0.2
CM07 Secant N/A N/A 10 0.5
CM08 Secant N/A N/A 10 1.0
CM09 Secant N/A N/A 10 0.2
CM10 Secant N/A N/A 10 0.2
From the analysis of the influence of the iteration convergence method, Figures 16 shows the results obtained from the tests. Figure 16a illustrates the load-deflection curves obtained from the analysis of the CM01, CM02 and CM06 models and the Figure 16b shows the step number versus the number of iteration required to reach the convergence of each step.
Figure 16. Results from convergence method analysis.
From the comparison of the load-deflections curves show in Figure 16a, the models stiffness has a good agreement but the load-carrying capacity and the final displacement reached are not the same. The load-carrying capacity reached by the Secant Method was 261.64 kN (1.01𝑃 , where 𝑃 is the load-carrying capacity of the experimental test by Ramos, 2003), against 244.82 kN (0.95𝑃 ) from the Regular Newton-Raphson Method and 234.39 kN (0.91𝑃 ) from the Mod-ified Newton-Raphson Method.
However, Figures 16b shows that the Secant Method requires more iterations per step than the other methods studied. According to the mathematical formulations, the Regular and the Modified Newton-Raphson methods reach the solution by changing the stiffness matrix of the nonlinear problem based on mathematics expression that do not take into account the previous solutions steps, while the Secant Method changes the matrix based on its current step. This requires more iteration per steps and, consequently, more time to reach the solution of each step.
The Modified Newton-Raphson changes the stiffness matrix only in the first iteration of each step, in some cases this could lead to a less computational work and less time to reach the solution on each step. However, it is important to remind that more iterations are needed to solve the problem when compared to Regular Raphson. The Modified Newton-Raphson Method reaches the last convergence step in 38 minutes, while The Regular Newton-Newton-Raphson Method and The Secant Method reaches in more than 1 hour. Nevertheless, by using the same matrix in all the iterations may cause problems in the convergence procedure, not solving the problem and reaching the maximum number of iterations. The number of the steps that converged using the Modified Newton-Raphson Method was 85, while the Regular Newton-Raphson Method was 95 and Secant Method was 111. This leads to a maximum displacement reached by the model based on the Modified Newton-Raphson Method of 16.8 mm, while the experimental results by Ramos (2003) was about 20 mm. In the tests presented in this paper, the Secant Method was able to best represent better the experimental results in comparison with the other iteration convergence method based on its load and displacement results, reaching 261.64 kN (1.01𝑃 ) and 22 mm (1.1𝛿 ).
Figure 17. Results from the convergence criteria analysis.
Regarding load-deflection relationship, Figure 17a shows that the test based on energy and force criteria had similar results. The results from the Secant Model based on displacement criteria did not have a good agreement with the other models studied in this paper, including the experimental results from Ramos (2003). From the displacement of 15 mm to the last step presented in Figure 17a, the model based on displacement criteria presented an instability in their results and an untrue equilibrium (see Figure 17a).
Figure 17b indicates that test based on displacement needed less iterations to converge each step. This can be observed in the first steps of the analysis and give a good agreement with the tests based on Force and Energy (see Figure 17a). After the 80th step (16 mm, Figure 17a) the number of iterations needed to converge each step and the solution presented were not according to the expected results from a punching shear failure, for that reason, the FE analysis of the model based on displacement criteria was interrupted by the authors in the 115 step. From these results, it could be concluded that the displacement criteria should be avoided. This recommendation is also suggested by Hendriks et al. (2016). This fact is explained by the use of incremental displacement vectors in the displacement criteria that could leads to an untrue equilibrium when small values of those vectors are reached between iterations (Claus, 2009).
The next study was focused on the convergence tolerance. Too loose norm criteria may lead to inaccurate and unre-liable results, on the other hand, a too strict norm will lead to an excessive computational work, without improving on the results (Claus, 2009). The tolerance value must be determined carefully, independent of the criteria chosen to carry out the nonlinear analysis and its strictness.
In order to investigate the differences of a loose and a strict analysis, the results from CM03, CM09 and CM10 were compared. The models differs each other only by the tolerance of the convergence criteria, using the Secant Method to solve the nonlinear problem (See Table 6). Figure 18 illustrates the results obtained. Figure 18a illustrates the load-deflec-tion relaload-deflec-tionship and Figure 18b the number of steps converged versus the number of iteraload-deflec-tion needed to reach the equi-librium.
From the results displayed in Figure 18, all the models were similar each other in terms of stiffness on the load-deflection relationship. Nevertheless, the model with the tolerance of 10 (CM10) had some divergences along the load incremental steps. Figures 18b show that the model with the tolerance of 10 (CM10) needed less iterations than the other models studied. The loose tolerance of CM10 leads the analysis to have an oscillating behavior in the load-displace-ment response along the steps.
Comparison between the CM03 (tolerance of 10 ) and CM09 (tolerance of 10 ) presents another inaccurate solu-tion along the incremental load steps in the analysis of the model. From the CM09 results (Figures 18b) it was observed that the number of iterations to reach the equilibrium in each step increases with the number of incremental steps con-verged, reaching the maximum number of iterations in the 83th incremental step (16.6 mm) of the analysis and achieved 0.9𝑃 .
In the other hand, CM03 need more iterations to reach the equilibrium on each step, but the equilibrium obtained it is a more reliable solution and the convergence of the subsequent steps leads to a final behavior more accurate than the other models. Regarding the time elapsed to finish the analysis, CM09 and CM10 elapsed about 25 minutes against 54 minutes by CM03.
In order to analyze the influence of the size of the load incremental steps of the models, CM03, CM07 and CM08 were carried out (see Table 6 for more details). Figure 19 illustrates the results from the analysis of the models. Figure 19a shows the results from load-carrying capacity versus max deflection of the model and Figure 19b shows the steps con-verged normalized by the total number of steps reached versus the number of iterations needed to reach the equilibrium of each steps.
CM03 was the reference model in this analysis. The size of the load incremental step carried out by CM03 was 0.2mm, reaching 40mm after convergence of all the 200 load steps. CM07 and CM08 were carried out with a larger incremental step size: 0.5mm and 1.0mm, respectively. In order to compare the models each other, the x-axis that corresponds of the incremental steps on Figure 19b was normalized by the maximum number of steps converged reached in the end of the FE analysis.
Figure 19. Results from the load incremental step size analysis.
Regarding load-deflection relationship, all the models studied to investigate the size of the incremental load steps are in a good agreement each other. The load-carrying capacity reached by the models are between 258kN and 265kN and the maximum deflection are between 21.2 mm and 23 mm (see Figure 19a).
The major difference on the results are the number of steps converged and the time elapsed on the analysis. CM03 (reference with 0.2 mm/step) needed 54 minutes to reach the final solution of the test against 29 minutes from the CM07 (0.5 mm/step) and 22 minutes from CM08 (1.0 mm/step). It also was observed that a larger incremental load steps size will lead to a higher number of steps needed to reach the equilibrium of each step, see Figure 19b.
In general, a small incremental size will provide a more stable and accurate results along the analysis procedure (Claus, 2009). Furthermore, a smaller incremental step size on the nonlinear procedure converges more easily. This can be observed in the number of iterations need to converge each steps in the Figure 19b. However, this leads to a large compu-tational expense, observed in the large amount of steps converged and in the comparison of the time elapsed to finish the analysis of CM03 (109 steps and 54 minutes) and CM10 (25 steps and 22 minutes).
the elastic linear behavior and the small incremental size may be used after. This will provide more accurate results in the post-cracking behavior stage and a less computational expense in the linear elastic behavior stage of the model.
The last parametric analysis studied in this paper was the influence of the line search technique on the steps conver-gence procedures. This analysis was compared by CM03 and CM11, which are the same numerical model but only with the difference of the CM03 was carried out with line search technique and CM11 was carried out without it. Figure 20 illustrates the comparison from CM03 and CM11.
Figure 20. Results from the line search analysis.
From the results shown in Figure 20, there were not significant differences observed in the models. The load-carrying capacity reached is almost the same value (258 kN to CM03 against 257 kN to CM11) and the elapsed time differs only in 2 minutes (54 minutes to CM03 against 56 minutes to CM11. The line search is a mathematical technique to provide a solution in less time, furthermore the secant method has a search technique included that provides almost the same results, justifying the observed results. To summarize, the results from the convergence parametric study are presented in Table 7.
Table 7: Convergence comparison.
Model Elapsed time Peak Load (kN) Displacement at Peak Load (mm)
Number of steps
Converged Observations
CM01 01:30:54 244.82 18.2 95 Regular Newton-Raphson
CM02 00:37:57 234.39 16.8 85 Modified Newton-Raphson
CM03 00:54:26 258.87 21.2 109 Secant (E)
CM04 00:40:24 259.06 21.2 108 Secant (F)
CM05 02:52:43 228.28 16.0 115+ Secant (D)
CM06 01:42:36 261.64 22.0 111 Baseline: Secant (F D E)
CM07 00:29:04 262.74 22.5 46 Step size: 0.5 mm/step
CM08 00:22:06 265.53 23.0 25 Step Size: 1.0 mm/step
CM09 00:22:45 232.90 16.4 83 Tol.: 10
CM10 00:24:22 267.87 21.8 111 Tol.: 10
CM11 00:56:20 257.87 21.2 109 Without Line Search
7 NUMERICAL AND EXPERIMENTAL RESULTS COMPARISON
7.1 Load-displacement curve
The Figure 21 shows the load-displacement comparison for the Positions 1 and 2. It is important to remind that in the experimental scheme the load was applied in the plates around the column and the column itself was the only support of the slab. Thus, in order to compare the numerical results, the model reference system was changed to coincide with the test scheme. From the Figure 21 it can be observed that the load-displacement behavior of the experiment was similar in comparison to the numerical analysis results, especially at the position 1. In the case of the position 2 a stiffener behavior was obtained, however the general behavior of the experimental load-displacement curve is represented properly.
Figure 21. Comparison from load-deflection relationship between numerical model and experimental test from Ramos (2003).
7.2 Load-strain curve for reinforcement bars
Figure 22 (continued). Comparison from load-strain on reinforcement bars between numerical models and experimental test.
7.3 Cracking Pattern
The crack pattern evolution is shown in the Figure 23 at three different stages. This evolution allows to examine the development of the radial and tangential crack around the column. Also, the post-failure crack pattern at the cross section is compared with the experimental results (See Figure 24). The numerical crack pattern shows that the model was able to capture the punching shear failure. It can be observed that the inclined shear crack have a similar angle and position in comparison with the experimental punching cone.
Figure 24. Comparison of the failure surface between numerical models and experimental test.
8 CONCLUSIONS
In this paper, several choices on NLFEA of punching shear slabs problems were carry out in order to investigate theirs influences in the overall behavior of the model. The proposed study aimed to investigate a variety of mesh discreti-zation of the FE model in the accuracy of the results, the influence of the main RC materials input parameters and conver-gence parameters to reach the equilibrium. From the result obtained the following conclusion can be drawn:
Based on the analysis of the mesh discretization, it was verified that the numerical solution converged as the mesh was refined. By analyzing the result of the different configurations tested, it is recommended the use of twenty-node brick element with quadratic interpolation and a minimum of 5 layers of elements along the slab thickness. In order to reduce the number of nodes and elements, a less fine mesh could be used outside the punching failure zone, without affecting the accuracy of the numerical solution.
Regarding the materials input, it was observed that the parameters that most influence the behavior of the slabs was the parameters associated to shear. The shear retention factor showed a relevant importance in the failure mode and the fixed smeared crack model presented a good agreement with the experimental results. This can be justified by the shear stresses that developed on the crack surfaces. The parameters associated to compressive and tensile behavior provides changes in the radial strain and in its final equilibrium state.
According to the results from the material input parametric analysis, the Young’s modulus was inversely proportional to the load-carrying capacity and compressive radial strain peak. On other hands, the tensile strength, the shear retention factor and the tensile fracture energy were directly proportional to the load-carrying capacity. The compressive fracture energy does not provide significant changes on the overall behavior. Nevertheless, the confinement provides an increase of the compressive strength along the loading procedure, consequently increasing the load-carrying capacity.
From the convergence analysis, the Secant method provides more computational expense and a larger elapsed time to reach the final solution in comparison to the Regular and Modified Newton-Raphson. However, The Secant Method provides less convergence problems in comparison to the other methods. The displacement criteria demands less iterations to reach the convergence on each step, but it could leads to an inaccurate solution.
Acknowledgements
The authors would like to express their gratitude to the Coordenação de Aperfeiçoamento de Pessoal de Nível Supe-rior (CAPES) and the Structural Modeling and Monitoring Laboratory (LABMEM) of the University of Campinas (UNI-CAMP) for supporting this research.
References
American Concrete Institute. ACI 318-14. Building Code Requirments for Structural Concrete and Commentary (ACI 318R-11). Farmington Hills, Michigan, 2014.
Belletti B.; Walraven J. C.; Trapani F. (2015). Evaluation of compressive membrane action effects on punching shear resistance of reinforced concrete slabs, Engineering Structures.
CEB-FIP. BULLETIN N° 45: Practitioners’ Guide to Finite Element Modelling of Reinforced Concrete Structures. State Of Art Report, 2007.
Cervera, M.; Chiumenti, M. (2006). Smeared crack approach: back to the original track. International journal for numerical and analytical methods in geomechanics, Wiley Online Library, v. 30, n. 12, p. 1173–1199.
Claus, T. (2009). Non-linear finite element analysis of shear critical reinforced concrete beams.
Comité Euro-International du Béton. fib Model Code 2010–Final draft. Lausanne, 2012.
Comité Euro-International du Béton. CEB-FIP Model Code 1990-Final draft, Lausanne, Thomas Telford, 1993.
DIANA (2012). Finite Element Analysis - Release 9.4.4 D. o. C. Research. Delft, The Netherlands, TNO Diana BV.
Eurocode 2, Design of Concrete Structures—Part 1-1: General Rules and Rules for Buildings, CEN, EN 1992D1D1, Brus-sels, Belgium, 2004, 225 pp.
Guandalini, S. (2006). Poinçonnement symétrique des dalles en béton armé. EPFL.
Hallgreen, M. (1996). Punching Shear Capacity of Reinforced High Strength Concrete Slabs. Department of Structural Engineering. Stockholm, Sweden, Royal Institute of Technology. Doctoral Thesis: 206.
Hendriks, M.; Boer, A. de; Belletti, B. (2016). Guidelines for nonlinear finite element analysis of concrete structures. Rijkswaterstaat Technisch Document (RTD), Rijkswaterstaat Centre for Infrastructure, RTD, v. 1016, p. 2012.
Hordijk, D. (1991). Local Approach to Fracture of Concrete. Ph. D Thesis. Delft University of Technology, Delft, The Netherlands.
Kinnunen, S.; Nylander, H. (1960). Punching of concrete slabs without shear reinforcement, meddelande nr 38. Institu-tionen for Byggnadsstatik, Kungliga Tekniska Hogs, Stockholm, Sweden.
Mamede, N. F. S.; Ramos, A. P.; Faria, D. M. (2012). Experimental and parametric 3d nonlinear finite element analysis on punching of flat slabs with orthogonal reinforcement. Engineering Structures, Elsevier, v. 48, p. 442–457.
Menétrey, P. (1995). Simulation of Punching Failure: Failure Mechanism and Size Effect. Fracture Mechanics of Concrete Structures, 1229-1238.
Muttoni, A. (2008). Punching Shear Strength of Reinforced Concrete Slabs Without Transverse Reinforcement. ACI Struc-tural Journal, July/August.
Nakamura, Hikaru; Higai, Takeshi. (2001). Compressive fracture energy and fracture zone length of concrete. Modeling of inelastic behavior of RC structures under seismic loads, 471-487.
Nielsen, Mogens Peter; Braestrup, Mikael W. (1976). Plastic shear strength of reinforced concrete beams. Afdelingen for Baerende Konstruktioner, Danmarks Tekniske Hojskole.
Ramos, A. M. P. (2003.) Punching in prestressed concrete flat slab. Ph. D Thesis (in Portuguese). Universidade Técnica de Lisboa–Instituto Superior Técnico, Lisboa, Portugal.
Selby, R.; Vecchio, F. (1997). A constitutive model for analysis of reinforced concrete solids. Canadian Journal of Civil Engineering, NRC Research Press, v. 24, n. 3, p. 460–470.
Shehata, I. A. E. M. (1990). “Rational Method for Designing RC Slabs to Resist Punching.” Journal ofStructural Engi-neering Vol. 116, No. 7(ASCE): 2055-2060.
Shu, Jiangpeng. (2017). Structural Analysis Methods for the Assessment of Reinforced Concrete Slabs. 2017. 68 f. Ph.D Thesis - Civil Engineering, Department Of Architecture And Civil Engineering, Chalmers University Of Technology, Göteborg, Sweden.
Shu, Jiangpeng; Plos, M.; Zandi, Kamyab; Johansson, Morgan; Nilenius, Filip. (2016). Prediction of punching behaviour of RC slabs using continuum non-linear FE analysis, Engineering Structures, V 125, Pages 15-25, ISSN 0141-0296,