Teresa Patrícia da Silva Gil Duarte
Licenciada em Bioquímica
Candidate Germline Genetic Variants for
Familial Colorectal Cancer Type X
Dissertação para obtenção do Grau de Mestre em
Genética Molecular e Biomedicina
Orientador: Dra. Maria Cristina Mantas Albuquerque Valeroso,
Investigadora, Unidade de Investigação em Patobiologia
Molecular (UIPM), Instituto Português de Oncologia de
Lisboa Francisco Gentil, EPE (IPOLFG)
Júri:
Presidente: Prof. Doutora Paula Maria Theriaga Mendes Bernardes Gonçalves Arguente: Prof. Doutora Maria Alexandra Taquenho Maia e Silva
Setembro 2017
Teresa Patrícia da Silva Gil Duarte
Licenciada em Bioquímica
Candidate Germline Genetic Variants for Familial Colorectal
Cancer Type X
Dissertação para obtenção do Grau de Mestre em
Genética Molecular e Biomedicina
Orientador: Dra. Maria Cristina Mantas Albuquerque Valeroso, Investigadora,
Unidade de Investigação em Patobiologia
Molecular (UIPM), Instituto Português de Oncologia de
Lisboa Francisco Gentil, EPE (IPOLFG)
Júri:
Presidente: Prof. Doutora Paula Maria Theriaga Mendes Bernardes Gonçalves Arguente: Prof. Doutora Maria Alexandra Taquenho Maia e Silva
Candidate Germline Genetic Variants for Familial Colorectal Cancer Type X
Copyright Teresa Patrícia da Silva Gil Duarte, FCT/UNL, UNL
A Faculdade de Ciências e Tecnologia e a Universidade Nova de Lisboa têm o direito, perpétuo e sem limites geográficos, de arquivar e publicar esta dissertação através de exemplares impressos reproduzidos em papel ou de forma digital, ou por qualquer outro meio conhecido ou que venha a ser inventado, e de a divulgar através de repositórios científicos e de admitir a sua cópia e distribuição com objectivos educacionais ou de investigação, não comerciais, desde que seja dado crédito ao autor e editor.
AGRADECIMENTOS
Em primeiro lugar, não podia deixar de agradecer a todas as pessoas que me ajudaram e contribuíram para a realização deste projeto, esta jornada não seria a mesma sem vocês.
À Dra Cristina Albuquerque por me ter dado a oportunidade de desenvolver este projeto, pela disponibilidade com que esclareceu as minhas dúvidas, por toda a simpatia e por todo o conhecimento que me transmitiu ao longo deste ano.
Ao Dr. Bruno Filipe, um especial agradecimento por toda a incansável ajuda prestada, paciência, disponibilidade para esclarecer todas as minhas dúvidas e por nunca ter perdido a simpatia apesar da constante insistência em lhe “gastar” o nome.
À Mestre Inês Francisco por toda a ajuda prestada na revisão da tese, transmissão de conhecimentos e apoio no trabalho prático realizado, e à Doutoranda Patrícia Silva por toda a ajuda e simpatia com que me acolheu.
À Doutora Branca Cavaco, Coordenadora da unidade de Investigação em Patobiologia Molecular, do Instituto Português de Oncologia, Lisboa, Francisco Gentil, E.P.E, por me ter concedido a oportunidade de participar neste projeto.
Ao Serviço de Gastrenterologia, Clínica de Risco familiar e ao Serviço de Anatomia Patológica do Instituto Português de Oncologia, Lisboa, Francisco Gentil, E.P.E, pela disponibilização do material biológico e informação clínica dos doentes.
À Dra Patrícia Machado, Dra Sidónia Santos e em especial à Dra Sofia Fragoso por toda a boa disposição no laboratório e simpatia.
Aos restantes membros da Unidade de Investigação em Patobiologia Molecular, pela simpatia com que me receberam.
Às minhas colegas de laboratório Marlene Duarte, Ana Magalhães, Ana Hipólito e Carolina Pereira que tornaram todo este percurso mais fácil, seja por um sorriso, uma palavra amiga, uma gargalhada na hora de almoço ou um simples “estou aqui para te ajudar”. Sem vocês o laboratório não seria o mesmo.
À Mestre Marlene Duarte por todos os momentos de carinho, amizade e descontração e sobretudo por seres incansável e sempre disposta a ajudar.
À minha Mestre Ana Magalhães por me teres acolhido como tua pupila e sobretudo como tua amiga. Por toda a ajuda, toda a força que me transmitiste e por todos os sorrisos dentro e fora do laboratório. Não podia ter pedido melhor mestre.
À minha Ana Hipólito, por me teres dado uma nova alegria a partir do momento em que entraste no laboratório e que do nada te tornaste o meu apoio. Por todas as noitadas no laboratório, todas as loucuras, sorrisos, tristezas, dias intensivos e acima de tudo, por teres estado sempre aqui para mim.
À minha colega de casa, Marta Fernandes por todo o apoio, paciência para ouvir as minhas lamurias, momentos de descontração, carinho e amizade.
Aos meus “Chucha-rolhas”, “FCTenses” e “Supremas” por toda a amizade e carinho, que mesmo longe estão sempre presentes.
Ao Duarte, as palavras são poucas para tanto que tenho de te agradecer. Obrigada por seres, obrigada por estares e, sobretudo, obrigada por me fazeres sorrir.
Por fim, a vocês, pais, por todo o apoio e amor incondicional, por toda a força e incentivo que deram ao longo da vida e pelos exemplos de coragem que são para mim. Mais uma vez, as palavras não chegam. OBRIGADA.
ABSTRACT
Familial colorectal cancer type X (FCCTX) defines families that fulfill the Amsterdam criteria without evidence of defects in the DNA mismatch repair (MMR) genes and whose tumors do not present microsatellite instability. However, its genetic etiology remains unknown, therefore this study aimed to identify and evaluate novel variants and candidate genes that may play a role in FCCTX susceptibility. Based on a previous whole exome sequencing (WES) study in a FCCTX family, a bioinformatic analysis and a subsequent in silico and segregation studies were conducted to identify candidate genes and/or specific variants that may predispose for this syndrome. Since this analysis was already started, variants in 6 genes have already been identified to segregate with the disease.
Therefore, the aim of this project was to continue this work by completing the selection of candidate variants and to characterize and try to clarify the role of these variants for FCCTX susceptibility. In order to elucidate the possible contribution of the corresponding genes for FCCTX, a mutational analysis was performed to search for germline mutations in index patients from FCCTX and FCCTX-like families. In addition, using the WES data, a copy number variation (CNV) analysis was also performed for the family subjected to WES, followed by a bioinformatic and in silico analysis to reveal amplicon deletions that may segregate with disease. It was also evaluated the involvement of the TPP2 gene, previously identified as a possible candidate gene for FCCTX in another family, in healthy and affected FCCTX patients, by mutational/splicing analysis, relative quantification by quantitative PCR and protein truncation test to assess resulting truncating proteins.
The bioinformatic followed by in silico and segregation analysis of the variants obtained from WES, revealed 1 variant in the CACNA1S gene that segregated with the disease. Adding this variant to the already obtained, a total of 7 variants in different genes were found as possible contributors to FCCTX in this family (MTMR3, NPR2, DUSP12, LGR6, TAS1R1, SMG7 and CACNA1S). The segregation analysis also revealed the segregation of the previously identified MTMR3 and TAS1R1 variants in a patient from an older generation of the family. The CNV analysis revealed, after selective criteria, 22 amplicons of interest with a deletion scenario, for further segregation studies.
The germline mutational analysis in a set of FCCTX and FCCTX-like families uncovered 2 and 3 potentially pathogenic variants for the MTMR3 and TAS1R1 genes, respectively. One of the variants found in MTMR3 was the same found in the WES analysis. Thus far no relevant variants were observed for the remaining candidate genes, however this analysis is not completed.
The TPP2 study revealed the presence of non-described splicing isoforms. One of these isoforms exhibited a differential expression between healthy and affected individuals and the protein truncation test revealed that this alternative transcript gives rise to a truncated protein.
In conclusion, the identification of more than one genetic variant appears to agree with the suggestion that FCCTX is a heterogeneous entity and the discovery of potentially pathogenic variants in MTMR3 and TAS1R1 reinforce their possible involvement in FCCTX. The alternative TPP2 transcript appears to be involved in the earlier stages of colorectal carcinogenesis.
RESUMO
O cancro do cólon e reto familiar do tipo X (FCCTX) define as famílias que preenchem os critérios de Amesterdão nas quais não é identificada mutação germinal nos genes de reparação de erros de DNA do tipo mismatch (MMR) e cujos tumores não apresentam instabilidade de microssatélites. Sendo a sua causa molecular desconhecida. Assim, o presente estudo teve como objetivo identificar e avaliar novas variantes e genes candidatos que possam estar envolvidos na suscetibilidade para o FCCTX. Com base num estudo prévio de whole exome sequencing (WES), realizado numa família FCCTX, foi efetuada uma análise bioinformática e in silico e um subsequente estudo de segregação, de modo a identificar genes candidatos e/ou variantes específicas que possam predispor para esta condição hereditária. Uma vez que esta análise já tinha sido iniciada, 6 variantes em diferentes genes, que segregaram com a doença, já tinham sido identificadas.
Assim, o objetivo deste trabalho consistiu na continuação deste estudo, completando a seleção das variantes candidatas, e na caracterização e clarificação destas variantes para a suscetibilidade para o FCCTX. De modo a elucidar a possível contribuição destes genes para o FCCTX, foi realizada uma análise mutacional em indivíduos index de famílias FCCTX e potenciais famílias FCCTX. Adicionalmente, utilizando os resultados da WES, foi também realizada uma análise de copy number variantion (CNV) para a família integrada na análise de WES, seguida de uma análise bioinformática e estudos in silico de modo a avaliar a presença de deleções de amplicons que pudessem segregar com a doença. O envolvimento de transcritos alternativos do gene TPP2, previamente identificado como um possível gene candidato para o FCCTX noutra família, foi também avaliado em indivíduos saudáveis e afetados por análise mutacional/splicing, quantificação relativa por PCR quantitativo e teste da proteína truncada, para avaliar a existência de proteínas truncantes.
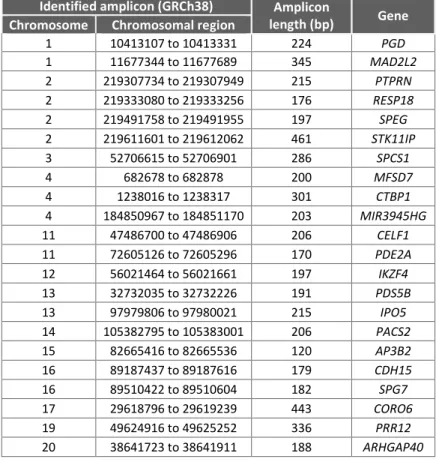
A análise bioinformática seguida pela análise in silico e segregação das variantes obtidas por WES revelou a segregação com a doença de uma variante no gene CACNA1S. Tendo em conta as variantes já obtidas, foram identificadas 7 variantes em diferentes genes (MTMR3, NPR2, DUSP12, LGR6, TAS1R1, SMG7 e CACNA1S) como possíveis intervenientes na suscetibilidade para o FCCTX nesta família. A análise de segregação revelou ainda a segregação das variantes dos genes MTMR3 e TAS1R1 num individuo proveniente de uma geração anterior. A análise de CNV revelou, após a introdução de critérios seletivos, 22 amplicons de interesse com um cenário de deleção, para estudos de segregação adicionais.
A análise de mutações germinais num conjunto de famílias FCCTX e potenciais famílias FCCTX revelou 2 e 3 variantes potencialmente patogênicas para os genes MTMR3 e TAS1R1, respetivamente. Uma das variantes encontradas no gene MTMR3 correspondeu à variante encontrada no estudo de WES. Não foram observadas até ao momento variantes relevantes para os restantes genes candidatos, porém esta análise não está completa.
O estudo do gene TPP2 revelou a presença de isoformas não descritas. Uma destas isoformas apresentou uma expressão diferencial entre o transcrito normal e o alternativo em indivíduos saudáveis e afetados e, o teste da proteína truncada revelou que este transcrito alternativo dá origem a uma proteína truncada.
Em conclusão, a identificação de mais de uma variante genética parece concordar com a sugestão de que o FCCTX é uma entidade heterogénea, e a descoberta de variantes potencialmente patogénicas nos genes MTMR3 e TAS1R1 reforçam seu possível envolvimento no FCCTX. O transcrito alternativo do gene TPP2 parece estar envolvido numa fase inicial da carcinogénese colorretal.
Keywords: FCCTX, WES, Cancro Colorectal, Variantes Genéticas Germinais, Genes de
TABLE OF CONTENTS
1. Introduction ... 1
1.1 Colorectal cancer ... 1
1.2 Molecular events associated with colorectal carcinogenesis ... 1
1.2.1 Chromosomal instability pathway ... 1
1.2.2 Microsatellite instability pathway ... 3
1.2.3 CpG island methylator phenotype pathway ... 4
1.3 Hereditary colorectal cancer syndromes ... 4
1.3.1 Polyposis colorectal cancer syndromes ... 5
1.3.1.1 Familial adenomatous polyposis ... 5
1.3.1.2 MUTYH-associated polyposis ... 5
1.3.1.3 Hamartomatous polyposis ... 5
1.3.1.4 Serrated polyposis ... 6
1.3.2 Nonpolyposis colorectal cancer syndromes ... 6
1.3.2.1 Lynch syndrome ... 7
1.3.2.2 Familial colorectal cancer type X ... 8
1.4 Molecular characterization and identification of novel susceptibility genes/variants for FCCTX 10 1.4.1 Molecular characterization of a group of FCCTX families ... 10
1.4.2 Identification of novel FCCTX susceptibility loci through linkage analysis ... 10
1.4.2.1 Tripeptidyl peptidase 2 ... 11
1.4.3 Identification of novel FCCTX susceptibility variants by whole genome sequencing .... 12
1.4.3.1 Selection of variants identified through whole exome sequencing analysis ... 16
1.5 Objectives ... 17
2. Material and methods ... 19
2.1 Biological samples ... 19
2.2 Methods ... 19
2.2.1 Nucleic acid extraction/isolation ... 19
2.2.1.1 Genomic DNA and RNA isolation from peripheral blood... 19
2.2.1.2 Genomic DNA isolation from formalin-fixed paraffin-embedded tissue ... 20
2.2.2 Polymerase Chain Reaction ... 20
2.2.2.1 PCR optimization ... 21
2.2.2.2 Primer design ... 21
2.2.2.3 DNA/cDNA amplification by PCR ... 22
2.2.2.4 Agarose gel electrophoresis ... 22
2.2.3 Sanger sequencing ... 23
2.2.3.1 Purification of amplified PCR products ... 23
2.2.3.2 Sequencing reaction ... 24
2.2.3.3 DNA precipitation and purification after sequencing reaction ... 24
2.2.3.4 Preparation of sequencing reaction products for capillary electrophoresis ... 25
2.2.3.5 Analysis of results ... 25
2.2.4 cDNA synthesis by reverse transcription reaction ... 25
2.2.5 Quantitative PCR ... 25
2.2.5.1 Optimization of qPCR conditions and qPCR reaction ... 27
2.2.6.1 Selection of variants identified through WES in the L56 family ... 28
2.2.6.2 Segregation analysis of the selected variants with the disease in the L56 family ... 28
2.2.6.3 Identification of novel FCCTX susceptibility genes by copy number variation analysis based on WES data ... 29
Copy number variation analysis in the L56 family ... 29
2.2.6.3.1.1 Selection of amplicons derived from CNV analysis ... 30
2.2.7 Germline mutation analysis of candidate genes for FCCTX susceptibility ... 30
2.2.7.1 Primer design for amplification of candidate genes for FCCTX susceptibility ... 30
2.2.7.2 Mutation analysis of candidate genes for FCCTX susceptibility ... 31
2.2.7.3 Mutational analysis of the MTMR3 c.1933C>T variant in healthy individuals ... 32
2.2.8 Potential pathogenic role of TPP2 gene ... 32
2.2.8.1 TPP2 gene expression analysis by qPCR ... 32
2.2.8.2 Splicing analysis of TPP2 ... 33
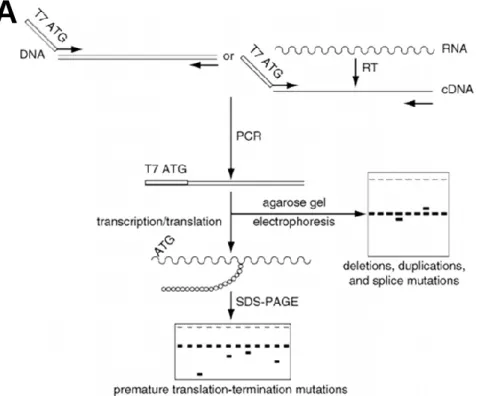
2.2.8.3 Study of the TPP2 alternative 13a exon using the protein truncation test technique 33 Protein truncation test ... 33
PCR amplification of TPP2 for PTT ... 35
Preparation of transcription/translation reaction ... 35
SDS-PAGE gel electrophoresis ... 35
Treatment and SDS-PAGE gel revelation ... 36
Analysis of results ... 36
3. Results ... 37
3.1 Identification of novel FCCTX susceptibility variants by WES ... 37
3.1.1 Selection of variants identified through WES in the L56 family ... 37
3.1.2 Segregation study of the selected variants ... 37
3.1.3 Copy number variation analysis in the L56 family based on WES data ... 41
3.2 Germline mutation analysis of candidate genes for FCCTX susceptibility ... 42
3.2.1 MTMR3 ... 42
3.2.2 TAS1R1 ... 44
3.2.3 DUSP12 and LGR6 ... 45
3.3 TPP2 role in FCCTX susceptibility ... 45
3.3.1 Gene expression analysis ... 45
3.3.2 Splicing analysis ... 46
3.3.3 Study of the alternative 13a exon by PTT ... 51
4. Discussion ... 53
4.1 Identification of novel FCCTX susceptibility variants by WES ... 53
4.1.1 Analysis of potential copy number variation (disease associated) from the WES data 55 4.2 Germline mutational analysis of candidate genes for FCCTX susceptibility ... 55
4.2.1 MTMR3 ... 55 4.2.2 TAS1R1 ... 58 4.3 TPP2 role in FCCTX susceptibility ... 59 5. Conclusion ... 63 6. References ... 65 7. Appendices ... 71
FIGURE INDEX
Figure 1.1 - The adenoma-carcinoma sequence. Main histological and molecular changes. ... 2 Figure 1.2 - Schematic overview of the WNT signaling pathway and its role in colorectal cancer. ... 3 Figure 1.3 – Schematic view of chromosome 13. Localization of the minimum LOH region identified
through linkage analysis and the genomic location of TPP2. ... 11 Figure 1.4 – Pedigree of the TSG- family - L56. ... 14
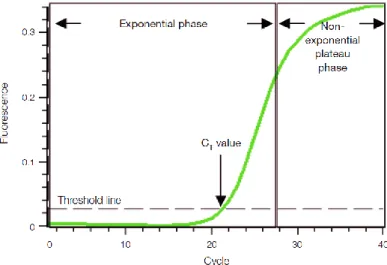
Figure 1.5 - Exclusion criteria used for the selection of variants for segregation studies with the disease within L56 family. ... 16 Figure 2.1 – Graphic representation of a qPCR amplification plot. ... 26 Figure 2.2 – Schematic representation of how the primers for cDNA amplification of the candidate genes
were designed.. ... 31 Figure 2.3 - The protein truncation test. ... 34 Figure 3.1 – L56 family pedigree with the segregation results for variant p.Asp1203Asn, located at the
CACNA1S gene. ... 39 Figure 3.2 - L56 family pedigree with the segregation results for all the selected variants that segregated with the disease. ... 40 Figure 3.3 - Partial electropherograms representing the 3 identified variants in the MTMR3 gene. ... 42 Figure 3.4 – Representative scheme of the alternative spliced isoforms found in fragments B and D of
MTMR3. ... 43 Figure 3.5 – Gene expression analysis by qPCR of the wt (13/14) and an alternative transcript (13a) of the TPP2 gene. ... 46 Figure 3.6 – Schematic representation of the described isoforms for TPP2 (ENST00000376065 and
ENST00000376052) and a non-described isoform.. ... 47 Figure 3.7 – Representative scheme of the steps involved in TPP2 splicing analysis of sample L950 and
respective results. ... 48 Figure 3.8 - Representative scheme of the steps involved in TPP2 splicing analysis of sample L1590
and respective results.. ... 49 Figure 3.9 - Representative scheme of the steps involved in TPP2 splicing analysis of sample L926 and
respective results.. ... 50 Figure 3.10 - Representative scheme of the steps involved in TPP2 splicing analysis of sample L447
and respective results. ... 50 Figure 3.11 - Representative scheme of the steps involved in TPP2 splicing analysis of samples L905
(upper panel) and L1544 (lower panel), and respective results. ... 51 Figure 3.12 – Partial radiography from the PTT, representing the normal and the truncated protein bands
for 3 samples: L1574, L1544 and CAs2000. ... 52 Figure 4.1 – Mechanisms of excitation-contraction coupling and relaxation in skeletal muscle cells. .. 54 Figure 4.2 - Schematic representation of the MTMR3 transcript (Ensemble ID: ENST00000401950) and
localization of the main protein domains.. ... 55 Figure 4.3 – Family’s pedigree of the individual were the c.1933C>T (p.Arg645Trp) variant was found
Figure 4.4 –Regulation of autophagy by interaction of G-protein-coupled taste receptor TAS1R1/TAS1R3 with mTORC1. ... 58 Figure 4.5 – Main domains of the TAS1R1 protein and the localization of 3 of the variants found. ... 59 Figure 4.6 - Schematic representation of the described isoforms for TPP2 and localization of the main
protein domains.. ... 60 Figure 4.7 – Amino acid (aa) sequences for the normal TPP2 protein (left panel), with a molecular weight
of 138 kDa and the truncated protein generated by the insertion of the 13a exon (right panel), with an approximate (~) molecular weight of 65 kDa. ... 61
TABLE INDEX
Table 1.1 - Amsterdam criteria I and II ... 7 Table 1.2 - The Bethesda guidelines ... 8 Table 1.3 – Contrasts between LS and FCCTX. ... 9 Table 1.4 - Description of the strategy used in the 5 bioinformatic analyzes using the results obtained
by WES for the selected patients from L56, and respective number of variants. ... 15 Table 1.5 - Description of the 4 outputs obtained after bioinformatic analysis and total number of variants
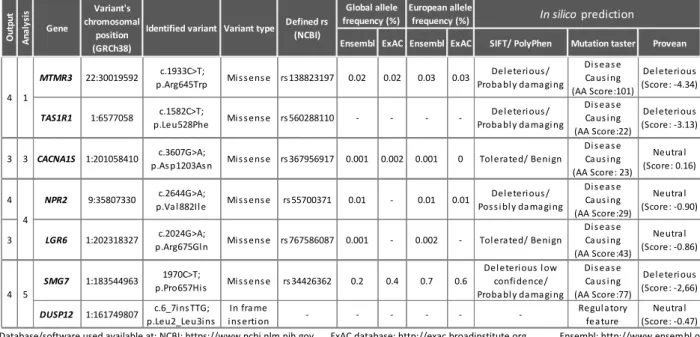
obtained for each output. ... 15 Table 3.1 - Characterization of the selected variants after application of selection criteria, review of
mutation frequency and in silico analysis. ... 37 Table 3.2 – Results of the segregation study of the selected variants from analysis 1.. ... 38 Table 3.3 - Results of the segregation study of the selected variants from analysis 3.. ... 39 Table 3.4 - Characterization of the selected variants that revealed a segregation pattern with the disease
according to each analysis. ... 40 Table 3.5 – Results from the selection of amplicons derived from CNV analysis. ... 41 Table 3.6 - Characterization of the most relevant variants obtained in the mutational analysis of the
MTMR3 gene, for the 34 index patients of FCCTX and FCCTX-like families without an identified mutation in the MMR genes. ... 43 Table 3.7 - Characterization of the most relevant variants obtained in the mutational analysis of the
TAS1R1 gene, for the 26 index patients of FCCTX and FCCTX-like families without an identified mutation in the MMR genes. ... 44
LIST OF ABBREVIATIONS
AC Amsterdam criteria
APC Adenomatous polyposis coli
BER Base excision repair
BMPR1A Bone morphogenetic protein
receptor type 1A
CACNA1S Calcium voltage-gated
channel subunit alpha1 S
cDNA Complementary DNA
cGMP Cyclic guanosine
monophosphate
CIMP CpG island methylator
phenotype
CIN Chromosomal instability
CNV Copy number variation
CRC Colorectal cancer Ct Threshold cycle DCC DCC netrin 1 receptor ddH2O Double-distilled water ddNTP Dideoxynucleoside triphosphate dNTP Deoxynucleotide triphosphate
DUSP12 Dual specificity
phosphatase 12
EDTA Ethylenediamine tetraacetic
acid
EPCAM Epithelial cell adhesion
molecule
FCCTX Familial colorectal cancer
type X
FFPE Formalin-fixed
paraffin-embedded
GAPDH
Glyceraldehyde-3-phosphate dehydrogenase
GIMAP1 GTPase, IMAP family
member 1 GTP Guanosine triphosphate HNPCC Hereditary non-polyposis colorectal cancer JPS Juvenile polyposis syndrome
KRAS KRAS proto-oncogene
LGR6 Leucine rich repeat
containing G protein-coupled receptor 6
LOH Loss of heterozygosity
LS Lynch syndrome
MAP MUTYH-associated
polyposis
MAPK1 (ERK2) Mitogen-activated protein kinase 1
MAPK3 (ERK1) Mitogen-activated protein kinase 3 MGMT O-6-methylguanine-DNA methyltransferase MHC Major histocompatibility complex MLH1 MutL Homolog 1 MMR Mismatch repair MSH2 MutS Homolog 2 MSH3 MutS Homolog 3 MSH6 MutS Homolog 6
MSI Microsatellite instability
MSI-H Microsatellite instability -low
MSI-L Microsatellite instability
-high
MSS Microsatellite stable
MTMR3 Myotubularin related protein
3
mTOR Mechanistic target of
rapamycin
mTORC1 Mechanistic target of
rapamycin complex 1
NGS Next-generation sequencing
NPR2 Natriuretic peptide receptor
2
PCR Polymerase chain reaction
PJS Peutz-Jeghers syndrome
PMS1 PMS1 Homolog 1
PMS2 PMS1 Homolog 2
POLD1 DNA polymerase delta 1
PtdIns(3,5)P2 Phosphatidylinositol
3,5-biphosphate
PtdIns3P Phosphatidylinositol
3-phosphate
PTT Protein truncation test
qPCR Quantitative PCR
RNF213 Ring finger protein 213
RPS20 Ribosomal protein S20
RT Reverse transcription
RYR1 Ryanodine receptor 1
SD Standard deviation
SDS Sodium dodecyl sulfate
SDS-PAGE Sodium dodecyl
sulfate-polyacrylamide gel electrophoresis
SEMA4A Semaphorin 4A
SMAD2 SMAD family member 2
SMAD4 SMAD family member 4
SMG7 SMG7, nonsense mediated
mRNA decay factor
SNP Single-nucleotide
polymorphism
SP Serrated polyposis
STK11 Serine threonine kinase 11
TAS1R1 Taste 1 receptor member 1
TBE Tris-Borate-EDTA
TCF T-cell factor
TGF-β Transforming growth factor
beta
TP53 Tumor protein p53
TPP2 Tripeptidyl peptidase 2
TSG Tumor suppressor gene
TSG- Tumor suppressor gene
negative
TSG+ Tumor suppressor gene
positive
WES Whole exome sequencing
Wt Wild type
LIST OF UNITS
% (w/v) Weight per volume percentage
°C Degrees Celsius bp Base pair Ci Currie kDa Kilodalton kb Kilobases Tm Melting temperature V Volts mA Milliamperes U Units
L; mL; μL Liter; milliliter (10-3L); microliter (10-6L)
M; mM; μM; nM Molar (mol/L); milimolar (10-3 M); micromolar (10-6 M); nanomolar (10-9M)
1. INTRODUCTION
1.1 Colorectal cancer
Colorectal cancer (CRC) is the third most common cancer and the fourth most common cause of cancer-related deaths worldwide. (Ferlay et al. 2013) In Portugal, CRC has the second highest incidence after breast cancer in female and prostate cancer in men, being the second cause of cancer-related deaths (Miranda et al. 2016). CRC has a low incidence at ages younger than 50 years, but strongly increases with age, having a median age at diagnosis of 70 years in developed countries. (Brenner et al. 2014)
The pathogenesis of CRC is very complex and diverse and is also influenced by multiple factors, some of which are related to genetic predisposition, while others are attributed to unhealthy lifestyle factors. Several epidemiological studies have confirmed the involvement of numerous environmental and dietary factors, such as cigarette smoking, alcohol abuse, a diet high in fat and low in fiber, a sedentary lifestyle and obesity. (Colussi et al. 2013)
About 75% of patients with CRC have sporadic disease with no apparent evidence of having inherited the disorder. The remaining 25% of patients have a family history of CRC that suggests a hereditary contribution, common environmental exposures within the family, or a combination of both. Genetic pathogenic variants have been identified as the cause of inherited cancer risk in some colon cancer–prone families, but these pathogenic variants are estimated to account for only 5% of all CRC. (Daly et al. 2017) The remaining 20% of inherited CRC cases do not have a clearly defined mechanism and likely result from a combination of gene polymorphisms and mutations, alterations in multiple susceptibility loci and environmental influences. (Popek and Tsikitis 2011)
To develop accurate risk assessment and more precise screening approaches, a clarification of predisposing genes and a better understanding of the pathways and molecular events that drive CRC carcinogenesis is essential. (Daly et al. 2017)
1.2 Molecular events associated with colorectal carcinogenesis
CRC results from the accumulation of both acquired genetic and epigenetic changes that transform normal glandular epithelium into invasive adenocarcinoma (Lao and Grady 2011). Presently, CRC can be separated into three categories based on similar molecular genetic features, suggesting divergent pathways of tumorigenesis: chromosomal instability (CIN), microsatellite instability (MSI), and CpG island methylator phenotype (CIMP). (Daly et al. 2017)
1.2.1 Chromosomal instability pathway
The majority of CRCs develop through the CIN pathway which is characterized by widespread alterations in chromosome number (aneuploidy) and frequent detectable losses at the molecular level of portions of chromosomes (loss of heterozygosity - LOH), such as 5q, 18q, and 17p. The steps involved
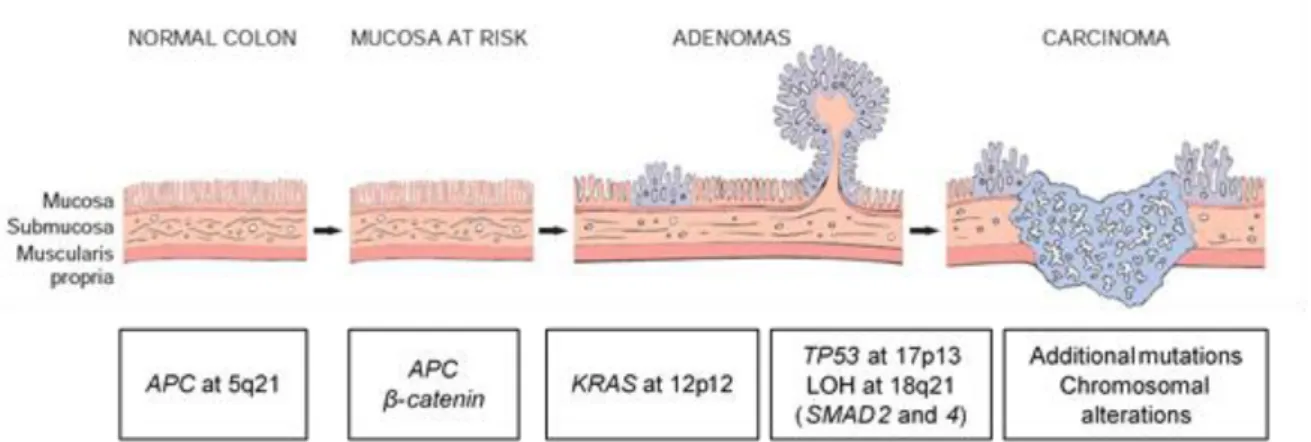
in this process were first described in the classic adenoma-carcinoma progression model proposed by Fearon and Vogelstein in 1990. (Daly et al. 2017)
The classic adenoma-carcinoma sequence (figure 1.1), accounts for approximately 80% of sporadic colon tumors and typically includes mutation of the APC (adenomatous polyposis coli) tumor suppressor gene early in the neoplastic process. Both copies of the APC gene must be functionally inactivated, either by mutation or epigenetic events, for adenomas to develop. APC is a component of the WNT signaling pathway (figure 1.2) and a key negative regulator of β-catenin since its normal protein promotes β-catenin degradation. With loss of APC function, β-catenin accumulates and translocates to the nucleus, where it forms a complex with the DNA-binding factor TCF (T-cell factor) and activates the transcription of genes that promote proliferation. Additional mutations accumulate, including activating mutations in KRAS (KRAS proto-oncogene), a GTP (guanosine triphosphate)-binding protein that promotes growth and prevents apoptosis through the downstream RAS-RAF-MEK-ERK pathway. Neoplastic progression is also associated with mutations in other tumor suppressor genes such as those encoding SMAD2 (SMAD family member 2) and SMAD4 (SMAD family member 4) (18q), which are effectors of TGF-β (transforming growth factor beta) signaling. Impairment of TP53 (tumor protein p53), usually through allelic loss of 17p, often occurs at later stages of tumor progression. (Worthley et al. 2010) (Kumar et al. 2015)
1.2.2 Microsatellite instability pathway
The microsatellite instability (MSI) pathway represents a form of genomic instability involved in the genesis of approximately 15% of sporadic colorectal cancer and in the majority of hereditary nonpolyposis colorectal cancer (HNPCC) syndrome. (Colussi et al. 2013)
Microsatellites are short nucleotide repeat sequences scattered throughout the genome, which are particularly susceptible to slippage by DNA polymerase during replication, resulting in the formation of an insertion–deletion loop that can be identified and corrected by the DNA mismatch repair (MMR) system. If this loop is not repaired it can result in frameshift mutations, which can produce a truncated, nonfunctional protein. MSI is caused by the inactivity of the MMR system, which acts like a proofing machine to increase the fidelity of DNA replications by identifications and direct repair of mismatched nucleotides. The MMR system is composed of multiple interacting proteins including the human MSH2 (MutS Homolog 2), MLH1 (MutL Homolog 1), MSH6 (MutS Homolog 6), MSH3 (MutS Homolog 3), PMS1 (PMS1 Homolog 1) and PMS2 (PMS1 Homolog 2). Inactivation of the MMR system arises from mutations in the MSH2, MLH1, MSH6 and PMS2 genes or by hypermethylation of the MLH1 gene promoter. (Colussi et al. 2013) (Worthley et al. 2010)
The rate of adenoma to carcinoma progression appears to be faster in tumors were the MMR system seems to be inactivated. (Daly et al. 2017)
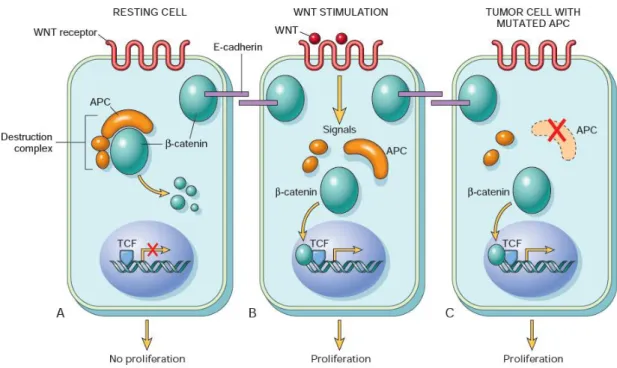
Figure 1.2 - Schematic overview of the WNT signaling pathway and its role in colorectal cancer. (A) In resting colonic epithelial cells (not exposed to WNT), β-catenin forms a complex containing the APC protein, which leads to the destruction of β-catenin, and intracellular levels of β-catenin are low. (B) When normal colonic epithelial cells are stimulated by WNT molecules, the destruction complex is deactivated, β-catenin degradation does not occur, and cytoplasmic levels increase. β-β-catenin translocates to the nucleus, where it binds to TCF, a transcription factor that activates the transcription of genes that promote proliferation. (C) When APC is mutated or absent, as frequently occurs in colonic polyps and cancer, the destruction of β-catenin cannot occur. β-β-catenin translocates to the nucleus and coactivates genes that promote entry into the cell cycle and proliferation, and cells behave as if they are under constant stimulation by the WNT pathway. (Adapted from: Kumar et al. 2015)
1.2.3 CpG island methylator phenotype pathway
A third pathway through which CRC progresses is the CpG island methylator phenotype (CIMP). Regions with a high frequency of cytosine nucleotide followed by a guanine nucleotide (CpG dinucleotide) are termed CpG islands, and are found in the promoter regions of approximately 50% of all genes. The addition of a methyl group to cytosine bases (DNA methylation) in these CpG regions has been associated with silencing of genes involved in cell cycle regulation, apoptosis, angiogenesis, DNA repair, invasion and adhesion. (Roper and Hung 2013) (Colussi et al. 2013)
Studies of the epigenomes of CRCs have identified groups of CRCs with distinct epigenotypes. These epigenotypes have unique associations with a variety of mutations and with the genomic instability status of the cancer. The epigenotypes that have been proposed include different classes of CIMP, which is determined by the proportion of methylated loci detected. (Lao and Grady 2011) Shen and colleagues have suggested that CIMP CRCs can be divided into two distinct classes, CIMP1 and CIMP2. CIMP1 tumors are often microsatellite unstable (80%) with BRAF (B-Raf proto-oncogene) mutations (53%), whereas CIMP2 tumors have KRAS mutations (92%), but rarely have MSI or BRAF or TP53 mutations. Tumors that do not have CIMP usually have a high frequency of TP53 mutations (71%) and an intermediate frequency of KRAS mutations (33%) (Shen et al. 2007). Another study divided the CIMP phenotype into CIMP-high and CIMP-low. CIMP-high exhibits an exceptionally high frequency of cancer-specific DNA hypermethylation, a strong association with methylated MLH1 and mutant BRAF (p.V600E) and CIMP-low is associated with mutant KRAS and lacks in presenting DNA methylation at a unique set of CpG sites. (Hinoue et al. 2012)
Although CIMP tumors and the distinct epigenotypes described above, do seem to represent distinct subsets of CRCs, there is still no agreement and validation of a gene methylation panel for designating the epigenotypes. (Lao and Grady 2011)
1.3 Hereditary colorectal cancer syndromes
As previously mentioned, is estimated that about 25% of colorectal cancers are familial with 5% to 6% related to a known genetic syndrome. The hereditary CRCs are broadly divided into polyposis and nonpolyposis syndromes. Individuals with hereditary CRC syndromes are at risk for earlier development of cancer, increased risk of metachronous cancers, and extracolonic manifestations. As such, careful integration of clinical features, family history, endoscopic findings, molecular pathology, and genetic testing are crucial components in establishing the diagnosis of a hereditary cancer syndrome. Recognition and diagnosis of these syndromes is critical for prevention, early detection and treatment of associated malignancies to reduce associated morbidity and mortality. (Gala and Chung 2015) (Wells and Wise 2017)
1.3.1 Polyposis colorectal cancer syndromes
1.3.1.1 Familial adenomatous polyposis
Familial adenomatous polyposis (FAP) is an autosomal-dominant inherited disorder characterized by the early onset of multiple adenomas throughout the colon and rectum. It represents approximately 1% of all CRC cases and is the most common gastrointestinal polyposis syndrome. Two major phenotypes have been described: classic FAP, characterized by hundreds to thousands of adenomas and a risk of CRC of almost 100%; and attenuated FAP (AFAP), characterized by a smaller number of polyps (20–100) and a later age of onset. In many patients, extracolonic manifestations are present, including gastric and duodenal polyps, desmoid tumors, thyroidal and brain tumors, osteomas, congenital hypertrophy of the retinal pigmented epithelium, supernumerary teeth, and epidermoid cysts. (Carballal et al. 2014)
FAP and attenuated FAP are caused by germline mutations in the APC gene, associated with the CIN pathway. De novo APC mutations are responsible for approximately 25% of FAP cases. In addition, approximately 20% of individuals with an apparent de novo APC mutation have somatic mosaicism The location of the germline mutation within APC has been associated with the severity of colonic polyposis, the degree of cancer risk, the age at diagnosis, the presence and/or frequency of extra-colonic malignant and non-malignant neoplasms and with the spectra of somatic mutations that lead to tumor formation. (Jasperson et al. 2010) (Albuquerque et al. 2002)
1.3.1.2 MUTYH-associated polyposis
MUTYH-associated polyposis (MAP) is an autosomal recessive disorder characterized by multiple adenomatous polyps, that is caused by mutations in the MUTYH (mutY DNA glycosylase) gene. The MUTYH gene is a base excision repair (BER) gene and acts in an autosomal recessive manner, with bi-allelic mutations necessary for expression of the phenotype. Although MAP is often associated with a polyposis phenotype, studies have reported bi-allelic mutation carriers displaying young-onset CRC in the absence of polyps, and excess of other extra-intestinal tumors. (Hisamuddin and Yang 2006) (Stoffel and Boland 2015)
1.3.1.3 Hamartomatous polyposis
Intestinal hamartomatous polyposis syndromes are characterized by an overgrowth of cells native to the area in which they normally occur. Peutz-Jeghers syndrome and juvenile polyposis syndrome are hamartomatous polyposis conditions that are both associated with an increased risk for colorectal cancer. (Carballal et al. 2014)
Peutz–Jeghers syndrome (PJS) is an autosomal dominant disorder characterized by melanocytic macules of the lips, buccal mucosa, and digits, multiple gastrointestinal hamartomatous polyps, and an increased risk of various neoplasms, including those of the gastrointestinal tract and in extra intestinal sites: breast, ovary, and testicles. Germline mutations of the gene encoding the tumor suppressor gene STK11 (serine threonine kinase 11), are found in 70% of the patients with PJS. However, not all families
with PJS are linked to this locus, suggesting that additional genes are involved in its pathogenesis. (Hisamuddin and Yang 2006)
Juvenile polyposis syndrome (JPS) is a genetically heterogeneous, rare, childhood to early adult onset, autosomal dominant disease that is characterized by the presence of hamartomatous polyps throughout the entire GI tract, mainly in the colon (98%) and stomach (14%). Individuals with JPS have an increased risk for gastric cancer and CRC, with a lifetime risk of 40–50%. A diagnosis of JPS is considered for anyone who fulfills one of the following criteria: five or more colonic juvenile polyps; multiple juvenile polyps throughout the GI tract; or any number of juvenile polyps with a family history of JPS. Germline mutations in the SMAD4 or BMPR1A (bone morphogenetic protein receptor type 1A) genes, both involved in the TGF-β signaling pathway, are identified in approximately 50% of cases. (Carballal et al. 2014)
1.3.1.4 Serrated polyposis
Serrated polyposis (SP), initially described as hyperplastic polyposis, is a rare condition characterized by a predisposition to serrated polyps, an increased risk for colorectal and possibly some other extracolonic neoplasms. Serrated polyps include different subtypes of lesions (hyperplastic, sessile serrated polyps/adenomas and traditional serrated adenomas) with a common histological feature: the ‘sawtooth’ appearance in the crypt epithelium. (Carballal et al. 2014)
Diagnosis of SP is based on specific clinical criteria outlined by the World Health Organization, that contemplate the number, size and location of serrated polyps in the colon. SP has largely been considered a genetic disease, but its genetic base and the pattern of inheritance remains unknown and both autosomal recessive and autosomal dominant patterns have been proposed. (Guarinos et al. 2012)
1.3.2 Nonpolyposis colorectal cancer syndromes
Hereditary non-polyposis colorectal cancer (HNPCC) is the most prevalent form of hereditary CRC, accounting for at least 2%to 3%of all CRCs, being a dominantly inherited syndrome characterized by significantly increased risks for colon cancer as well as for cancers of the endometrium, stomach, small intestine, hepatobiliary system, kidney, ureter, and ovary. (Wells and Wise 2017) (Lindor 2009a)
Establishing the Amsterdam criteria (AC) was essential to define HNPCC. The AC were introduced for uniform classification based on family history. In 1991 the International Collaborative Group on hereditary nonpolyposis colorectal cancer had established the AC-I (table 1.1). These guidelines turn out to be too strict and could exclude small families or those presenting HNPCC-associated tumors. In response to its stringency, in 1999, the extended AC-II criteria were proposed (table1.1). (Llor et al. 2005)
HNPCC families fall into 2 categories: Lynch syndrome, associated with hereditary defects in DNA MMR genes, and familial colorectal cancer type X, with no detectable mutation in DNA MMR genes. (Nieminen et al. 2011)
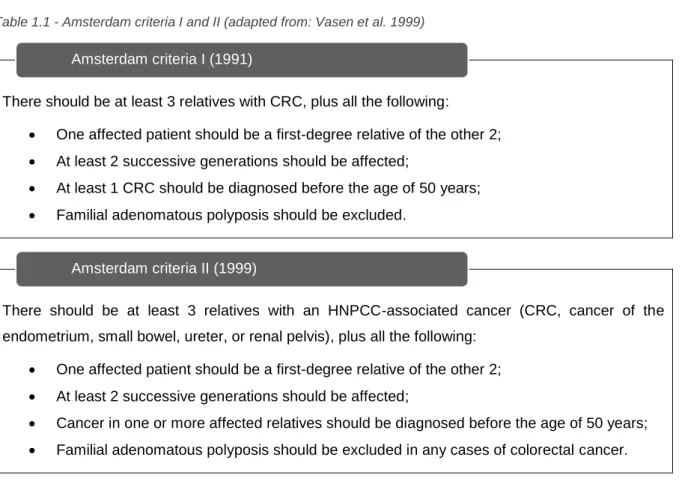
Table 1.1 - Amsterdam criteria I and II (adapted from: Vasen et al. 1999)
There should be at least 3 relatives with CRC, plus all the following:
• One affected patient should be a first-degree relative of the other 2; • At least 2 successive generations should be affected;
• At least 1 CRC should be diagnosed before the age of 50 years; • Familial adenomatous polyposis should be excluded.
There should be at least 3 relatives with an HNPCC-associated cancer (CRC, cancer of the endometrium, small bowel, ureter, or renal pelvis), plus all the following:
• One affected patient should be a first-degree relative of the other 2; • At least 2 successive generations should be affected;
• Cancer in one or more affected relatives should be diagnosed before the age of 50 years; • Familial adenomatous polyposis should be excluded in any cases of colorectal cancer.
1.3.2.1 Lynch syndrome
Lynch syndrome (LS) is the most common hereditary CRC syndrome, accounting for 1-3% of all CRC cases. LS is an autosomal dominant condition characterized by a germline mutation in one of the MMR genes and a predisposition to develop colorectal and endometrial cancer, among other less frequent tumors, at an early onset (~45 years). (Carballal et al. 2014)
LS is the result of a germline mutation in a class of genes involved in the DNA MMR system, previously described in 1.2.2, including MSH2, MLH1, MSH6, and PMS2. Approximately 80% of mutations are identified in the MLH1 and MSH2 genes, 10–12% in the MSH6 gene, and PMS2 may account for 2–3%. (Jasperson et al. 2010) Recently, EPCAM (Epithelial cell adhesion molecule) germline deletions in the 3′ region, that give rise to EpCAM-MSH2 fusion transcripts, and promoter hypermethylation of MSH2 in tumors have also been implied in LS. (Kovacs et al. 2009)
The AC (I and II) are used in clinical practice to identify individuals at risk for Lynch syndrome who require further evaluation. If either of these criteria is met, genetic testing to detect a mutation in one of the mismatch repair genes can be performed. (Burt 2007) However, AC (I and II) turn out to be too strict and their limited sensitivity hampered decisions of choosing which patients should undergo genetic testing. (Umar et al. 2004) Therefore, the Bethesda guidelines (table 1.2) were developed, in which clinical and pathological features are used to determine which colon cancer specimens should be tested for microsatellite instability, with a goal of identifying patients with germline mutations in DNA MMR genes. (Boland 2005)
Amsterdam criteria I (1991)
To access tumor microsatellite instability (MSI), a standardized panel of microsatellites referred to as the Bethesda panel is used, this panel comprises two mononucleotide (BAT25 and BAT26) and three dinucleotide microsatellites markers (D5S346, D2S123, and D17S250). Considerable MSI or MSI-high (MSI-H) is defined as MSI at ≥2 (40%) of the five specified markers, MSI-low (MSI-L) as MSI only at one marker, and microsatellite stable (MSS) when no instability is demonstrated at these markers. (Worthley et al. 2010)
Individuals with LS carry a heterozygous germline MMR mutation and, for malignancy to occur, a second copy of the affected MMR gene must be somatically inactivated. Loss of function of the MMR system may lead to DNA replication errors, especially in microsatellites, which can occur in tumor suppressor genes or proto-oncogenes leading to carcinogenesis. DNA replication errors are propagated through daughter cells, leading to errors in microsatellites, making them unstable (MSI-H). (Carballal et al. 2014) (Wells and Wise 2017)
Table 1.2 - The Bethesda guidelines (adapted from: Giardiello et al. 2014)
Tumors from individuals should be tested for MSI in the following situations:
1. CRC diagnosed before the age of 50 years;
2. Presence of synchronous or metachronous CRC or other HNPCC-associated tumors
(colorectal, endometrium, stomach, ovary, pancreas, ureter, renal pelvis, biliary tract, brain, small bowel, sebaceous glands, and kerotoacanthomas), regardless of age.
3. CRC with MSI-high pathologic-associated features (Crohn-like lymphocytic reaction,
mucinous/signet cell differentiation, or medullary growth pattern) diagnosed before the age of 60 years;
4. CRC diagnosed in one or more first-degree relatives with an HNPCC-related tumor, with one
of the cancers being diagnosed before the age of 50 years.
5. CRC diagnosed in two or more first- or second-degree relatives with HNPCC-related tumors,
regardless of age.
1.3.2.2 Familial colorectal cancer type X
In 2005, Lindor and co-workers reported a subset of families who fulfill AC but have no evidence of a DNA MMR defect, tumors did not present microsatellite instability and did not share the same cancer incidence as families with Lynch syndrome. Relatives in such families had a lower incidence of colorectal cancer than those in families with Lynch syndrome, and there was no evident risk for extracolonic tumors. These non-Lynch syndrome clusters of CRC were termed familial colorectal cancer type X (FCCTX). (Lindor et al. 2005) Table 1.3 compares and contrasts LS with FCCTX.
Table 1.3 – Contrasts between LS and FCCTX. (adapted from Lindor 2009b)
LS
FCCTX
CRC
Cancer risk
Very high
Modestly increased
Age of onset
45 years (average)
50-60 years
Usual location
Proximal colon
Distal colon
Polyps
Few
More
Other cancers
Endometrial risk
Very high
Low
Other cancer sites
Many
None known
MMR genes
Germline
Mutations found
No mutations found
Tumor
MSI
MSS
Tumor staining
Loss of MMR expression
Normal expression
As the “type X” label implies, the genetic etiology for FCCTX is largely unknown. Although the identification of the genetic basis of FCCTX has been a topic of intensive research, the cause for the increased risk of cancer in this group remains unknown and evidence suggests that it is a heterogenous grouping. (Carballal et al. 2014) (Carethers and Stoffel 2015) It likely includes some families that have a random aggregation of a common tumor; some families may be attributable to shared lifestyle factors, polygenic predisposition and some families likely have a yet to be defined single gene disorders. (Lindor 2009b)
Several linkage studies, next generation sequencing (NGS) and association studies, have been conducted to discover predisposing genes behind FCCTX. A germline mutation in RPS20 (ribosomal protein S20) (c.147dupA), encoding an ribosomal RNA maturation protein has been identified in a FCCTX family. (Nieminen et al. 2014) The product of RPS20 is required during the late steps of 18S ribosomal RNA formation, and RPS20 has been associated to TP53 stabilization. Conversely, the constant activation of TP53 consecutive to ribosomal stress induced by RPS20 mutation could favor, in the long run, the selection of cells that escape regulation by TP53. (Nieminen et al. 2014) Three different missense mutations (p.Val78Met, p.Gly484Ala and p.Ser326Phe) in the SEMA4A (semaphorin 4A) gene were also identified in three FCCX families. (Schulz et al. 2014) The p.Val78Met variant demonstrated significantly increased MAPK/Erk and PI3K/Akt signalling activation as well as cell cycle progression in HCT-116 CRC cells. (Schulz et al. 2014) However, the importance of this gene seems to be controversial since another study failed to find evidences to support variations in SEMA4A as a determinant of FCCTX risk. (Kinnersley et al. 2016) Another gene that has been referred in FCCTX is the BMPR1A gene (typically associated with juvenile polyposis), that encodes a protein receptor that
belongs to a family of serine/threonine kinases, where have been reported 2 variants (p.Gludel88 and c.68-10_68+14del). (Nieminen et al. 2011) A variant identified in the POLD1 (DNA polymerase delta 1) gene (p.Pro300Leu) was also found within a FCCTX family. (Duarte 2015)
Despite the efforts made towards a better understanding and characterization of FCCTX, additional studies are still necessary to identify the genetic basis associated with this syndrome. Thus, providing a better screening, surveillance and maintenance of the families.
1.4 Molecular characterization and identification of novel susceptibility
genes/variants for FCCTX
1.4.1 Molecular characterization of a group of FCCTX families
In order to achieve a better understanding of the FCCTX syndrome, the Colon Pathology Group from IPOLFG, E.P.E performed a study that aimed to characterize a group of FCCTX families at clinical and molecular level by evaluating the involvement of the CIN pathway in tumors from these families. (Francisco et al. 2011) For this purpose, 24 tumors from 15 FCCTX families were analyzed for LOH in known tumor suppressor gene (TSG) loci (APC, TP53, SMAD4 and DCC (DCC netrin 1 receptor), methylation status of MMR genes and MGMT (O-6-methylguanine-DNA methyltransferase), and also APC and KRAS somatic mutations. These analyzes revealed two distinct molecular entities among the tumors of the FCCTX families: one, more prevalent, where tumors presented loss of TSG loci (72%) - TSG+ (tumor suppressor gene positive), suggesting the involvement of the CIN pathway, and a lesser
predominant one, with no evidence of TSG loss (28%) - TSG- (tumor suppressor gene negative). Within
the TSG+ subtype tumors also presented frequent APC and KRAS somatic mutations, as well as
frequent gene promoter methylation, while almost no promoter methylation was found in the TSG
-subtype. (Francisco et al. 2011)
1.4.2 Identification of novel FCCTX susceptibility loci through linkage analysis
Regarding this FCCTX comprehensive study, a project was developed by the Colon Pathology Group to map new genetic susceptibility loci to FCCTX. Thus, a genome-wide linkage study using 50,000 single-nucleotide polymorphisms (SNPs) array and a subsequent LOH analysis using microsatellite markers, was performed in the 2 most informative FCCTX families, one with TGS+ tumors
and one with TGS- tumors. This analysis allowed the identification of 2 suggestive chromosomal regions
(13q and 21q) within the TSG+ family that may act as potential regions of susceptibility. While for the
TSG- family there was no significant results. (Pereira 2013) (Belo 2010)
Using more microsatellite markers to restrain the identified regions, as well as additional samples of FCCTX tumors, it was possible to determine a minimum region of LOH of 0.84Mb and of 1.3Mb, for regions 13q and 21q respectively (13q32-33 and 21q11). Considering the histological features of the analyzed FCCTX tumors, it was also found that LOH on chromosome 13 were more frequent in adenomas, whereas losses on chromosome 21 were more frequent in carcinomas, suggesting that
events in 13q occur at the level of tumor initiation while events in 21q appear at the level of tumor progression. (Pereira 2013)
Among the various genes contained in these regions of interest, some candidate genes for germline mutation analysis were selected according to the following criteria: genes expressed in the colon; genes encoding proteins involved directly or indirectly in cellular processes associated with tumorigenesis and gene that were not reported as the cause of other pathologies. (Saramago 2014) (Pereira 2014) Using these criteria a set of 13 candidate genes were chosen for germline mutation analysis within the 13q region and 3 for the 21q region. From this large set of genes only few remain as possible contributors for FCCTX, since several studies performed by the Colon Pathology Group have excluded or enhanced their possible involvement. One of the remaining genes that may be involved in FCCTX susceptibility is the Tripeptidyl peptidase 2 (TPP2) located in 13q33.1 (figure 1.3), whose study will be continued at the present work.
1.4.2.1 Tripeptidyl peptidase 2
TPP2 is an aminopeptidase that removes tripeptides from the free N terminus of longer peptides and is regarded as a housekeeping enzyme of eukaryotic cells. It constitutes the largest cytosolic protease complex in eukaryotes and it plays a role in the ubiquitin-proteasome pathway downstream of the proteasome as well as in the production and destruction of MHC (major histocompatibility complex) class I antigens and degradation of neuropeptides. (Preta et al. 2010) TPP2 has been reported to play a role in various biological processes, including antigen processing, cell growth, DNA damage repair and carcinogenesis, fat metabolism, feeding behavior, obesity and most recently in the control of MAPK3 (mitogen-activated protein kinase 3) and MAPK1 (mitogen-activated protein kinase 1) phosphorylation. (Wiemhoefer et al. 2015) (Peters et al. 2011)
The TPP2 gene has two protein coding transcripts described in the Ensembl database (Ensembl: http://www.ensembl.org/index.html, accessed in 2017). One wild type (wt) formed by 29 exons and an alternative transcript, that has a different start codon and the presence of an additional 39 bp exon between exons 23 and 24, named 23a.
Molecular analysis of the TPP2 gene was performed in previous studies of the project described above, 1.4.1.1. A mutational analysis at the mRNA level revealed a new transcript, not described to Figure 1.3 – Schematic view of chromosome 13. Localization of the minimum region of LOH identified through linkage analysis and the genomic location of TPP2. (Adapted from: Genecards (http://www.genecards.org/))
Chromosome 13 Minimum LOH region
date, resulting from an insertion of a 72 bp between exons 13 and 14. (Pereira 2013) This alternative 72 bp exon will be described as 13a throughout this project.
This novel transcript was evaluated in a study conducted by the Colon Pathology Group, where it was observed an increased expression of the 13a transcript in blood samples in 71% of the FCCTX individuals, 69% in LS individuals and 35% in healthy individuals. This increased expression was also followed by a considerable wt transcript reduction in 43%, 38% and 18% of the FCCTX, LS and healthy individuals, respectively. Thus, either 13a overexpression and reduction of wt, or just overexpression of 13a, was more frequent in individuals with FCCTX and LS than in the group of healthy individuals. (Pereira 2014) However, it was unknow if the expression of this transcript would still be observed in the colon. Thus, samples from carcinomas, adenomas and normal mucosa were included in the TPP2 gene expression analysis. This study showed that the expression of the alternative transcript was significantly reduced when compared to the wt in tissue samples, showing a differential expression between blood and colon samples. (Saramago 2014) However this study was performed in a small and limited number of samples, thus, there is the need to include a larger number of samples in order to confirm these findings.
Given the role of TPP2 within the immune response, these data taken together suggest that this alternative transcript could play a role in FCCTX susceptibility, however further studies are needed to discriminate the role of the alternative transcript when compared to the wt transcript, both in blood and tissue samples.
1.4.3 Identification of novel FCCTX susceptibility variants by whole genome
sequencing
Recent advances in the development of sequencing technologies, namely next-generation sequencing (NGS), have provided unprecedented possibilities for genetic analyses. The ability cost-effectively to generate genome-wide sequencing data with deep coverage in a short time frame is replacing approaches that focus on specific regions for gene discovery and clinical testing. While whole genome sequencing remains expensive for most applications, whole exome sequencing (WES), a technique that focuses only on the protein-coding portion of the genome, places many advantages of the emerging technologies into researcher’s hands. Recent studies using this technology have uncovered new variants (and genes) for a number of previously unresolved Mendelian disorders. (Petersen et al. 2017) (Majewski et al. 2011)
NGS platforms share a common technological feature: massively parallel sequencing of clonally amplified or single DNA molecules that are spatially separated in a flow cell. This design is a paradigm shift from that of Sanger sequencing and has allowed scaling-up by orders of magnitude. In NGS, sequencing is performed by repeated cycles of polymerase-mediated nucleotide extensions. As a massively parallel process, NGS generates hundreds of megabases to gigabases of nucleotide sequence from a single instrument run. (Majewski et al. 2011)
Following the project that aimed the identification of novel genes for susceptibility to FCCTX, described in 1.4.1 and 1.4.1.1, the TSG- family (designated L56) was selected for a WES analysis, since
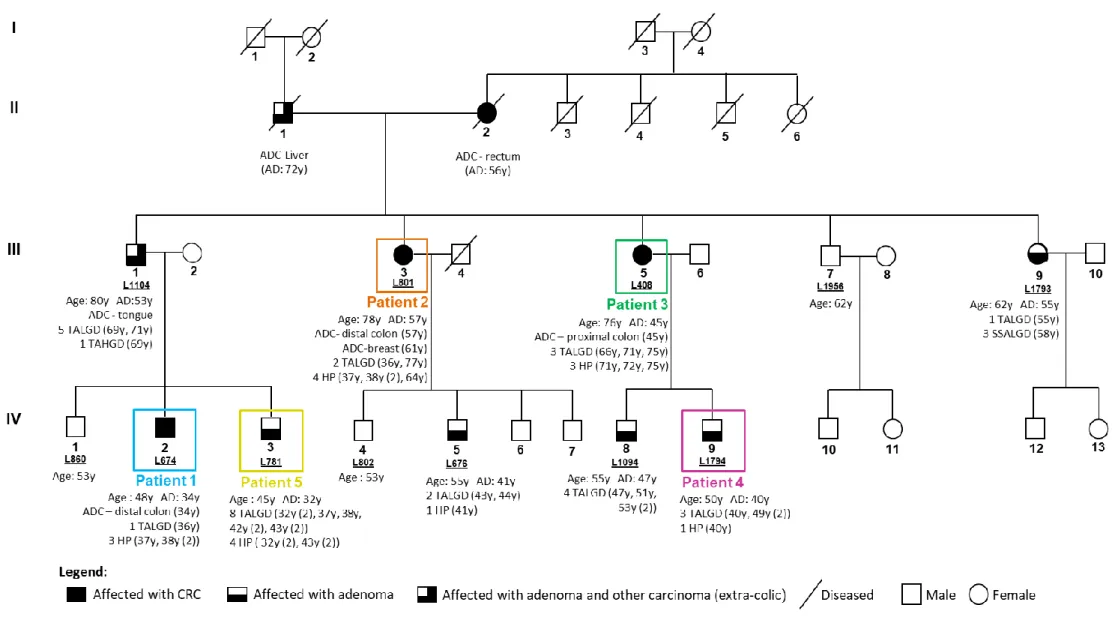
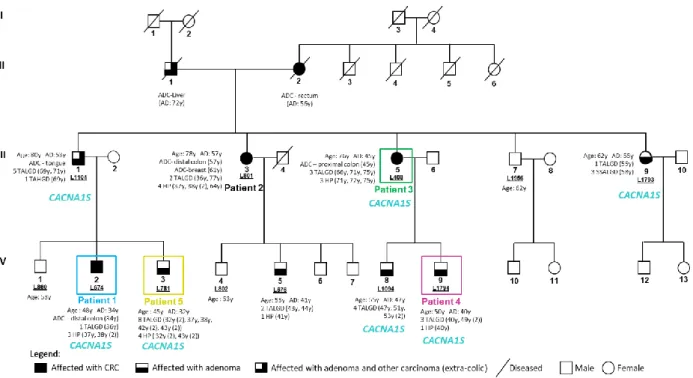
no significant results were obtained through the linkage analysis. Genomic DNA samples from 5 patients of the family were selected for a WES analysis (using Agilent SureSelect Exome version 4 capture kit (Agilent) and Illumina TruSeq v3 protocol sample prep in a Hiseq2500 platform (Illumina), performed by Center for Biomics at the Erasmus University Medical Center- Rotterdam, Netherlands). This analysis aimed to identify the variants shared by the five individuals and evaluate their pathogenicity and association with the disease. Family pedigree as well as the identification of the patients subjected to WES analysis are represented in figure 1.4.
In order to maximize the identification of potential pathogenic germline mutations and given the high percentage of sporadic CRC in the population, the bioinformatic analysis was built to comprise all possibilities and therefore it was subdivided into five analyzes, each with a unique combination of the patients who shared variants (table 1.4). Thus, analysis 1 contained variants shared by all 5 patients, while the remaining analyzes contained variants shared only by four or three patients: analysis 2 excluded patient 4; analysis 3 excluded patient 2; analysis 4 excluded patients 2 and 4 and analysis 5 excluded patients 3 and 4. This exclusion of shared variants within some family members comes from the hypothesis that patients 2 and 3 may be potential phenocopies and therefore their phenotype may be a sporadic case and not attributed to the share of an inherited variant in the context of an FCCTX family. Patient 4 was also considered as a possible sporadic case because, when comparing the age of adenoma development in other relatives, this patient only started to develop adenomas at age 40.
The results of the five bioinformatic analyzes were provided by Bioinf2Bio Lda. using the GRCh38 reference genome and were organized into four outputs (format.xlsx), that contain descriptive information about the variants shared for each analysis, each output description can be found in table 1.5. Selection of possibly pathogenic variants that could justify the FCCTX phenotype in the L56 family was done using the variants provided by outputs 3 and 4 (table1.5). Although output 4 describes variants that present high impact according to the software SIFT (Kumar et al. 2009) and Polyphen-2 (Ramensky et al. 2002) and therefore describing the variants with the greatest pathogenic potential, output 3 analysis was also included in order to avoid the elimination of variants that may be equally important, excluded only by their scores in these software. (Magalhães 2016)
Figure 1.4 – Pedigree of the TSG- family - L56. Patients highlighted in colors were the ones selected for WES analysis. Only individuals with a laboratory identification number (LXXX or LXXXX) have biological material available. The age at diagnosis (AD, in years, y) and respective phenotypic characterization are described for the affected individuals. CA: current age; y: years; ADC: adenocarcinoma; TALGD: tubular adenoma with low-grade dysplasia; TAHGD: tubular adenoma with high-grade dysplasia; HP: hyperplastic polyp; SSALGD: sessile serrated adenoma with low-grade dysplasia.
Table 1.4 - Description of the strategy used in the 5 bioinformatic analyzes using the results obtained by WES for the selected patients from L56, and respective number of variants.
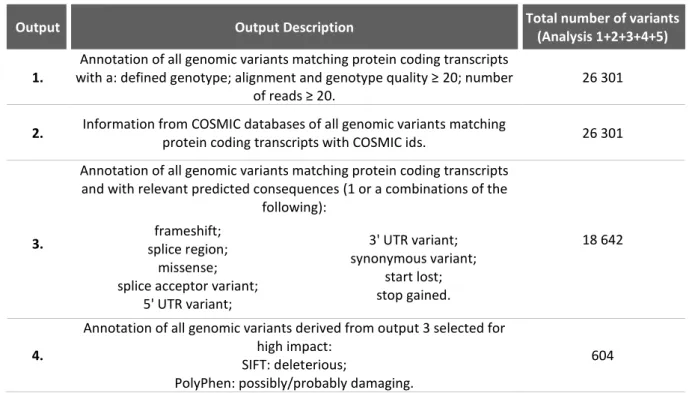
Table 1.5 - Description of the 4 outputs obtained after bioinformatic analysis and total number of variants obtained for each output.
Output Output Description Total number of variants
(Analysis 1+2+3+4+5)
1.
Annotation of all genomic variants matching protein coding transcripts with a: defined genotype; alignment and genotype quality ≥ 20; number
of reads ≥ 20.
26 301
2. Information from COSMIC databases of all genomic variants matching
protein coding transcripts with COSMIC ids. 26 301 Annotation of all genomic variants matching protein coding transcripts
and with relevant predicted consequences (1 or a combinations of the following):
18 642
3. splice region; frameshift;
missense; splice acceptor variant;
5' UTR variant; 3' UTR variant; synonymous variant; start lost; stop gained. 4.
Annotation of all genomic variants derived from output 3 selected for high impact:
SIFT: deleterious;
PolyPhen: possibly/probably damaging.
1.4.3.1 Selection of variants identified through whole exome sequencing analysis
In order to select potential pathogenic variants shared by the affected individuals of the L56 family, for the subsequent segregation study, exclusion criteria were established (figure 1.5), which were applied to the variants described in outputs 3 and 4.
The first criteria consisted in the exclusion of common variants obtained by bioinformatic analysis from three families of familial cancer (colon, thyroid and prostate) analyzed by WES that were included in the IPOFG, EPE project - Exome sequencing project/Familial and Individual cancer risk- identification of novel genes. The second criteria was used to eliminate variants that presented general population frequencies higher than 1%, since these are considered polymorphisms, followed by the exclusion of variants with a the mutated allele frequency, in two or more individuals, with values lower than 30%, which may represent possible artifacts that occurred during the sequencing process. The following criteria took into account the genotypes of the variants identified in the individuals of the family, that is, if they were detected in homozygosity or heterozygosity. Thus, and given the dominant transmission of CRC in the family, variants identified as homozygous for all or almost all individuals were excluded. Finally, the last criteria served to rule out truncating variants whose new stop codon was located at the end of the protein, since they gave rise to truncated proteins with similar size to the wild-type, therefore, with a low pathogenic potential. After applying these criteria to the two outputs (3 and 4), a total of 300 variants were obtained. (Magalhães 2016)
After the use of these exclusion criteria, in silico analysis was performed for all of the selected variants to restrict the number of variants and help predict their pathogenicity. General frequencies in the population were confirmed using 1000 Genomes (Auton et al. 2015), Exome Aggregation Consortium (ExAC) (ExAC: http://exac.broadinstitute.org/) (Lek et al. 2016) and Exome Variant Serve (EVS) (Exome Variant Server, NHLBI Exome Sequencing Project: http://evs.gs.washington.edu/EVS/) Figure 1.5 - Exclusion criteria used for the selection of variants for segregation studies with the disease within L56 family (Adapted from: Magalhães 2016).
Criteria 1
Variants in common with a prostate/thyroid analysis
Population allele frequencies higher than 1%
Criteria 2
Criteria 3
Criteria 4
Criteria 5
Mutated allele frequency lower than 30% within an individual
Truncated protein at the end of the protein or insertion of an amino acid just before the stop codon