NEW APPROACH TO E-MARKETING: BUILDING AND USING DIFFERENT
CUSTOMER PROFILES TO PERSONALIZE THE COMMUNICATION.
STILNEST CASE
Kristina Bučinskaitė
Project submitted as partial requirement for the conferral of
Master of Marketing
Supervisor: Miguel Jorge da Cruz Lage, Department of Marketing, Operation and Management, ISCTE-IUL
ii
Table of contents
Abstract ... iii
Executive Summary ... v
1. Introduction ... 9
2. Exposition of the context of the issue ... 11
3. Literature review ... 12
a. Online segmentation ... 12
b. Digital communication ... 14
c. Personalization and Personalized Content ... 17
4. Methodology ... 19
5. Analysis... 24
a. Building customer profiles. Quantitative approach ... 24
b. Building customer profiles. Qualitative approach ... 37
c. Customer profiles of Stilnest... 41
6. Forms of implementation ... 46
7. Conclusions ... 50
Bibliography ... 53
iii
Abstract
This in-company project investigates a process of online segmentation by profiling the customers into different personas. It also illustrates for the reader that by personalizing communication with the customers, more efficient results are achieved. It suggests to use customer profiling as a way of personalizing the content and target the customers according to their differences and preferences.
Building accurate and effective customer profiles for the chosen company was the main purpose of this project. This study explains how different segments react to identical messages sent from the company and why it is essential to personalize content for different audiences to get the maximum level of engagement and attention from each segment.
This project explores main keywords in marketing literature sources regarding online segmentation, digital communication and personalization to create the basis for the research part.
The research part is based on the particular company.
The chosen company is a business start-up named Stilnest which operates in the fashion industry and creates, produces and sells jewelry for women.
The method for research part implementation is a combination of quantitative and qualitative approach. The quantitative part was conducted in order to collect statistical data about the customers by using the Google Analytics platform. Variables used were age, gender, volume, revenues, conversion rate, shopping behavior and checkout behavior. All quantitative data was supported by qualitative examples that included reviews and emails from the customers and company’s internal purchasing data.
In conclusion, with the strong theoretical and practical basis, four different customer personas were constructed. Each persona is defined by different aspects and represents a real person. In the end of this study the recommendations for implementation are suggested.
Keywords: online segmentation, e-marketing, customer profile, persona, personalized digital communication
iv O estudo investiga o processo de segmentação online, definindo perfis de clientes em diferentes
personas. É feita uma extensa demonstração de que a personalização da comunicação para os
clientes tem consequências positivas a nível de eficiência e de resultados atingidos. A definição de perfis é utlizada como forma de personalizar o conteúdo e de segmentar os clientes de acordo com as suas diferenças e preferências.
O objetivo do projeto foi a criação de perfis de clientes para a empresa escolhida, em que estes sejam precisos, estruturados e eficazes. Este estudo explica como é que diferentes segmentos reagem a mensagens idênticas, e o porquê de ser imperativo personalizar o conteúdo para os diferentes segmentos, por forma a obter o maior nível de engagement e foco.
Como forma de criar a sustentação para desenvolvimento da dissertação, o estudo explora bibliografia relacionada com as principais keywords de segmentação online, comunicação digital e de personalização.
ation of the second phrase is the following: A empresa escolhida é uma startup chama da Stilnest. Esta empresa em rápido desenvolvimento opera na indústria da moda, creando e produzindo joalharia para o sexo feminino.
A metodologia aplicada é uma combinação de métodos quantitativos e qualitativos. A parte quantitativa foi conduzida por forma a recolher informação estatística sobre os clientes através da plataforma de Google Analytics. Variáveis como a idade, sexo, volume, receitas, taxa de conversão, comportamento de compra e de pagamento foram usadas. Toda a informação quantitativa foi suportada por exemplos qualitativos tais como críticas e emails de clientes assim como informações internas da empresa relacionadas com a compra.
Sumariamente, foram definidos quatro perfis de cliente. Cada perfil é caracterizado por diferentes aspectos e representa clientes efectivos. No final do presente estudo são facultadas múltiplas recomendações para o uso e implementação da metodologia e dos resultados obtidos.
Keywords: segmentação online, e-marketing, perfil de cliente, persona, comunicação digital personalizada.
v
Executive Summary
The amount of information coming through an extensive range of different media channels is so large that people are less and less engaged and find it difficult to filter important content from trash. In a world of information overflow, the competitive companies need to use modern technology and innovation to precisely reach users with content that would interest them. Traditional marketing strategies of segmentation, targeting and positioning are insufficient and any successful company must work extremely focused and efficient in order to gain and keep their competitive advantage within the industry they operate. Margins are low and globalization and the internet have challenged both - production and distribution methods, as well as marketing.
This in-company project investigates one of the most important tools of marketing – segmentation. More specifically, the focus is on online segmentation by profiling the customers into different
personas. Personas are used to target information much more accurately to customers via direct
electronic communication, than via traditional mass media channels.
The paper shall illustrate for the reader that by personalizing the communication with the customers, more efficient results are achieved. It suggests to use customer profiling as a way of personalizing the content and target the customers according to their differences and preferences not only by statistical, but also by behavioral data.
The purpose of this project was to build accurate and effective customer profiles for the specific company. It aims to give the reader insight to how customer profiling works in an actual company under real conditions. It intends to show the process from the beginning to the end so that those working within marketing in a company can find this paper valuable and easy to apply in practice, more than on a theoretical level. This study explains how different segments react to identical messages sent from the company and why it is vital to personalize content for different personas to get maximum level of engagement and attention from each customer.
This study covers main keywords in marketing literature regarding online segmentation, digital communication and personalization to create the basis for implementation. It includes customer profiling as a method of segmentation, digital communication with further explanation of digital
vi and social media, e-marketing, search engine optimization (SEO) context, finalizing it with personalization and personalized content for customers. The literature gives insight into how to choose the variables for the research part and which steps are most important to follow while building customer profiles.
The research part of this project was focusing on existing company customers. The chosen company is a business start-up named Stilnest that operates in the fashion and design industry. Being more specific, the company offers jewelry products and accessories for women. There are no physical stores of Stilnest as it only offers an online shopping experience. All interaction with customers are made through virtual platforms, especially social media channels using different e-marketing tools. The main marketing idea for this company is to collaborate with influencers to sell the products through them, via their follower’s base. Stilnest engages with social media stars that are popular worldwide, or at least very well known in a specific area, country or topic. Stilnest looks for role model influencers that operate in the fields of fashion, beauty, travelling, and lifestyle and has at least 150.000 followers on their social media channels. After contract signing, influencers only suggest designs and messages they want to represent, but the whole production, delivery and advertisement process is delivered by Stilnest. In the end, the influencer is the face of the collection and he/she gets the agreed commission fee every month based on the sale of their collections.
The method to implement the research part is a combination of quantitative and qualitative approach and it has been used with different variables. The data has been collected according to the purpose of the project and it included demographic, psychographic and behavioral attributes. The quantitative part was conducted in order to collect statistical data about the customers by using the Google Analytics platform. Variables used for quantitative method were age, gender, volume, revenues, conversion rate, shopping behavior and checkout behavior. While analyzing the results, different rules (assumptions) were created for each variable.
All quantitative data was supported by qualitative examples. The qualitative part was conducted in order to illustrate the data collected and to demonstrate examples of existing customers, helping the reader to connect numbers to the personas. For this part, two different methods have been applied. First, customers’ examples were taken from the internal e-commerce platform called “Magento” and it provided results of customers’ retention rate and combinations of the basket.
vii Then, different reviews of the customers were collected in order to collect and analyze main behavioral aspects such as: needs, values, concerns, complains. Two different kind of reviews were collected: first, emails were taken from the customer service platform “Zendesk” and second, public posts were taken from “Twitter”. Qualitative data, except for the public posts, was taken from the confidential information of the company and it has been allowed to use only for this project to achieve the most effective and accurate results.
After all the necessary data was collected and analyzed, different customer personas were built. According to the size of the company and differences between everyone in the customer database, four different profiles were constructed. Each profile represents a persona and it has an identification (name, age, position) and a story behind it. Every persona also has basic statistical data that explains how many customer percentages it covers. Presented customer profiles are defined by different kind of aspects that include needs, values, pain points, triggers and touch points.
Analyzing the data delivered highly interesting trends and results. Having an overview of the collected information, the most important results in regards of customers’ buying experience were the following:
- Conversion rate increases by age
- The number of transactions gets higher with age
- Youngest group of customers spend most time only looking for products - Oldest group of customers spend less time on the website but converts the best
- Male customers make 10% of all the target audience but generate 20% of the revenues - Men perform the best at actual purchasing in value and in volume
- Youngest customers are the most impulsive ones as they mostly leave at the last stage of purchasing
- Most of the revenues are generated through segments aged at 18-35.
In conclusion, all the collected data has built a strong basis for customer profiles. As a result, four different customer personas were constructed. First persona represents a young female student that cannot afford the products but is following the influencers and is interested in the company because of them. Second persona is a young working professional female that has no time for waiting, cares a lot about buying experience, high quality and good customer service. Third persona represents a
viii mother of two kids that has time to read reviews online and to find the best alternative. She usually buys products as a gift to her family members and if she is happy, she is loyal. The last persona is a male customer that comes to the website to buy gifts only. He mostly cares about waiting times, packaging and returns policy.
This project includes possible recommendations of implementation that has been created together with the Head of Marketing of Stilnest. Implementation of personas to target different customer profiles by personalizing the content drives value for the company.
9
1. Introduction
The whole research of this project was directly related to a particular company. It is a Startup company called Stilnest and its headquarters are based in Berlin, Germany. The model of this company is represented in the illustration bellow. It shows that Stilnest is between the influencer and the end buyer. The main idea of this Startup company is that it looks for collaborations with different kind of influencers that are related with following fields: design, fashion, travelling, lifestyle, beauty, etc. Stilnest sign contracts with influencers and use them to actually sell the products. Influencers that agree to collaborate only give their opinion and suggestions on design, addressed messages to the audience and advertisement ideas. All of the design, production, delivery and advertisement processes are implemented by Stilnest. Influencers participate by writing public posts on their accounts about the products, mostly using Instagram and Facebook social media platforms. Influencers do not have direct communication with customers, but if they decide to do so – Stilnest allows them to. Influencer receives the agreed commission fee every month. The usual commission fee is 10% or 20% of the profit, depending on the size of the collection and the popularity of the influencer.
Illustration 1. Business model of Stilnest (own illustration)
Jewelry include necklaces, earrings, bracelets, rings, etc. Even though jewelry is the main product group of the company, Stilnest also offers phone cases, notebooks and other accessories for women. The official website of the company can be found here: https://stilnest.com/en_int/ Finding out more about Stilnest products it is important to mention that all the jewelry are silver or gold platted which makes products expensive among the competitors. Each piece of jewelry is hand finished in Germany, packed and sent to the customer with the particular designer card inside the package.
The research was made during the professional internship in this company (CRM and Marketing internship). The research analysis includes a lot of confidential data of the company that was
10 allowed to use only for this Master project. However, being able to collaborate with the company directly and work from inside, all the data collected is accurate which means that results are based on real customers and it can actually help the company to achieve better results in the future. This research was approved by the CEO and Head of Marketing of Stilnest and the results were presented to the team during the internship.
While discussed with the team about the research questions and customer profiling, it was decided in the Marketing team that this research should answer to these questions about the company:
- Who are our customers? - How do they look like? - How to engage them?
It is important to profile the customers of every company because of some very simple but important reasons. First of all, everybody is different. Second, people like to be contacted only about things that they are interested in and they do not like to be treated like “others”. Finally, at Stilnest we also have different types of customers so we should treat them more differently.
For building the personas, quantitative and qualitative approach was applied. First, quantitative data were collected and analyzed. For quantitative analysis the main platform used was Google analytics, taking into consideration the last 6 months of the company’s existence.
11
2. Exposition of the context of the issue
Managerial issue
While being a part of the company, it had been noticed that different customers have different purchase behavior. This included not only the way they purchase, but also the fact that they had different conversion rate, retention rate, needs, values and concerns towards the company.
There were a few reasons that initiated this project. First of all, it has been noticed that company has not been using different tools of segmentation. As a result, there was a lot of potential for a company to reach more audiences and to keep the existing ones. In order to improve the results of the company such as sales and retention rate, this project has been initiated to actually help the company achieve better results.
Second reason that encouraged to start this project was related to people feedback about the company. It was noticed that people that contact the company with questions, concerns or complains have totally different manners and behavioral aspects. This gave an idea that it can be useful and effective to group the whole audience of the company into different segments and to use specific ways of communication towards each of them. This is the reason that customer profiling was chosen as a way of segmenting the audience.
To sum up, the main managerial issue of this company has been identified as a lack of segmentation of the target market that influenced the overall performance of the organization.
12
3. Literature review
In the current economic and technological environment, the problem of meeting specific needs of different customers is relevant and has great importance to every success seeking business. There is a wide choice of literature in regard to this topic and according to the main purpose of the project, literature review has been categorized into three main parts: Online Segmentation, Digital Communication and Personalized Content.
a. Online segmentation
Customer profiling – a method of segmentation
Traditional methods of segmentation commonly apply to the method when the whole target market is being split into different groups according to age, education, family income and other social demographics. One of the alternative approach of segmentation that has different process of creating an actual segment was proposed by Jiand and Tuzhilin (2009) and it is called direct grouping segmentation. Jiang and Tuzhilin (2009) explains that direct grouping segmentation “partitions the customers into a set of mutually exclusive and collectively exhaustive segments not based on computed statistics and particular clustering algorithms, but in terms of directly combining transactional data of several customers, such as Web browsing and purchasing activities, and building a single model of customer behavior on this combined data. It gives an idea that this approach is based on using behavioral data instead of social demographics. It clarifies that it is not totally accurate to trust only numbers when it comes to existing groups of customers and online segmentation has to consider how people behave while purchasing online. This approach leads to a method of segmentation that is going to be a key method for this project – customer profiling.
As suggested by Loshinand and Reifer (2013), customer profiling is one of the effective ways to know who your customers are. The authors explain that “Customer profiling refers to processes for capturing data about customers, analyzing that data to create information about customer behaviors, likes/dislikes, and other characteristics, and the presentation of that information to decision-makers in various customer-facing processes to promote profitable actions” (Loshinand,
13 Reifer, 2013, p.60). Also, Jiang and Tuzhilin (2009) adds that customer profiles can be defined as a set of rules that defines behavior of particular customers.
A lot of research study shows the benefits that can be gained from profiling the customers of the company. Building customer profiles can be used as an alternative method of segmentation to create an individual portrait of a client that includes not only their personal, but also transactional details and that this portrait “helps companies make various customer-centered decisions regarding their business” (Upadhyay, 2016). There are also opinions that a customer persona represents an aggregate of target market users that share similar characteristics and behavioral aspects. These authors also give an idea that persona represent a real example of a person and a customer (Pruitt, Adlin, 2016).
When building customer profiles, it is necessary to understand the process and certain steps that are the key actions to get accurate and effective results. It is explained in the literature that in the process of profiling the customers it is essential to look not only at demographics, but also at buying insights. Author A. Revella (2015) suggested that company can gain more value by answering the questions of why/ how/ when the particular customers decide to make a purchasing decision. It is suggested in this context that the combination of buyer profile and buying insights gives a guidance of how to make the key decisions and win the buyers (Revella, 2015).
It is also suggested in the literature that different variables should be taken into consideration. For example, authors Bhatnagar and Ghose (2004) use age, gender, education and income and they assure that these are only the basic factual variables to use. According to the literature research and company’s profile, this project has also been using a logical combination of different demographic and behavioral variables to achieve accurate and effective results.
1.2 Building customer profiles
It is proved in the literature that customer profiling is built on real data. The same authors Loshinand and Reifer (2013) suggest that before starting a process of profiling the customers, it is very useful and effective to overview what kind of data has to be collected to build different types of personas. They notice that it is critical for companies to have an assumption what are the characteristics of the customers that are the most interested in the company’s products or services. They suggest that the key action is to collect three different types of data about the customers:
14 - Demographic (attributes that describe individuals among the population)
- Psychographic (attributes related to personality, likes and dislikes)
- Behavioral (attributes that describe purchasing behavior such as purchasing power or frequency) (Loshinand, Reifer, 2013)
On the other hand, it is suggested that customer profiles are combined out of factual and transactional data and they include all the attributes mentioned above (Apeh, Gabrys, Schierz, 2013).
While collecting different types of attributes and data to construct the profiles, companies should also have in mind to answer these two basic questions in order not to get lost in the process of customer profiling:
- Who are the most valuable customers
- How do they behave (Apeh, Gabrys, Schierz, 2013)
Concluding different attitudes, it is necessary to find the accurate way of collecting different type of data such as demographics, psychographics and behavioral information. Real data of the customers is a tool to collect demographic attributes that were discussed before while psychographic and behavioral attributes are possible to collect from the transactional data of the company. The way of collecting data by using one of the profiling models is discussed in the next chapter of this project. Although it might seem that the creation of well – constructed customer profiles is hard because there are cases when not all factual and transactional data is easy to access for businesses, there are strategies that suggest the best possible result and use the data to improve marketing strategies towards the main target groups.
b. Digital communication
The concept of digital communication has changed dramatically in the last decades. In the literature can be found many different approaches to what is digital communication, when did it start and how does it work. There are also numerous types and ways to apply this kind of communication in real businesses. However, the types of digital communication that has a great importance for this project are digital media, social media, SEO and e-marketing.
15 Nowadays every successful company is seeking to find the way to generate exposure, develop interactive strategies and engage consumers online using only digital media channels (Parsons, Lepkowska-White, 2018).
Starting with the definition, Acerbi (2016) describe digital media as a type of media that is encoded in digital format, typically to be transmitted and consumed on electronic devices, such as computers, tablets and smartphones. This type of media can include emails, digital audio and video recordings, e-books, blogs, instant messaging and more recent social media (A. Acerbi, 2016). Digital media has a lot of different forms and can be presented in various formats.
The type of digital media that has enormous impact on people and society is social media. While overviewing the data it is worth mentioning the official worldwide statistics and its impressive numbers. It shows that the number of worldwide social network users has increased from 0.97 billion to 2.62 billion users in the last ten years (Statista, 2018). Taking a closer look to different social media platforms it can be said that the biggest percentage of active users belongs to Facebook (2167 million), second most popular platform is Youtube (1500 million) and the third one is WhatsApp (1300 million users) (Statista, 2018). In order for business to reach their consumers in the most effective way it is essential to understand how consumers interact through digital media and what they respond to (Campbell, Ferraro, Sands, 2014).
Social media is an important topic in business today as it has significant influence on the users today. It is defined in the theoretical sources as an internet based applications that gives an opportunity to create, develop and exchange user generated content online. As explained in this way, social media can include various types of forms such as blogs, virtual networking sites, virtual chat and discussion rooms, etc. Social media concept is also used to explain different forms of media content that is created by the end – users and it is public (Kaplan, Haenlein, 2010).
One of the very important social media objectives useful for this research is that companies can use social media as a tool to collect information about themselves from their consumers. As almost all social media platforms are public, information can be found and used easily (Schweidel, Moe, 2014).
There is a part of social media that is relevant specifically for this project and that part is called influencer marketing. The process of influencer marketing is well explained by Veirman,
16 Cauberghe and Hudders (2017). Influencers today have a big impact on social media users. For example, there are people that collect thousands or even million users to follow them on Instagram because of various reasons: fashion, celebrity life, healthy life style, travelling, beauty and many more. Through blogs and vlogs (video blogs) influencers create a content using their everyday life and deliver it to the users. They involve people in their life and it makes users care about particular influencers and their opinion. Brands use these kind of influencers nowadays to reach even bigger audiences. This approach is getting more and more popular in companies, especially in smaller ones, when they try to use influencers to generate their competitive advantage (Veirman, Cauberghe and Hudders (2017).
2.2 E-marketing and SEO
It has been a lot of significant changes in this field and it is important for managers to go ahead with the new, innovative trends. The evolution of e- marketing, especially the development of data mining, gives an opportunity for companies to collect not only facts about their clients, but also their behavioral aspects that can be critical to know when targeting them. Different ways of e-marketing expand the possibilities to explore their customers, to get richer data about them and as a result to adapt segmentation and targeting strategies more effectively (Faraone, Gorgoglione, Palmisano, Panniello, 2012).
During segmentation and customer profiling process, there are so many possibilities to apply different e-marketing strategies according to the needs. For example, if it is known from transactional data that customers think that the quality of the website is poor and they find it as a valuable aspect of their shopping experience, marketers can react by changing the design of their e-shop, adding more content or providing extra functions for easy purchase process (Bhatnagar, Ghose, 2004). E-marketing is more dynamic, concentrated and interactive than the old marketing strategies (Chong, Bian, Zhang, 2015).
It is not easy anymore to position a particular website in a way so that customers would easily find it only by googling it. Search engine optimization, or SEO, is one of the popular and effective e-marketing tools for companies. Krisopher Jones (2013) explains in his book “The history of search – engine optimization” that SEO is “the process of setting up your Web site so that it ranks well for particular keywords within the organic search results of major search engines such as google” (Jones, 2013). Even though SEO has become more complex today than it was ten years ago, it has
17 some strong advantages and of them is proposed by Kritzinger and Weideman (2013). It explains that SEO listings are occupying the main areas of search engine’s result page and users cannot ignore them very easily. The same authors also highlight the benefits of SEO if a feature called “pay per click” has been added. When search engines add this function, next to the organic results there are also ranked results on the same page. The combination of SEO and PPC feature can generate way more competition among commercial websites. By understanding how big the competition today is, these advantages can mean a lot for e-commerce businesses.
c. Personalization and Personalized Content
3.1 Mass communication versus personalized communication
When it comes to communication with the audience, it can vary in many ways. Depending on the profile of the company, it can communicate with the whole audience using the same strategies, advertisements, messages, or, it can segment its audience and communicate with smaller groups of potential customers using different means, media channels, and methods of marketing.
It is important to understand in which context mass media is used. Baran and Davis (2015) explain in their book “Mass communication theory” that mass communication happens when organization sets or employs a technology to communicate with a very large audience. Authors mention that different organizations have their own ways to do it, for example, publishing organizations use printing presses and newspapers to reach their readers while producers and filmmakers use audio and video technologies to communicate with their audience. The point is that a newspaper and a movie or a TV show is for everyone, it is directed for a huge amount of people (Baran, Davis, 2015).
Mass communication occurs almost everywhere in daily life but its way of delivery is changing constantly. Looking at the television today, it can be seen that previously mentioned TV shows or movies are now being watched on personal computer screen, tablets or even mobile phones. The same is done with publishing companies as they deliver the same content to people in different formats. What was a paper magazine twenty years ago, today is a portable, light, well designed e-reader. It is worth mentioning that mass communication in the traditional context today is also Internet-based communication that apply not only to production but also to delivery process. It
18 means that in a lot of cases the content remains the same but the method of delivery to an end - consumers changes depending on their needs and preferences (Castells, 2009).
However, when it comes to smaller and more concentrated organizations, mass communication is not so effective not because of the delivery forms, but because of the content. Small niche business only has a specific audience; products or services might not be interesting to every person. For this reason, companies (not only small ones), are looking for ways to separate their market and address more personalized communication to smaller groups of customers that have particular needs and interests. In this context the definition of personalization can be described as “a process whereby a solution (product, service, or a combination of both) is created or adapted according to the needs and preferences of the individual customer” (Dantas, Carrillat, 2013).
3.2 Advantages of Personalized digital communication
As proposed by literature sources, personalized digital communication has many benefits and some of them are particularly relevant for this project. First of all, highly personalized messages or very accurate and specified website content can help a customer to make up his mind and choose that particular product or service among numerous alternatives. Personalized content also gives a value to the customer because according to the strategy of customer profiling, personalized content is built not only on factual data, but also on consumer’s shopping behavior, needs, likes and dislikes. It means that personalized digital message is bothering a customer with a content that will actually interest him (Dantas, Carrillat, 2013). The third combination of advantages relevant for this project is that personalized digital communication is able to increase customer engagement and loyalty, it helps brand to increase its awareness and it helps companies to have higher retention rate on their clients (Maslowska, Smit, Putte, 2016).
19
4. Methodology
4.1 Research paradigm and research questions
Starting with the research paradigm, the approach was a mixture of quantitative and qualitative methods. The combination of approaches matches the research problem and research questions and it was applied after carefully measuring possible ways of implementing the research process. Even though both approaches were used for the project, the main focus was on quantitative research methods.
In order to build accurate customer profiles, the main research questions were asked:
- Who are the customers of the company and how do they look like? - What are the main variables to build a customer profile?
4.2 Personas building method
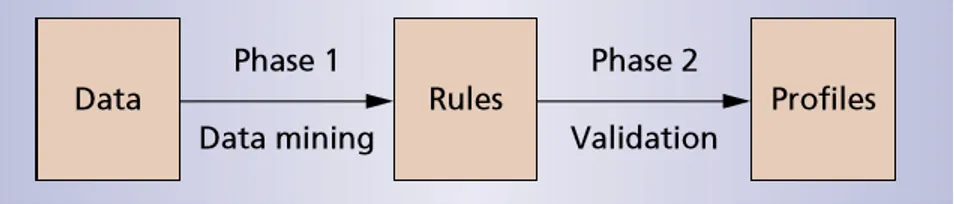
In order to achieve the main purpose of the project and to build customer personas, certain steps had to be followed. One of the customer profile building method was proposed by authors G.Adomavicius and A.Tuzhilin (2001) and it mainly explains what steps need to be followed in order to build a complete and accurate customer profile from factual and transactional data. (Illustration 1)
Illustration 2. Customer profile building process in a simple way (G.Adomavicius, A.Tuzhilin, 2001)
This building method explains that to have a final result (profile), certain phases have to be implemented:
20 2. Transformation of the collected data into rules
3. Validation of the rules using real life examples 4. Constructing customer profiles
In the phase of data collection, demographic data of the segments were collected and analyzed. The variables that were taken into consideration are age, gender, volume, revenues, conversion rate, shopping behavior and checkout behavior. The data was described and the main conclusions were made.
Transformation of the collected data into rules refers to a process where clear and consistent conclusions were drawn out of many different collected data. The rules are trends that are proved by quantitative data and it was used as a base to build customer profiles. In order words in can be explained that every assumption made during the quantitative analysis, was confirmed with qualitative data.
Validation of the rules has been made by supporting quantitative method with qualitative analysis. This phase included illustrations of personas taken from social media platforms and internal data of the company. In other words, validation of the rules means support of the conclusions made by using examples from the company’s experience.
The phase of constructing the profiles is an actual process of building different personas. In this stage, quantitative and qualitative was differentiated and used to construct separate profiles that represent different segments of the company.
Overall, the chosen model helped to stay structured while collecting data. Since customers profiles were chosen to be based on quantitative and qualitative data, these four steps were followed to have a clear order, accurate conclusions and finally, accurate personas.
4.3 Methods
Quantitative approach
The methodology of this project was chosen according to the main purpose of the project and to the suggested steps. In order to improve the segmentation by using personalization, the complex approach was applied and implemented.
21 - Google Analytics
Google Analytics Platform was used to collect all the necessary data of the existing customers of the company, as well as their shopping behavior on the website of the company. The variables that were collected and analyzed were demographics and shopping behavior and included:
- Age - Gender - Volume
- Generated revenue - Conversion rate - Average basket value
- Shopping behavior (all sessions, sessions with product views, sessions with add to cart, sessions with check out, sessions with transactions)
- Checkout behavior (check out method, billing & shipping information, payment information, order review, sessions with transactions)
4.4 The process of collecting the data
Since Google Analytics is providing four different age groups and is separating genders of all the customers, every group was chosen as a different segment. The shopping and checkout behavior was measured according to different age groups and different genders. Also, the combination of age groups and gender was also taken into consideration. The same method was applied for generated revenue and volume of the customers as customers’ profiles have to represent all the clients of the company.
The period chosen to measure the data and build the customer profiles was 6 last months of the company’s existence. This period was chosen because for the last 6 months company has implemented its activities: it expanded its products range for the first time. This gave an idea that this period of time would show the most interesting correlations and data to build the profiles and to implement the main purpose of the project.
22 To make this research more accurate and to prove that all the quantitative research results are correct, qualitative method has also been applied for this project.
As this project includes existing customers of the company, the real life examples were taken into consideration as a proof of the conclusions from the quantitative analysis. To support quantitative analysis, three different platforms were used to illustrate their shopping habits and buying experience:
- Social media platform Twitter - Customer support platform Zendesk
- Internal sales and operations system Magento
Twitter as a qualitative research tool was chosen because this platform is used the most among the customers of the company. Other platforms that customers tend to share their experience are Instagram and Facebook, but Twitter has the most public reviews and comments about the company and its products. Also, internal customer support platform was used as well to illustrate how customers are interacting with the company, what concerns they have, what type of questions they ask and how different people tend to communicate directly with the company. Finally, internal sales and operations system Magento also proved the accuracy of the results. It showed not only the average basket value, but also the combination of the items in the basket. Also, it showed what age and gender groups are the most loyal and has the highest retention rate. This information was supporting shopping behavior data in order to build more accurate customer profiles.
After applying both research methods, the reader is able to understand better how customer profiles were built and what the main trends in the company are.
As the second objective of this project is to explain how personalized communication towards the customers can be effective, the research part has intended to suggest possible alternative methods to communicate with different customer segments that were built using customer profiling. The practical part includes recommendations for implementation that specifically discuss ideas of more personalized content addressed to different segments of the company. The recommendations were created with the Head of Marketing of the company and will be used in the future, making this project possible to continue, exploring the effectiveness of suggested strategies that are going to be applied in this organization.
23 In the next chapter, analysis and the conclusions of the research are explained and the customer profiles that were built for the company are presented.
24
5. Analysis
a. Building customer profiles. Quantitative approach
As explained in the methodology part, the research part started with quantitative method. The platform to gather information about statistical information was Google Analytics (https://analytics.google.com). The main reason to use this platform was because the research company is an e-commerce business with no physical store and it collects data about its customers only through digital sources. The period to analyze the data was the last six months of the company’s existence. It took a period from 1st of April to 1st of October, 2017. The reason for this
length is because the company has launched new products during that time and there were some interesting changes and relations.
The following variables for the quantitative analysis were analyzed:
- Demographics - Conversion rate - Shopping behavior - Checkout behavior - Revenues - Volume
The selection of the variables was chosen according not only to suggestions found in the literature, but also to the assumptions made. Starting with assumptions, the changes that happened in the company during the mentioned period brought a lot of questions to the managers. It had been discussed, for example, why audience is becoming younger, why some groups of customers respond to the messages better, why social media has become more effective tool to reach audiences. It has been clear that this research had to be based on many different variables that include statistics and let see the results of the company from many different angles. As Google Analytics platform was chosen as the main source to gather quantitative data, it has already offered all of the chosen variables. Also, according to the literature that has been overviewed, it was decided to combine demographic and behavioral data to achieve accurate results. Based on this, selection of the variables are explained:
25 Demographics age and gender: starting with age as a demographic aspect, there is a big difference between an 18 year old student and a 35 year old working professional in terms of financial capabilities. Taking age into consideration explains how people spend their money when they do
not have stable income and when they do have it.
Gender is important because it proves that men and women can have completely different shopping habits and because the chosen company is originally orientated to women.
Conversion rate: it is smart for every company to know which segment converts the best. Conversion rate shows number of sales as a percentage that each group of the customers make. Looking at this number it is possible to make conclusions about customers that are the most valuable for the company.
Shopping behavior: shopping behavior was chosen as another variable to see how people buy company’s products online. Shopping behavior explains the process from when a customer enters the website until the moment he leaves the website. When building a customer persona it is critical to know how customers behave once they enter the website. Shopping behavior includes all sessions, sessions with product views, sessions with add to cart, sessions with check out and sessions with transactions, conversion rate, average basket value.
Checkout behavior: this variable has power to show the most common reasons why customers leave the website. This variable can be very useful for a company by helping recognize what should be improved on the website itself so the customers would not drop off in the middle of their shopping process. For example, it is important to know how impulsive people can be, how difficult they find it to complete all the shipping, billing and payment information, etc. This variable includes several stages where people drop off: checkout method, billing & shipping information, payment information and order review.
Revenues: as customer personas have to represent real people it is important to know how much revenue real customers represent. This variable was chosen to better understand which groups of customers (in terms of age and gender) generate the most revenue and converts the best. This information helps to create the most effective strategies to recognize people with the biggest purchasing power and make them act.
26 Volume: this variable shows how big the group that actually represents the customers is. There are some groups that are much bigger than the others which gives us an idea which group has to be most focused on.
The short conclusions were made after analysis of each variable. Finally, after every conclusion of different variables, the rules were created. As it was explained before, the process of building customer profiles was based on the model presented in the previous chapter. Rules were created and they were validated in the qualitative part of the research.
5.1 Demographics and shopping behavior
Demographics
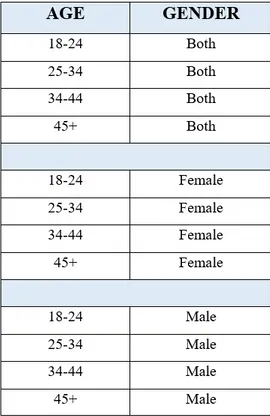
As mentioned above, demographic aspects that were taken into consideration were age and gender. Age was analyzed in four different groups: 18-24, 25-34, 35-44 and 45+ years old.
Different genders were combined with each age group as well as the combination of gender was also taken into consideration. The illustration (table 1) bellow shows how demographic data was collected and analyzed.
27 Age and gender overview
Originally Stilnest’s main target group is women since the products are created for them. It is natural that the highest number of sessions in online shop and the biggest rate of product views belong to female customers. However, it does not necessary mean that female customers is the only group that actually buy the products and this hypothesis is going to be explained by the further research.
Age. When it comes to age groups, the biggest percentage of users of the company belongs to the
youngest group (see illustration 2). 49% of the whole customers are aged between 18 and 24, 35% of the market belongs to people aged between 25 and 34. The smallest groups of the customers are older audience which is 16% in total, showing that customers older than 45 years old make only 6% of the whole audience.
After looking at these numbers, some assumptions can be made. The fact that the biggest audience of the company are young people, gives an idea about the products and delivery of the message. Company targets young customers the most and this can happen for various reasons, for example:
- The design of the products are more attractive for youngsters
- The influencers that collaborate with the company has young audience
- Company delivers its message in a way that young people understand better (content, tone of voice, etc.)
Gender. After getting an idea about age groups, company’s target audience has also been
overviewed in terms of gender. As it can be seen from the pie chart (see illustration 2), almost all clients are female. 89% of the whole target belongs to women and 11% belongs to men. The reasons for these numbers can be explained as women supposed to make the majority of the whole target market since the products are created only for them. On the other hand, men do not have to be end – users to make a part of the whole target audience. Conclusion is that men do not have to use the products in order to buy them and they are also one part of the whole users of the company that cannot be ignored.
28
Illustration 3. Age Illustration 4. Gender
Conclusions
After looking at the age and gender it can be said that youngest group of customers represents almost half of the whole target market and there could be many reasons for this fact. The assumptions for the reasons has been made but it will only be confirmed in the qualitative analysis where the rules will be validated with the examples taken from the company. Also, looking at the gender it can be concluded that men are also customers of Stilnest and this should not be ignored while building the profiles of the customers.
Rules:
1. Products are attractive to youngest customers the most
5.2 Conversion rate and average basket value
Starting to analyze the general view of conversion rate and shopping behavior in terms of different age and gender groups, one very consistent conclusion can be drawn: conversion rate increases by age. It is obvious to see that in every age group (both genders) the conversion rate is getting higher consistently. It can be seen from the illustration below how conversion rate is changing when the age gets higher.
49% 35% 10% 6%
AGE
18-25 25-34 35-44 45+ 89% 11%GENDER
Female Male29
Illustration 5. Conversion rate in terms of age
Taking a closer look to gender comparison it can be said that men has higher conversion rate than women and the difference is quite big. Average conversion rate for men is 2.33% while average conversion rate for women is 1.11%. This is a significant data because originally Stilnest’s target audience is women. High conversion of men implies that male customers are buying products for women.
The highest basket value for all customers is in the age group of 25-34, where the average value is 78.22 euros. However, looking into different genders, the highest average basket value belongs to male group of 35-44 years old where the average value reaches 81.70 euros. The conclusion of this interesting result is that the older group of male customers are the ones that actually buy for the highest price and it gives an idea about gifting.
Finally, conversion rate does not go consistently with the average basket value. Taking a closer look to find the reason it can be said that even though some people buy more times (conversion rate), the value of their purchase is noticed to be lower.
Conclusions
To sum up the results of conversion rate and average basket value, it can be said that conversion rate gets higher with age consistently. It is extremely important to notice that men have higher conversion rate than women because the company is originally orientated for female customers. From this interesting result the conclusion is that men come to the website to buy presents to women. Also, talking about the performance of male customers it is also noticed that men have higher average basket value. If thinking about the gifts, men tend to buy more expensive products than women.
Rules:
1. Older customers perform better than younger customers 2. Men have higher conversion rate and average basket value
30
Both genders. Taking a closer look to the shopping behavior overview, one more clear and
consistent conclusion is that the number of transactions gets higher with age. Looking at both genders it can be seen that customers at the age group of 18-24 and 25-34 tend to spend the most of their time visiting the website and looking at the products. It is seen that youngest people is the biggest group of overall sessions and they also spend the most time looking at the products, adding them to cart. However, they do not have the big buying power which can be explained by a student or a young working adult status. It can also be noticed that the biggest number of transactions belongs to the oldest group of customers – people of age of 45 and higher.
Female. The highest number of overall sessions goes to the youngest group of females and even
though the number of checkout sessions is pretty high, it drops dramatically when it comes to an actual purchase. This can be explained easily since the youngest group of customers does not have so much stable income because either they are still at school or university, they like to look around, they add products to cart but they are not actually able to buy a lot. The second age group of females performs the best among women. Customers between 25 and 34 also spend a lot of time looking at the products and even though the percentage of the transaction is only a little bit higher, the average amount of money spent is the highest within all female groups. This can be explained by the fact that women in this age group tend to have more stable income already and even though they still look at the products a lot, they are actually able to purchase the products.
Looking at the two last age groups of female customers (35-44 and 45+) it can be seen that these customers tend to spend less time on product views and less time on the website in general. However, those women have higher rate of transactions and as well, as mentioned before – highest rate of conversion. This means that these customers perform with the highest purchase power, but do not put a lot of effort to find the products. This can explain that these people are possibly buying the products as gifts, they have less time to look at the products and they are more purchase-oriented. For example, mothers buy presents for their daughters and they already know what kind of gift is wanted, so the whole process of shopping becomes shorter and more concentrated to the final stage: make the payment and receive the package.
31
Male. Looking into male groups it can be seen that men have slightly lower percentage of product
views and lower number of overall sessions. However, men perform the best in terms of actual purchase which points that they only come to the shop to buy the products they already know. This gives a point of a “gifter” role which means that men are likely to buy presents for women: daughter, wife, sister, etc. The number of transactions increases consistently with age, but the highest value of the basket belongs to the age group of 35-44.
Conclusions
To sum up the data of shopping behavior it can be said that the older the customers, the higher number of transactions is. As it was mentioned before, older customers convert the best, thus it can be more specifically explained that older clients come to the website to actually shop and they make more transactions while younger groups of customers spend most of their time looking at the products. This relation gives an idea that if older customers have higher transaction rate but do not spend much time on the website, they are the ones that buy the products for the youngest group of customers. When it comes to different genders it can be concluded that women aged between 25 and 34 buys the most for themselves while all age groups of men are still considered as “gifters” that come to the online shop to look and shop for gifts.
Rules:
1. Female customers aged between 25 and 34 spend the most money in all female groups 2. Older customers spend less time browsing for products but have higher number of
transactions.
3. Oldest group of customers (45+) come to the website to buy presents
5.4 Checkout behavior
After customers decide to add some products to the cart, the checkout process begins. As mentioned before, checkout behavior can say a lot about the reasons why and when customers leave the website which is very useful information for companies. Finally, when it comes to checkout process there are some interesting connections and trends that were found during this research.
32
Both genders. Starting with general overview of both genders it can be said that most of the people
tend to drop off in the stage where they have to choose a checkout method. This means that they have to become a member of the company and register their email or they can continue as a guest. This drop off can be explained that most of the people do not want to give their personal data because they tend to be afraid that companies will send them newsletters, spam emails and bother them for a long time after the purchase. Also, when it comes to the billing and shipping information, the youngest group of customers drops off the most (20.5%). At this point the conclusion can be made – the youngest group of customers is worried about the shipping time the most. This can be explained as naturally younger people are less patient than older people. It is common for young people to be more excited about their deliveries, more worried about too long waiting times. Another important point noticed is that payment information drop off goes down consistently with age which means that older customers tend to drop off in this step the least. The same consistency applies to the order review drop off. The younger the audience – the bigger the percentage of order drop off at the very end. This implies that younger age groups are more impulsive customers. They tend to change their mind at the last minute, which can be caused by different reasons: low income, inner feeling of “do I really need it”, etc. Opposite to that, older customers are more consistent, patient and they have made up their mind about the purchase before the checkout process.
Female. Taking a closer look to the groups of female customers some interesting trends can be
noticed as well. First of all, when it comes to the checkout method drop off, the third group of females (35-44) tend to drop off the most (27.67%) at the payment method stage. This can give an idea that this group of customers cannot see the payment method that fits them or the entering process seems too complicated for them. At the last three stages of checkout behavior the youngest female customers tend to drop off the most. This can again be explained by the fact that the younger the customers, the more impulsive they act while purchasing. It can be assumed that only at the very last stages of the purchasing process they decide to drop it because of different reasons: no income, changing mind, etc.
Male. When it comes to checkout method, the biggest percentage of drop off goes to the youngest
groups of male customers. Interesting fact is that in the billing and shipping information stage, the youngest group (18-24) and the oldest group (45+) tend to drop the most. First trend can be
33 explained as it was explained with female customers, but the second trend is more unusual. As mentioned before, different group of males are considered as “gifters”. This implies that fast delivery for this group of customers is a very important factor. Also, this can be proved by the fact that the oldest group of customers has 0% drop off in the stage of payment method and order review. Talking about these two last stages, the situation does not look very different from female since the youngest group of customers tend to drop off at the last stages as making an impulsive decision.
Conclusions
Many customers do not want to share their personal information as they tend to drop off the most at the checkout method stage. Stilnest gives an opportunity to checkout as a guest but it is not as visible as the option to register. In general, youngest group of customers in terms of both gender tend to drop off the most at every stage of the checkout process. Younger customers find more excuses not to buy and it is related with the lower income they have. Looking at different genders, female age groups older than 35 tend to drop off at the stage where the payment method has to be chosen. As Stilnest do not offer to pay with debit cards, it is possible that older group of customers cannot find the payment method that fits them. When it comes to male customers, it is important to notice that older group of male customers find delivery process very important.
Rules:
1. Youngest customers have highest drop-off rates and are described as the most impulsive 2. Male customers care about delivery process (time, packaging, refunds)
5.5 Volume and revenues
Customer profiles of Stilnest were built not only according to their age, gender or shopping behavior data. Other factors were considered as actual volume and revenues that different groups of customers generate. These variables are critical to find out the groups that have to be targeted the most. For example, even though it is now known that male customers performs the best in actual purchasing stage, it does not mean that the company should start targeting only men because the actual volume of this group has not been considered.
34 For the further research two main variables were used: the volume of users and the revenue they generate. These variables were taken into consideration in terms of all age groups (both genders) and genders separately (all age groups). The illustration bellow shows the results of the website users in terms of volume and revenue.
Age Gender Volume (%) Revenue (%)
18-24 Both 47.23 43.17
25-34 Both 36.25 36.40
35-44 Both 10.3 11.06
45+ Both 6.22 9.37
All groups Female 88.9 80.3
All groups Male 11.1 19.7
Table 2. Users of Stilnest in terms of volume and revenue
Users’ volume overview
Age groups. To begin with, the actual volume of the users has been measured in terms of all four
age groups. The clear and consistent fact is that the volume goes down with age. The biggest volume of all users belongs to the youngest group (18-24) of customers (47.23%). Then, the second group of users (25-34) has more than 36% volume of all users which is also very high. The last two groups of customers share the last percentage: third group goes with 10.3% and the last group of age goes with 6.22%.
Gender. Taking a closer look to different genders, the volume distributes very clear and here it is
obvious that the main target group of Stilest is women. Women make 88.9% of all the users at Stilnest while men only are only 11.1% of all users. Taking these facts into considerations it is critical to understand that women remains to be the main target group and the main focus has to be on them.
Users’ revenue overview
Revenue is one more very important factor when it comes to building different customer profiles. Revenue is able to tell the company which group of customers is the most profitable and therefore the most effort should be directly addressed to them.
35
Age groups. To begin with, the same clear conclusion as the one with the volume can be made: the
revenue gets lower with age. The most revenue for Stilnest are generated through the youngest group of customers (18-24) as this group generates 43.17% of all revenue. Also, the second group performs very well as it generates 36.4% of the total company revenue. The last two groups share the last part quite similar: group of 35-44 years old generates 11.06% and the group of 45+ years old users generates 9.37%. Knowing the fact that the company has started offering product range with lover prices it make sense that younger people became able to make more sales for the company.
Gender. Comparing revenue by gender it is clear one more time that women are the main target
group of the company. Female users generate 80.3% of the total revenue while men generates 19.7% of the total revenue. However, the number of revenue is higher for male than the number of volume which gives explanation, why male have such a high average basket and conversion rate.
Conclusions
Concluding the results of volume and revenue it can be confirmed one more time that female customers is the main target group of the company. To be more specific, youngest female customers play the most important role in the company’s activities. It is not only because of the volume, it is also because this age group generates the most revenue. However, it includes men and women. Also, it is very interesting to mention that even though male customers make 11% of the target audience, they generate double revenue. This can be concluded one more time that men actually buys more, but are less engaged in the company itself and this gives an idea about the same assumption that men come to the website to buy gifts.
Conclusions of the quantitative analysis
After collecting and analyzing quantitative data in terms of different variables, conclusions were made and rules were created. Mentioned above, there are the most important facts from the quantitative analysis:
36 - The highest basket value belongs to female in the age group of 25-34 and to men in the age
group 35-44
- The number of transactions gets higher with age
- Youngest group of customers spend the most time looking for the products - Men perform the best at actual purchasing
- People tend to drop off the most at the checkout method stage
- Youngest customers are the most impulsive as they drop off the most at the very last stage of the checkout process
- The largest group of customers are women between 18-24
- Most of the revenue are generated through the customers aged 18-35
As the process of customer profiling was chosen according to the model presented in the methodology, rules were created for the quantitative analysis. The rules describe assumptions that were made after data was overviewed. The following rules were validated by the further qualitative research, where it has been confirmed that assumptions made matches the real customers that actually purchase from the company:
1. Products are attractive to youngest customers the most 2. Older customers perform better than younger customers 3. Men have higher conversion rate and average basket value
4. Female customers aged between 25 and 34 spend the most money in all female groups 5. Older customers spend less time browsing for products but have higher number of
transactions.
6. Oldest group of customers (45+) come to the website to buy presents
7. Youngest customers have highest drop-off rates and are described as the most impulsive 8. Male customers care about delivery process (time, packaging, refunds)
37
b. Building customer profiles. Qualitative approach
After all the quantitative data has been collected and analyzed, the next stage was developed.
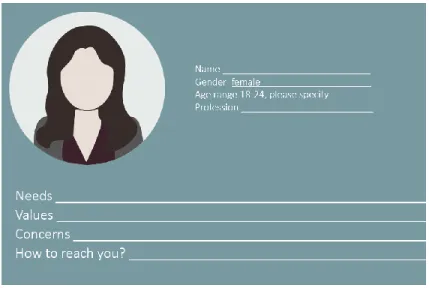
Customer profiles are more accurate if there is a possibility to support the quantitative data with real examples. The examples from the company were taken as a method to support the facts and numbers. The examples illustrate how different customers can behave, show their interests, concerns and needs. Very important notice is that age of most of the customers in the examples are identified as a lot of people register their data when subscribing for the newsletter. However, the names of the customers are hidden as this was required from the company.
The examples do not represent all customers of the company, it is here only to give a better idea for a reader of how different audiences can act. This part of the research brings the reader to the stage where the numbers are related to real life examples and gives a practical overview to the existing data.
After looking into the qualitative data of the company, some accurate examples of the customers were found. The following 12 examples were taken from:
- Customer support platform “Zendesk” (confidential emails from the customers) - Social media platform “Twitter”
- Order basket examples from “Magento” platform (confidential internal company data)
All the illustrations (screenshots) can be found in the appendices part of this project.
Emails from customer support
Customer support platform is a place where most of the questions, concerns and complaints are collected. Emails from customers can show not only the main problems in the company, but it can say a lot about behavior of different audiences. It has been noticed that some people are very polite, some are rude, some express their thoughts in long emails, and some goes straight to the point in one sentence. People react differently and the following examples show it in a very clear way:
Example 1. Illustration of a female customer that buys a product for herself (see annex 5). This