ISSN 0103-8478
ABSTRACT
Three short tandem repeats (STRs), BMS1074, BM1500, IDVGA-51, and three single nucleotide polymorphisms (SNPs), LEPSau3AI (A/B), LEPSau3AI (+/-) and LEPKpn2I linked to the LEP gene were investigated to verify associations with productive performance in postpartum cows of two beef cattle breeds, Aberdeen Angus (AA, n=98) and Charolais (C, n=83). After polymerase chain reaction, STRs were analyzed by vertical electrophoresis and SNPs in agarose gel after endonucleases cleavage. In AA herd 79% of BMS1074*151 carriers had a lower average daily weight gain (ADG) when compared with the population mean daily weight gain (103g), while 62% of BMS1074*151 non-carriers presented a higher ADG (P<0.01); AA animals with at least one BMS1074*151 allele showed a ADG about 159g lower than that of other animals (P<0.01). In both herds, carriers of the BM1500*136 allele presented higher ADG (about 75g day-1 higher in AA, P<0.05, and 96g day-1 in C, P<0.10);
animals with one BM1500*136 allele had about a 3-fold higher chance of having a higher ADG than non-cariers, in both populations.
Key words: Leptin, STRs, SNPs, beef cattle, weight gain, post-partum.
RESUMO
Foram investigadas três repetições curtas em tandem (STRs), BMS1074, BM1500 e IDVGA-51 e três polimorfismos de um único nucleotídeo (SNPs) LEPSau3AI (A/B), LEPSau3AI (+/-) e LEPKpn2I, ligados ao gene da leptina, verificando-se associações com o desempenho produtivo em vacas no pós-parto, em dois rebanhos de gado de corte, Aberdeen Angus (AA, n=98) e Charolês (C, n=83). Após a reação em cadeia da polimerase, os STRs foram
analisados em géis de poliacrilamida e os SNPs em gel de agarose, após a clivagem com endonucleases. Na raça AA, 79% dos portadores do alelo BMS1074*151 apresentaram ganho médio de peso diário (ADG) menor, quando comparados com a média da população (103g), enquanto 62% dos não-portadores mostraram ADG mais alto (P<0,01); os animais AA com pelo menos um alelo BMS1074*151 possuem ADG cerca de 159g menor que os outros animais (P<0,01). Em ambos os rebanhos, portadores do alelo BM1500*136 apresentaram ADG mais alto (em torno de 75g dia-1 em AA,
P<0,05 e 96g dia-1 em C, P<0,10) e animais com um alelo
BM1500*136 possuem cerca de três vezes mais chance de ter um ADG maior que os não-portadores.
Palavras-chave: Leptina, STRs, SNPs, gado de corte, ganho de peso, pós-parto.
INTRODUCTION
Leptin is an important regulator of energy metabolism, adiposity and reproduction. It is also involved in the regulation of body weight and can be considered as one of the best biological markers reflecting body fatness in both animals and humans (OPRZADEK et al., 2003; MÜNZBERG et al., 2005).
In ruminants, as in other species, leptin is predominantly secreted by adipocytes and has a primary effect on the hypothalamus, but it is also produced by non adipocyte cells and targets extra hypothalamic tissues. Plasma leptin levels in cattle and sheep increase linearly with increasing body fat
Association between molecular markers linked to the Leptin gene and weight gain in
postpartum beef cows
Sabrina Esteves Matos AlmeidaI Erik Amazonas de AlmeidaI Gustavo TerraII
Jairo Pereira NevesIII Paulo Bayard Dias GonçalvesII
Tania de Azevedo WeimerI,IV*
Associação entre marcadores moleculares ligados ao gene da Leptina e ganho de peso em vacas de corte no pós-parto
IUniversidade Federal do Rio Grande do Sul (UFRGS), Porto Alegre, RS, Brasil. IIUniversidade Federal de Santa Maria (UFSM), Santa Maria, RS, Brasil. IIIUniversidade de Brasília (UNB), Brasília, DF, Brasil.
mass and with increasing energy balance and seem to be an important component of a feedback loop involving key metabolic regulators that include insulin, glucocorticoids and sympathetic nervous system (DELAVAUD et al., 2002). Leptin concentrations undergo dynamic changes during pregnancy and lactation (BARTHA et al., 2005); the levels decline toward parturition and remain low for about three months after calving despite the increase energy balance which occurs during postpartum (LIEFERS et al., 2005).
The leptin (LEP) gene is highly conserved among mammals, and bovine leptin gene shares over 89% similarities with their human and murine counterparts (JI et al., 1998). The bovine leptin gene has been mapped to chromosome 4 (STONE et al., 1996; POMP et al., 1997), it is composed of three exons, spanning about 18.9kb, equivalent to that of human and mouse gene. The exon-intron organization was perfectly conserved between bovine and human or mouse genes, and the sizes of the first and second introns are about 14 and 1.7kb, respectively (TANIGUCHI et al., 2002).
Polymorphisms linked to the leptin gene could influence gene regulation and affect the weight gain metabolism. In Holstein-Friesian dairy cows some mutations are associated with milk yield, feed intake and plasma leptin concentrations during pregnancy but not during lactation (LIEFERS et al, 2005).
This paper was aimed at analyzing the effect of six polymorphisms, BMS1074, BM1500 and IDVGA-51 STRs (short tandem repeats) and LEPSau3AI(A/ B),LEPSau3AI (+/-), and LEPKpn2I SNPs (single nucleotide polymorphisms) linked to LEPgene on the average daily weight gain and reproductive performance in postpartum cows of two beef cattle herds, Aberdeen Angus and Charolais. The two SNPs and the BM1500 STR are mapped within the LEP gene, which is at 83cM from the beginning of BTA 4 chromosome: LEPSau3AI is at the intron 2, LEPKpn2I is at the exon 2 and BM1500 is at 2.6Kb downstream the stop codon. The BMS1074 and IDVGA51 STRs are at 75cM and 84cM, respectively, from the beginning of BTA 4 chromosome (KAPPES et al., 1997).
MATERIALS AND METHODS
Blood samples were obtained from 181, Aberdeen Angus (AA, n=98) and Charolais (C, n=83), multiparous cows, in the postpartum period. The animals came from a previous study which compared the efficiency of different hormonal treatments associated with 96-hour calf removal in relation to
complete weaning of animals fed with different forages (TERRA, 2001). The animals were adult cows (ages varying from 4 to 6 years), with mean body condition at delivery of 3.0 (in a classification range from 1 - very thin - to 5 - obese; LOWMAN et al., 1976). Fifty to 70 days postpartum, the cows previously classified at delivery, were ranked according to their body condition and submitted to hormonal treatment. All animals were weighed twice (at delivery and at weaning - performed 7 days after start of treatment) and sorted in two groups on the basis of forage availability: group one was managed on native pasture with 960kg of dry matter per hectare (DM ha-1) and a stocking rate of 0.96 animal
unit per hectare (au ha-1; au=400kg live weight) at
delivery, and 400kg DM ha-1 at weaning; Group 2 was
also managed on native pasture but with 600kg DM ha-1 and a stocking rate of 1.44au ha-1 at delivery and
240kg DM ha-1 at weaning. The dry matter of the pasture
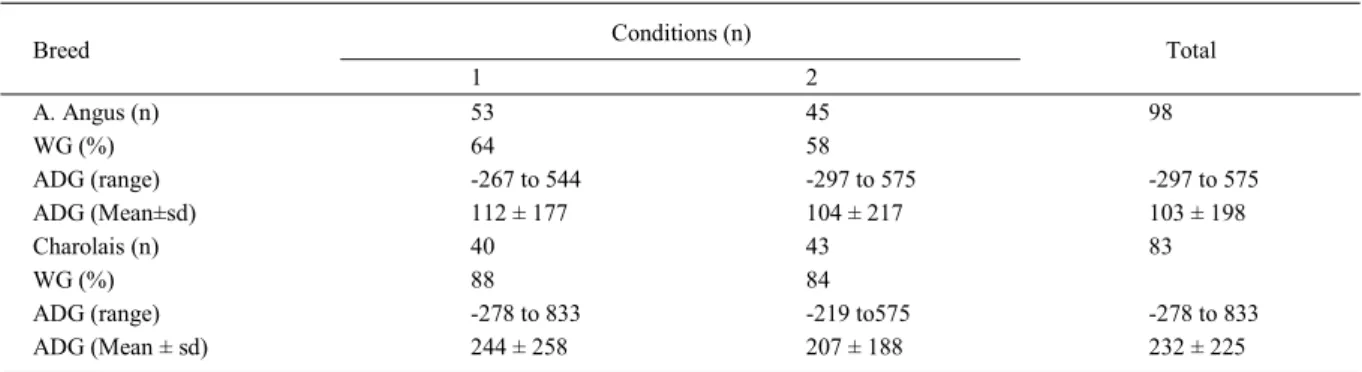
was estimated by the double sample method (WILM et al., 1944). Some animals gained while others lost weight in both groups (Table 1) suggesting that factors other than forage availability (which was above the maintenance diet, estimated based on dry matter only) must have influenced daily weight gain.
All cows that showed oestrous between days 7 and 17 from the beginning of the treatment were artificially inseminated; they were then bred with a cow: bull ratio of 100:12 up to day 67; clinical and ultrasonic diagnosis of pregnancy were performed at day 60 from the beginning of experiment to calculate the proportion of cows that conceived to the first oestrous after treatment and at day 127 to estimate the final pregnancy rate.
Blood was obtained from the jugular vein using ACD (acid-citrate-dextrose) as anticoagulant (ALMEIDA et al., 2003). Genomic DNA was extracted from peripheral blood leukocytes by the method of MILLER et al. (1988). Short tandem repeats were PCR-amplified as indicated in STEIGLEDER et al. (2004) and SNPs according to POMP et al. (1997) and BUCHANAN et al. (2002). The STR amplification products were analyzed by vertical electrophoresis in non-denaturing polyacrylamide gel (LAHIRI et al., 1997) and those of SNPs in agarose gel after Sau3AI or Kpn2I endonucleases cleavage.
Variance analyses (one-way ANOVA) were performed to compare productive parameters [average daily weight gain (ADG) and pregnancy according to the diagnosis at days 60 (P1) and 127 (P2)] in the different genotype classes according to the model:
Yij = μ + Ai + eij
mean; Ai is the effect of the ith genotype class; and eij is the random error component. The Tukey post hoc test was employed to identify the significant group, when a significant association was detected. Descriptive statistics was carried out beforehand to verify the normality of the distribution of productive parameters.
To compare the significant group detected by ANOVA with the other genotypes, average daily weight gain was also dichotomized into classes consisting of animals heavier or lighter than the mean ADG population values (see Table 1). For the analysis considering both populations simultaneously, the mean value was corrected by the herd weight; this analysis was made only when the positive association was detected in both populations. The genotype frequencies were compared between heavier and lighter animals by the chi-square test. To estimate the effect of the genetic markers on ADG, the odds ratio (OR) with 95% confidence interval was obtained by univariate logistic regression analysis. All the statistic analyses were performed using the SPSS
for WindowsTM software (SPSS Inc), version 10.0.5 (1999).
RESULTS
Allele frequencies for the two breeds are presented in table 2. In relation to the STRs, nine BM1074 and five IDVGA-51 alleles were observed in both populations; six BM1500 alleles were detected in AA and four in C; BMS1074*157, BM1500*144and IDVGA-51*175 alleles were the most frequent in AA while BMS1074*147, BM1500*142 and IGVGA-51*175 were the most common in C. Some alleles (BMS1074*159, BM1500*138, BM1500*146,
BM1500*148 and IGVGA-51*183) occurred only in AA, while BMS1074*141, BM1500*150 and IGVGA -51*173 were exclusively detected in Charolais. Concerning to SNPs, LEPSau3A1*A and LEP Sau3A1*-alleles were the most frequent in both populations; LEPKpn2I*C were more common in Charolais, while LEPKpn2I*T were more frequent in Aberdeen.
No association was observed between genetic markers and pregnancy rates, but positive association with average weight gain was detected in two markers: BM1500 and BM1074 STRs (Table 3). Carriers of the BM1500*136 allele presented a higher ADG as compared to the other animals (about 75g day-1
higher in Angus, P<0.05 and 96g day-1 in Charolais,
P<0.10). The analysis considering the pooled population values showed an important association (P<0.01). When the frequencies of BM1500*136 carriers and non-carriers were compared between animals heavier or lighter than the mean ADG population value (232g for C and 103g for AA; Table 4) the association results were confirmed: carriers of BM1500*136 had 72% and 60% higher ADG when compared with the mean population in AA and C breeds, respectively. The odds ratio test indicated that carriers of the BM1500*136 allele had about a 3-fold higher chance of having a higher ADG as opposed to the other animals (P<0.01).
In relation to BMS1074 significant association was verified for AA cows only (Table 3): carriers of at least one BMS1074*151 allele showed less ADG (159g) than the other animals (P<0.01). The comparison of BMS1074*151 carriers and non-carriers frequencies between animals heavier or lighter than the mean ADG population value (103g; Table 4) indicated that 79% of BMS1074*151 carriershad ADG
Table 1 - Distribution of animals analyzed in this study according to nutrition condition and information about average daily weight gain (ADG) in grams
Conditions (n) Breed
1 2
Total
A. Angus (n) 53 45 98
WG (%) 64 58
ADG (range) -267 to 544 -297 to 575 -297 to 575
ADG (Mean±sd) 112 ± 177 104 ± 217 103 ± 198
Charolais (n) 40 43 83
WG (%) 88 84
ADG (range) -278 to 833 -219 to575 -278 to 833
ADG (Mean ± sd) 244 ± 258 207 ± 188 232 ± 225
≤103 g, while 62% of non-carrieranimals presented ADG >103 (P<0.01), but the odds ratio test was not significant.
DISCUSSION
Two positive associations were detected, involving BM1500 and BMS1074 STRs which are mapped respectively at 3.6 kb and 8cM downstream the LEP gene. The BM1500 markers is in the 5’UTR region and BMS1074 STR could be in an enhancer region, defined as sequences which activate transcription and contains repetitive units of short sequences and can be located thousands base pairs upstream or downstream the gene they control. Therefore, both markers could play a role on DNA transcription.
The association between BMS1074*151 carriers and ADG was observed in Aberdeen Angus but not in Charolais animals, probably due to some of the following reasons: the low frequency of this allele in Charolais animals may be masking the results; other genes involved in weight gain metabolism may be hiding the effect of this STR in Charolais, due to different genetic background of the two breeds; the alleles involved in the association could be in linkage disequilibrium in Aberdeen Angus but not in Charolais animals.
The association between BM1500*136 carriers and ADG seems to be more interesting since it occurred in both populations. Previous data indicated positive association between BM1500 STR and
Table 2 – Molecular markers allele frequencies in Aberdeen Angus and Charolais cows
STRs
Breeds (n)
Alleles
BMS1074 A. Angus (98) Charolais (83)
*141
0.00 0.08
*143
0.02 0.01
*145
0.01 0.06
*147
0.10 0.25
*149
0.17 0.03
*151
0.10 0.04
*153
0.15 0.14
*155
0.16 0.30
*157
0.19 0.09
*159
0.10 0.00
BM1500 A. Angus (98) Charolais (83)
*136
0.25 0.28
*138
0.12 0.00
*142
0.13 0.46
* 144
0.31 0.19
*146
0.16 0.00
*148
0.03 0.00
*150
0.00 0.07
IDVGA-51 A. Angus (98) Charolais (83)
*173
0.00 0.06
*175
0.40 0.47
*177
0.10 0.32
*179
0.09 0.12
*181
0.16 0.03
*183
0.25 0.00
LEPSau3A1 (A/B) A. Angus (98) Charolais (83)
*A
0.87 0.67
*B
0.13 0.33
LEPSau3A1 (+/-) A. Angus (98) Charolais (83)
* -0.97 0.92
* +
0.03 0.08
LEPKpn2I A.Angus (98)
Charolais (83)
*C
0.42
0.63 *T
0.58
0.37
phenotypic characteristics of beef carcass (FITZSIMMONS et al., 1998).
BUCHANAN et al. (2002) verified a correlation between BM1500 STR and LEPKpn2I SNP (the same exon 2 C/T mutation here investigated) alleles and the bovine carcass fat composition and suggested that the C/T change may be the causative mutation, the effect of BM1500 STR resulting from linkage disequilibrium. However, in this paper no association was verified between LEPKpn2I SNP polymorphism and the weight gain.
CONCLUSIONS
The association studies performed between six molecular markers linked to the LEP gene and the average daily weight gain (ADG) and reproductive
performance in postpartum cows of two beef cattle breeds, Aberdeen Angus (n=98) and Charolais (n=83) indicated two positive associations and suggested that AA animals that carry the BMS1074*151 allele had bad performance in relation to the other animals, gaining about 159g day-1 less. Otherwise, Charolais and
Aberdeen Angus cows with BM1500*136 allele had three times higher chance to gain weight than for other animals.
ACKNOWLEDGEMENTS
We are grateful to Dr João Francisco de Oliveira for his help with sample collection. This work was supported by Programa de Apoio a Núcleos de Excelência (PRONEX), Fundação de Amparo a Pesquisa do Estado do Rio Grande do Sul (FAPERGS), Financiadora de Estudos e Projetos (FINEP), Conselho Nacional de Desenvolvimento Científico e Tecnológico (CNPq), and Coordenadoria de Estudos e Projetos (CAPES).
Table 3 - Significant association results of ANOVA analyses
BMS1074*151 BM1500*136
Population
Carriers Non Carriers
P value
CarriersNon Carriers
P value
Aberdeen Angus ADG mean (± sd) N
-24.7 (179.8) 19
134.2 (191.0) 79
<0.01 151.7 (162.9) 46
76.5 (216.7) 48
<0.05
Charolais ADG mean (± sd) N
155.1 (240.1) 7
246.1 (224.3) 73
>0.25 272.7 (248.0) 47
176.7 (194.8) 35
<0.10
AA and C
ADG mean (± sd)
N
NP 206.8 (209.2)
93
123.5 (207.1)
83
<0.01
ADG = average daily weight gain; sd = standard deviation; NP = pooled analysis not performed, because significant association was detected only in AA animals.
Table 4 - Comparison of BMS1074*151 and BM1500*136 carriers and non-carriers between animals heavier or lighter than the mean ADG population value
BMS1074
BMS1074*151
BM1500 BM1500*136
Carriers NonCarriers N (%)
P value
Carriers NonCarriers N (%)
P value
Aberdeen Angus Weight gain > 103.38ga Weight gain ≤ 103.38ga
4 (21) 15 (79)
49 (62) 30 (38)
<0.01 33 (72) 13 (28)
20 (42) 28 (58)
<0.01
Charolais
Weight gain > 232.12ga Weight gain ≤ 232.12ga
3 (43) 4 (57)
36 (49) 37 (51)
>0.99 28 (60) 19 (40)
11 (31) 24 (69)
<0.01
Charolais and A. Angus Weight gain > 162.41gb Weight gain ≤ 162.41gb
NP 61 (66)
32 (34)
31 (37) 52 (63)
<0.01
amean ADG population values; bpooled populations mean ADG value, corrected by herd weight; NP = pooled analysis not performed,
REFERENCES
ALMEIDA, S.E.M. et al. Molecular markers in the LEP gene and reproductive performance of beef cattle. Journal Animal Breeding and Genetics, v.120, n.106-113, 2003.
BARTHA, J. et al. Expression of leptin and its receptors in various tissues of ruminants. Domestic Animal Endocrinology, v.29, p.193-202, 2005.
BUCHANAN, F.C. et al. Association of a missense mutation in bovine leptin gene with carcass fat content and leptin mRNA levels. Genetics Selection Evolution, v.34, p.105-116, 2002.
DELAVAUD, C. et al. Plasma leptin concentration in adult cattle: effects of breed, adiposity, feeding level, and meal intake.
Journal Animal Science, v.80, p.1317-1328, 2002.
FITZSIMMONS, C.J. et al. A potential association between the BM1500 STRs and the fat deposition in beef cattle.
Mammalian Genome, v.9, p.432-434, 1998.
JI, S. et al. Partial cloning and expression of the bovine leptin gene. Animal Biotechnology, v.9, p.1-14, 1998.
KAPPES, S.M. et al. A second generation linkage map of the bovine genome. Genome Research, v.7, p.235-249, 1997.
LAHIRI, D. K. et al. High-resolution detection of PCR products from STRs markers using a nonradioisotopic technique.
Biotechnology Molecular Medicine, v.60, p.70-75, 1997.
LIEFERS, S. et al. Genetics and physiology of leptin in periparturient dairy cows. Domestic Animal Endocrinology, v.29, p.227-238, 2005.
LOWMAN, B.G et al. Condition scoring of cattle. East of Scotland College of Agriculture, Bulletin, v.6, p.1-31, 1976.
MILLER, S.A. et al. A simple salting out procedure for extracting DNA from human nucleated cells. Nucleic Acids Research,
v.16, p.1215, 1988.
MÜNZBERG, H. et al. Leptin receptor action and mechanisms of leptin resistance. Cellular and Molecular Life Sciences,
v.62, p.642-652, 2005.
OPRZADEK, J. et al. Polymorphisms at loci of leptin (LEP), Pit1 and STAT5A and their association with growth, feed conversion and carcass quality in Black-and-White bulls.
Animal Science Papers and Reports, v.21, p.135-145, 2003.
POMP, D. et al. Mapping of leptin to bovine chromosome 4 by linkage analysis of a PCR-based polymorphism. Journal of Animal Science, v.75, p.1427,1997.
STEIGLEDER, C.S. et al. Genetic diversity of a Brazilian creole cattle based on fourteen microsatellite loci. Archivos de Zootecnia, v.53, p.3-11, 2004.
STONE, R.T. et al. The bovine homolog of the obese gene maps to chromosome 4. Mammalian genome, v.7, p.399, 1996.
TANIGUCHI, Y. et al. Genomic structure and promoter analysis of the bovine leptin gene. Life, v.53, p.131-135, 2002.
TERRA, G. Indução de ovulação em vacas de corte ganhando e perdendo peso durante o período pós-parto.
2001. 27f. Dissertação (Mestrado em Medicina Veterinária -Reprodução Animal) - PPG Medicina veterinária, UFSM.