Cop
yright
© ABE&M t
odos os dir
eit
os r
eser
vados
.
Relationship between variants
of the leptin gene and obesity
and metabolic biomarkers
in Brazilian individuals
Associação entre variantes do gene de leptina e obesidade e biomarcadores metabólicos em indivíduos brasileiros
Hamilton M. Hinuy1, Mario H. Hirata1, Marcelo F. Sampaio2, Dikran Armaganijan2,
Simone Sorkin Arazi1, Luis A. Salazar3, Rosario D. C. Hirata1
ABSTRACT
Objective: The relationship between variants of the leptin gene (LEP) and obesity and metabolic biomarkers was investigated in Brazilian individuals. Subjects and methods: One-hundred-ten obese (BMI > 30 kg/m2) and 100 non-obese individuals (145 women and 65 men, aged 49 ± 14 years) were randomly selected. Plasma leptin, glycemia, serum lipid measurements and LEP
-2548G>A and 3’HVR polymorphisms were analyzed. Results: The LEP -2548GG genotype was associated with a 2.2% and 2.0% increase in BMI (p = 0.009) and plasma leptin (p = 0.031), res-pectively. 3’HVR I/II (classes I/I+I/II) genotypes contributed with 1.8% of BMI values (p = 0.046).
LEP I/G combined genotypes (I/IGG, I/IGA and I/IIGG) were associated with obesity, and increa-sed BMI, waist circumference, leptin and triglycerides (p < 0.05). These relationships were found in women (p < 0.05) but not in men. LEP I/G combined genotypes were not associated with hypertension, hyperglycemia, dyslipidemia and coronary artery disease. Conclusions:LEP I/G combined genotypes are associated with obesity-related metabolic biomarkers and phenotype in a gender-dependent manner. Arq Bras Endocrinol Metab. 2010;54(3):282-8
Keywords
Leptin; gene polymorphism; obesity; metabolic biomarkers; plasma leptin
RESUMO
Objetivo: A relação entre as variantes do gene da leptina (LEP) e obesidade e biomarcadores metabólicos foi investigada em indivíduos brasileiros. Sujeitos e métodos: Cento e dez indiví-duos obesos (IMC > 30 kg/m2) e 100 não obesos (145 mulheres e 65 homens, idade 49 ± 14 anos) foram selecionados aleatoriamente. Leptina plasmática, glicemia, lípides séricos e polimoris-mos LEP -2548G>A e 3’HVR foram analisados. Resultados: O genótipo -2548GG foi associado com aumento de 2,2% e 2,0% no IMC (p = 0,009) e leptina plasmática (p = 0,031), respectiva-mente, enquanto os genótipos 3´HVR I/II (classes I/I+I/II) contribuíram com 1,8% dos valores de IMC (p = 0,046). Os genótipos combinados LEP I/G (I/IGG, I/IGA e I/IIGG) foram associados com obesidade e IMC aumentado, circunferência abdominal, leptina e triglicérides aumentados (p < 0,05). Essas relações foram encontradas em mulheres (p < 0,05), mas não em homens. Os genótipos LEP I/G combinados não foram associados com hipertensão, hiperglicemia, dislipi-demia e doença arterial coronariana. Conclusões: Genótipos combinados LEP I/G são associa-dos com biomarcadores metabólicos e fenótipo de obesidade de forma gênero-dependente. Arq Bras Endocrinol Metab. 2010;54(3):282-8
Descritores
Leptina; polimorismo genético; obesidade; biomarcadores metabólicos; leptina plasmática 1 Faculdade de Ciências
Farmacêuticas, Universidade de São Paulo (USP), São Paulo, SP, Brasil
2 Instituto Dante Pazzanese
de Cardiologia (IDPC), São Paulo, SP, Brasil
3 Facultad de Medicina, Universidad
de La Frontera, Temuco, Chile
Correspondence to: Rosario D. C. Hirata Departamento de Análises Clínicas e Toxicológicas, Faculdade de Ciências Farmacêuticas, Universidade de São Paulo Av. Prof Lineu Prestes, 580, bloco 17 05508-900 − São Paulo, SP, Brasil [email protected]
Cop
yright
© ABE&M t
odos os dir
eit
os r
eser
vados
.
INTRODUCTION
L
eptin is a metabolic and neuroendocrine hormone produced and released mainly by adipocytes (1). Several systemic effects are attributed to leptin such as body mass control, lipid and glucose metabolism, thermogenesis, angiogenesis, immunity, reproductive, en-docrine and cardiovascular functions, among other (2). Increased leptin is associated with adiposity and it is expected to reduce food intake and increase energy ex-penditure by binding to leptin receptors that further activate the hypothalamic melanocortin pathway and control body fat stores (3).Several studies have suggested that variants in the leptin gene (LEP) may be important in the pathophysi-ology of human obesity (4-6). A common single nucle-otide polymorphism (SNP) within the 5’ promoter re-gion (-2548G>A) of the LEP has been associated with variations in plasma leptin and body mass index (BMI) in obese individuals (6-9).
Microsatellite markers such as the highly variable tetranucleotide repeat (TTTC)n located in the 3’-lank-ing region of the LEP (3’HVR) has also been associ-ated with obesity-relassoci-ated traits and leptin plasma levels (6,10,11). However, the relation of this variant with other polymorphisms in the LEP gene on metabolic and obesity-related characteristics remains to be inves-tigated.
In this study, the relationship between LEP 3´HVR and -2548G>A variants and obesity-related phenotype and metabolic biomarkers was investigated in a sample of the Brazilian population.
SUBJECTS AND METHODS
Study population
Two-hundred-ten unrelated individuals were randomly selected from Instituto Dante Pazzanese de Cardiolo-gia (IDPC), Sao Paulo, Brazil. These individuals were declared to have European ancestry (non-African) by physical examination, however lack of relationship be-tween color and genomic ancestry have been found in Brazilian samples (12). Sample size was estimated as 267 individuals considering 50% the frequency of LEP alleles related with obesity (95% conidence level, 5% conidence interval, and over 20,000 population size). Individuals with thyroid, liver or kidney diseases, evalu-ated by clinical and laboratory analyses, and pregnant women were not included in this sample.
Anthropometric measurements, such as BMI, waist circumference (WC) and waist-to-hip ratio (WHR) were taken from each participant. Individuals with BMI ≥ 30 kg/m² were classiied as obese and those with sys-tolic/diastolic blood pressure over 140/90 mmHg or under lowering-pressure therapy were considered hy-pertensive. Individuals with fasting glycemia > 100 mg/dL were considered hyperglycemic. Cigarette smoking was considered when individuals smoked 3 or more ciga-rettes/day. Sedentary life style was considered when individuals practiced less than a 30 min walk 3 times a week. The presence of coronary artery disease (CAD) was investigated by coronary angiography. The study protocol was approved by the Local Ethics Committees (Institute of Cardiology Dante Pazzanese and School of Pharmaceutical Sciences, University of Sao Paulo).
Biomarker analysis
Blood samples were collected from each participant af-ter a 12-hour fasting for serum chemistry tests. Glu-cose, triglycerides, and total cholesterol and high-den-sity lipoprotein (HDL) cholesterol were measured by enzymatic-colorimetric assays using a Roche-Hitachi 912 automated analyzer (Hitachi, Nakakojo, Japan). Low-density lipoprotein (LDL) and very low-density lipoprotein (VLDL) cholesterol were calculated. Apoli-poproteins AI (apoAI) and B (apoB) were determined in serum by nephelometry. Plasma leptin was deter-mined by an ELISA method (Alexis Biochemical/Ven-dor BioAgency, Sao Paulo, Brazil). The atherogenic index of plasma (AIP) calculated as log (triglycerides/ HDL cholesterol), and ApoB/ApoAI ratio were used for evaluation of thecardiovascular risk.
DNA genotyping
Genomic DNA was extracted from 1 mL EDTA-anti-coagulated whole blood by a salting-out method (13). LEP -2548G>A and 3´HVR polymorphisms were
gen-otyped by polymerase chain reaction (PCR) and frag-ment analysis as previously described (8,11). The ac-curacy of the genotyping was evaluated by performing duplicate analysis of 20% samples randomly selected. Moreover, heterozygous LEP -2458G>A and 3´HVR samples were included as genotype controls in each run.
Statistical analysis
LEP 3´HVR alleles were grouped in class I (short) and
com-Cop
yright
© ABE&M t
odos os dir
eit
os r
eser
vados
.
bined genotypes were formed by grouping 3´HVR and -2548G>A genotypes. The agreement of genotype fre-quencies with Hardy-Weinberg equilibrium (HWE) ex-pectations was tested by the chi-square test. The linkage disequilibrium between LEP variants was estimated using the SNPAnalyzer software (D’ index) (14). Relationships between the genotypes and categorical variables were evaluated by the chi-square test or Exact Fisher test.
Continuous variables without normal distribution (BMI, WC, leptin, glucose and lipid proile) were log transformed prior to the statistical analysis. Anthropo-metric and blood chemistry parameters were compared between LEP variants by One-way ANOVA and t-test. Pearson’s correlation coeficients were used to estimate the association between continuous variables.
Logistic and linear regression analyses were used to verify the relationships between obesity, LEP vari-ants and other variables such as BMI, WC, WHR and leptin. The models were adjusted by the covariates of age, gender, hypertension, hyperglycemia, CAD, ciga-rette smoking and sedentary life style. Statistical tests were performed by SAS System for Windows software version 8.02 (SAS Institute Inc, 1999-2001, Cary, NC, USA). The level of signiicance was considered p < 0.05.
RESULTS
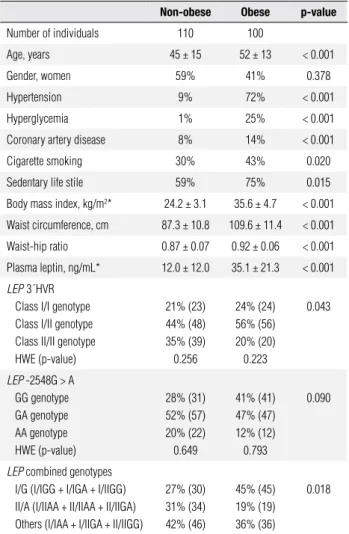
Anthropometric, demographic and biochemical data of the studied group are shown in table 1. Four women refused to inform their ages. One woman and one man did not have their waist and hip measured. Obese in-dividuals (BMI > 30 kg/m2) had higher means of age
and anthropometric data (BMI, WC and WHR) as well as higher frequencies of hypertension, hyperglycemia, cigarette smoking, sedentary life style and CAD when compared with the non-obese group (p < 0.05). Plasma leptin was also higher in obese than in the non-obese group (p < 0.05).
LEP 3´HVR class I/I and I/II genotypes were
more frequent in obese (I/I: 24%, I/II: 56%) than in non-obese individuals (I/I: 21%, I/II: 44%, p = 0.043) (Table 1). For -2548G>A polymorphism, the frequen-cy of the GG genotype in obese (41%) was similar to that found in non-obese (28%) (p = 0.090) individuals. Both LEP 3´HVR and -2548G>A variants were under HWE in this sample (Table 1). A linkage disequilibrium was found between these polymorphisms (D’ index = 0.7113). We found nine LEP combined genotypes
that were grouped as: I/G (I/IGG + I/IGA+ I/ IIGG); II/A (I/IIAA + II/IIAA + II/IIGA); and others (I/IAA + I/IIGA + II/IIGG). Obese indi-viduals had higher frequencies of I/G combined geno-types (45%) than non-obese subjects (27%, p = 0.018).
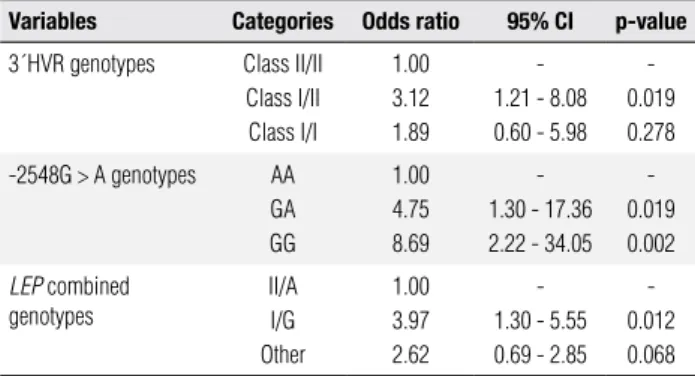
Results from univariate logistic regression analysis are shown in table 2. Variables were adjusted by the co-variates of age, hypertension, hyperglycemia, cigarette smoking, sedentary life style and CAD due to their as-sociation with obesity previously demonstrated (13). Individuals carrying 3´HVR class I/II genotype had 3 times higher risk for obesity (OR: 3.12, 95% CI: 1.21 - 8.08) compared to those with class II/II genotype (p = 0.019). The carriers of -2548GA and GG genotypes had, respectively, 4 times (OR: 4.75, 95% CI: 1.30 – 17.36) and 8 times (OR: 8.695, 95% CI: 2.22 -34.05)
Table 1. Anthropometric and laboratory data of the study group
Non-obese Obese p-value
Number of individuals 110 100
Age, years 45 ± 15 52 ± 13 < 0.001
Gender, women 59% 41% 0.378
Hypertension 9% 72% < 0.001
Hyperglycemia 1% 25% < 0.001
Coronary artery disease 8% 14% < 0.001
Cigarette smoking 30% 43% 0.020
Sedentary life stile 59% 75% 0.015
Body mass index, kg/m2* 24.2 ± 3.1 35.6 ± 4.7 < 0.001
Waist circumference, cm 87.3 ± 10.8 109.6 ± 11.4 < 0.001
Waist-hip ratio 0.87 ± 0.07 0.92 ± 0.06 < 0.001
Plasma leptin, ng/mL* 12.0 ± 12.0 35.1 ± 21.3 < 0.001
LEP3´HVR
Class I/I genotype Class I/II genotype Class II/II genotype HWE (p-value)
21% (23) 44% (48) 35% (39) 0.256
24% (24) 56% (56) 20% (20) 0.223
0.043
LEP -2548G > A
GG genotype GA genotype AA genotype HWE (p-value)
28% (31) 52% (57) 20% (22) 0.649
41% (41) 47% (47) 12% (12) 0.793
0.090
LEP combined genotypes
I/G (I/IGG + I/IGA + I/IIGG) II/A (I/IIAA + II/IIAA + II/IIGA) Others (I/IAA + I/IIGA + II/IIGG)
27% (30) 31% (34) 42% (46)
45% (45) 19% (19) 36% (36)
0.018
Cop
yright
© ABE&M t
odos os dir
eit
os r
eser
vados
.
Table 2. Univariate logistic regression analysis of the LEP variants
associated with obesity
Variables Categories Odds ratio 95% CI p-value
3´HVR genotypes Class II/II Class I/II Class I/I
1.00 3.12 1.89
-1.21 - 8.08 0.60 - 5.98
-0.019 0.278
-2548G > A genotypes AA GA GG
1.00 4.75 8.69
-1.30 - 17.36 2.22 - 34.05
-0.019 0.002
LEP combined
genotypes
II/A I/G Other
1.00 3.97 2.62
-1.30 - 5.55 0.69 - 2.85
-0.012 0.068
Variables were adjusted for covariates: age, gender, hypertension, hyperglycemia, coronary artery disease, cigarette smoking and sedentary life stile. CI, confidence interval. I/G genotypes, I/IGG + I/IGA + I/IIGG; II/A genotypes, I/IIAA+II/IIAA+II/GA; Other genotypes, I/IAA + I/IIGA + II/II + GG.
more risk for obesity than the -2548AA genotype carriers (p < 0.05). In addition, the risk for obesity was 4 times higher in I/G carriers (OR: 3.97, 95% CI: 1.30 - 5.55) than in those carrying II/A (p = 0.012).
Multivariate logistic regression analysis using step-wise criteria for selection of the genetic variables related with obesity was also tested. After adjustment for co-variates (age, hypertension, hyperglycemia, cigarette smoking, sedentary life style and CAD), only the LEP -2548GG genotype was associated with an increased risk for obesity (OR: 9.43, 95% CI: 1.84 – 48.31; p = 0.007) (data not shown).
The relationship between LEP variants and anthro-pometric and blood chemistry variables were also inves-tigated in this study (Table 3). Individuals carrying I/G genotypes had higher serum triglycerides when com-pared to the II/A carriers (p < 0.05). AIP values were also higher in I/G carriers than in those carrying other genotypes (p < 0.05). We investigated whether the relationship between LEP variants and these variables were inluenced by gender, considering that leptin and obesity-related traits (BMI, WC, WHR) were higher in women than in men (p < 0.05) (data not shown). I/G genotypes were associated with higher WC, BMI and leptin values in women but not in men (Figure 1).
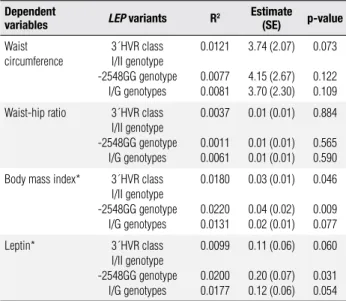
Univariate linear regression analysis showed that the variations in log-transformed values of the BMI were partially explained by LEP 3´HVR class I/II genotype (1.80%, p = 0.046) and -2548GG genotype (2.20%, p = 0.009), as indicated by the determinant coefi-cient (R2) (Table 4). Moreover, only 2% of variation
in log-transformed plasma leptin is explained by LEP -2548GG genotype (p = 0.031). Regression coef-icients (estimates) indicate that the carriers of the
Table 3. Anthropometric and blood chemistry data in individuals carrying
the LEP genotypes
Variables I/G II/A Others p-value
Number of individuals 75 53 82
Body mass index, kg/m2* 30.9 ± 6.9 28.0 ± 6.4 29.6 ± 7.1 0.070 Waist circumference, cm 101 ± 16 95 ± 15 96 ± 15 0.056
Waist-hip ratio, % 91 ± 7 89 ± 7 88 ± 7 0.082 Leptin, ng/mL* 26.1 ± 20.6 17.8 ± 15.6 23.4 ± 14.7 0.228
Glucose, mg/dL* 104 ± 27 101 ± 96 103 ± 30 0.850 Total cholesterol, mg/dL* 215 ± 42 214 ± 47 204 ± 42 0.203
HDL-c, mg/dL* 53 ± 13 56 ± 14 55 ± 15 0.461 LDL-c, mg/dL* 132 ± 34 129 ± 41 122 ± 34 0.222
VLDL-c, mg/dL* 30 ± 11 28 ± 15 27 ± 13 0.101 Triglycerides, mg/dL* 153 ± 60a 147 ± 83b 132 ± 65a,b 0.039
ApoAI, mg/dL* 136 ± 26 137 ± 26 136 ± 26 0.995 ApoB, mg/dL* 112 ± 27 108 ± 28 102 ± 24 0.099
ApoB/ApoAI ratio* 0.84 ± 0.25 0.82 ± 0.28 0.77 ± 0.21 0.202
AIP [log (triglycerides/ HDL-c)]*
0.44 ± 0.23a 0.37 ± 0.29a,b 0.34 ± 0.27b 0.048
Results are presented as mean ± SD and compared by one-way ANOVA. Values in a row with different superscript letters are significantly different, p < 0.05 (Tukey’s test). AIP, atherogenic index of plasma; ApoAI, apolipoprotein I; ApoB, apolipoprotein B; HDL-c, high-density lipoprotein cholesterol; LDL-c, low-density lipoprotein cholesterol; VLDL-c, very low-density lipoprotein cholesterol. (*) log-transformed data.
WC WHR BMI Leptin 0
25 50 75 100 125
I/G II/A
LEP genotypes
*
*
*
Units
WC WHR BMI Leptin 0
25 50 75 100 125
I/G II/A
LEP genotypes
Units
Figure 1. Anthropometric and plasma leptin values in women (A) and men
(B) carrying LEP I/G and II/A combined genotypes. Waist circumference
(WC, cm), waist-hip ratio (WHR, %), body mass index (BMI, kg/m2),
plasma leptin (ng/mL). Values presented as mean ± SD are compared by t-test (* p < 0.05).
A
Cop
yright
© ABE&M t
odos os dir
eit
os r
eser
vados
.
Table 4. Univariate linear regression analysis of the variables associated
with LEP variants
Dependent
variables LEP variants R
2 Estimate
(SE) p-value
Waist circumference
3´HVR class I/II genotype -2548GG genotype
I/G genotypes
0.0121
0.0077 0.0081
3.74 (2.07)
4.15 (2.67) 3.70 (2.30)
0.073
0.122 0.109
Waist-hip ratio 3´HVR class I/II genotype -2548GG genotype
I/G genotypes
0.0037
0.0011 0.0061
0.01 (0.01)
0.01 (0.01) 0.01 (0.01)
0.884
0.565 0.590
Body mass index* 3´HVR class I/II genotype -2548GG genotype
I/G genotypes
0.0180
0.0220 0.0131
0.03 (0.01)
0.04 (0.02) 0.02 (0.01)
0.046
0.009 0.077
Leptin* 3´HVR class I/II genotype -2548GG genotype
I/G genotypes
0.0099
0.0200 0.0177
0.11 (0.06)
0.20 (0.07) 0.12 (0.06)
0.060
0.031 0.054
Variables were adjusted to the covariates: age, gender, hypertension, hyperglycemia, CAD, cigarette smoking and sedentary file stile. SE, standard error. (*) log-transformed data.
3´HVR class I/II genotype had log-transformed BMI 0.03 more than the non-carriers. Moreover, log plasma leptin was 0.11 higher in 3´HVR class I/II genotype and 0.20 higher in-2548GG genotype in comparison with those carrying other genotypes (Table 4).
We also investigated whether the LEP variants were associated with hypertension, hyperglycemia, dyslipid-emia and CAD but no relationship was found between these clinical conditions and LEP variants in this sample (data not shown).
DISCUSSION
The LEP variants evaluated in this sample were asso-ciated with obesity. Individuals carrying the -2548GG genotype have higher risk for increased BMI than car-riers of the -2548GA+AA genotypes. Moreover, the -2548GG genotype carriers have 8 times more risk for obesity than the non-carriers suggesting that LEP -2458G>A polymorphism maybe a good predictor for obesity.
The association between LEP -2548G>A polymor-phism and increased BMI was also found in overweight Europeans and Taiwanese Aborigines with extreme obesity (15,16). We have also found a relationship between the -2548G>A variant and increased plasma leptin and BMI in Brazilian women (8). It is important to mention that the relationship between -2548GG genotype and obesity was found in recessive and co-dominant models, but not in the co-dominant model (16).
In addition, common variants located in the 5´region of the LEP, including -2548G>A, were associated with increased BMI in men (17). The presence of the GG genotype was also associated with increase in BMI and weight gain in persons treated with olanzapine (18-20). However, no association was found between this poly-morphism and obesity in a population-based case con-trol study in Spain (21).
In this study, LEP -2458GG genotype was also shown to be a predictor for increased plasma leptin. This result conirms the indings from other investiga-tions that showed an association between -2458AA (-/-) genotype and lower leptin levels in Caucasian obese girls and diabetic individuals from China (22,23). Con-versely, as commented previously, -2458AA genotype was associated with increased plasma leptin in obese in-dividuals (15). Moreover, carriers of this genotype had lesser decrease in circulating leptin after gastric banding surgery (24). The results from these studies are sug-gestive that the relationship between LEP -2548G>A and obesity-related phenotypes may be inluenced by sample characteristics such as gender, sample size, po-pulation and other.
The variant -2548G>A has been implicated in the regulation of LEP mRNA expression and consequently leptin plasma levels (25). Gong and cols. (26) have de-scribed two repetitive sequences MER11 and Alu lo-cated at the LEP promoter (-2514 to 1545) that may regulate LEP expression (26). In addition, the 3-kb 5´-lanking region contains several putative binding sites for known transcription factors, including CREB, GRE, Sp1, LP1, C/EBP and TATA motifs (26,27). A Sp1 functional placental enhancer was found within the MER11 repetitive element suggesting that expression of leptin is the result of insertion of this element (28). Re-cently, Moreno-Aliaga and cols. (29) reported that the Sp1 binding site has a key role in the transcriptional acti-vation of the LEP promoter by insulin-mediated glucose metabolism (29). Whether the -2548G>A variant locat-ed close to a Sp1 binding site (-2539) also modulates the transcription of the LEP remains to be investigated.
Cop
yright
© ABE&M t
odos os dir
eit
os r
eser
vados
.
to a 58% increase in obesity risk in another sample of our population (34). Therefore, the relationship be-tween LEP -2548G>A and increased BMI found in this study may be due to its linkage to Q223R or other LEPR polymorphisms.
The LEP 3´HVR is a (TTTC)
n tetranucleotide
re-peat located at the 3’ end of the LEP that has been as-sociated with increased risk for obesity and high plasma leptin levels as well (10-11). These effects may be due to the linkage of the 3’HVR with -2548G>A variant.
The presence of the LEP I/G genotypes was associ-ated with an increased risk for obesity-relassoci-ated pheno-type (BMI and WC) and the biomarker of plasma leptin. The inluence of I/G variant was further demonstrated to be related to gender, even though this variable did not affect the distribution of the LEP I/G genotypes. Accordingly, it has been shown that the association be-tween a LEP variant (A19G) and risk for obesity was restricted to females from the Atherosclerosis Risk in Communities (ARIC) Study (35).
Differences in plasma glucose were not related to LEP I/G genotypes, conirming the lack of association
between these variants and hyperglycemia. This result suggests that LEP variants may not be implicated in glucose homeostasis. Accordingly, insulin responses to glucose and insulin sensitivity were similar among Jap-anese carriers of LEP 3´HVR genotypes (36). Serum triglycerides and AIP values were found to be higher in LEP I/G carriers suggesting a possible role of LEP combinedgenotypes in lipid metabolism and cardiovas-cular risk. However, association analyses did not show relationship of the LEP variants with dyslipidemia and CAD evaluated by coronary angiography. Therefore, further investigations are necessary to evaluate these data in larger populations.
The lack of association between hypertension or cardiovascular disease and LEP 3´HVR has been also shown in other populations (37-39). Therefore, the as-sociation between obesity and hypertension and other risk factors for CAD previously found in our sample (8) seems to be independent of the LEP I/G genotypes.
It is noteworthy that the results from this study may be inluenced by the limited sample size, which reduced the power of the statistical tests. Therefore studies with larger samples from the Brazilian population are neces-sary to conirm our indings.
In conclusion, -2548G>A and 3´HVR variants of the LEP gene are in linkage disequilibrium, and I/G combined genotypes are associated with obesity-re lated
biomarkers and phenotype and it is likely that they con-tribute to the regulation of circulating leptin and tri-glycerides in a gender-dependent manner.
Acknowledgements: This study was supported by Fapesp (Grants no. 01/10708-3 and 06/04994-7), Sao Paulo, SP, Brazil. We thank Dr. F. D. V. Genvigir for her assistance in linkage disequi-librium analysis. H. M. Hinuy and S. S. Arazi were recipients of fellowships from Fapesp. M. H. Hirata and R. D. C. Hirata were granted fellowships from CNPq, Brasilia, DF, Brazil.
Disclosure: no potential conlict of interest relevant to this article was reported.
REFERENCES
1. Klok MD, Jakobsdottir S, Drent ML. The role of leptin and ghrelin in the regulation of food intake and body weight in humans: a review. Obes Rev. 2007;8:21-34.
2. Korner J, Woods SC, Woodworth KA. Regulation of energy ho-meostasis and health consequences in obesity. Am J Med. 2009;122(S1):S12-8.
3. Considine RV. Human leptin: an adipocyte hormone with weight-regulatory and endocrine functions. Semin Vasc Med. 2005;5:15-24. 4. Paracchini V, Pedotti P, Taioli E. Genetics of leptin and obesity: a
HuGE review. Am J Epidemiol. 2005;162:101-4.
5. Rankinen T, Zuberi A, Chagnon YC, Weisnagel SJ, Argyropoulos G, Walts B, et al. The human obesity gene map: the 2005 update. Obesity (Silver Spring). 2006;14:529-644.
6. Martinez-Hernandez A, Enriquez L, Moreno-Moreno MJ, Marti A. Genetics of obesity. Public Health Nutr. 2007:10:1138-44. 7. Yiannakouris N, Melistas L, Yannakoulia M, Mungal K, Mantzoros
CS. The-2548G/A polymorphism in the human leptin gene pro-moter region is associated with plasma free leptin levels; inte-raction with adiposity and gender in healthy subjects. Hormones (Athens). 2003;2:229-36.
8. Hinuy HM, Hirata MH, Forti N, Diament J, Sampaio MF, Armaga-nijan D, et al. Leptin G-2548A promoter polymorphism is asso-ciated with increased plasma leptin and BMI in Brazilian women. Arq Bras Endocrinol Metabol. 2008;52:611-6.
9. Ali SB, Kallel A, Ftouhi B, Sediri Y, Feki M, Slimane H, et al. Asso-ciation of G-2548A LEP polymorphism with plasma leptin levels in Tunisian obese patients. Clin Biochem. 2009;42:584-8. 10. Gardezi AZ, Ziaei YZ, Marahi SM. Microsatellite
polymor-phism of the human leptin gene and risk of obesity. J Crit Care. 2008;23:440-4.
11. Hinuy HM, Hirata MH, Sampaio MF, Armaganijan D, Salazar LA, Hirata RD. LEP 3’HVR is associated with obesity and leptin levels in Brazilian individuals. Mol Genet Metab. 2006;89:374-80. 12. Parra FC, Amado RC, Lambertucci JR, Rocha J, Antunes CM, Pena
SD. Color and genomic ancestry in Brazilians. Proc Natl Acad Sci USA. 2003;100:177-82.
13. Salazar LA, Hirata MH, Cavalli SA, Machado MO, Hirata RD. Op-timized procedure for DNA isolation from fresh and cryopreser-ved clotted human blood useful in clinical molecular testing. Clin Chem. 1998;44:1748-50.
14. Yoo J, Seo B, Kim Y. SNPAnalyzer: a web-based integrated work-bench for single-nucleotide polymorphism analysis. Nucleic Aci-ds Res. 2005;33:W483-8.
15. Mammes O, Betoulle D, Aubert R, Herbeth B, Siest G, Fumeron F. Association of the G-2548A polymorphism in the 5’ region of the LEP gene with overweight. Ann Hum Genet. 2000;64:391-4. 16. Wang TN, Huang MC, Chang WT, Ko AM, Tsai EM, Liu CS, et al.
ex-Cop
yright
© ABE&M t
odos os dir
eit
os r
eser
vados
.
treme obesity in Taiwanese aborigines. Obesity (Silver Spring). 2006;14:183-7.
17. Jiang Y, Wilk JB, Borecki I, Williamson S, DeStefano AL, Xu G, et al. Common variants in the 5’ region of the leptin gene are as-sociated with body mass index in men from the National Heart, Lung, and Blood Institute Family Heart Study. Am J Hum Genet. 2004;75:220-30.
18. Bouchard L, Tremblay A, Bouchard C, Perusse L. Contribution of several candidate gene polymorphisms in the determination of adiposity changes: results from the Québec Family Study. Int J Obes (Lond). 2007;31:891-9.
19. Ellingrod VL, Bishop JR, Moline J, Lin YC, Miller del D. Leptin and leptin receptor gene polymorphisms and increases in body mass index (BMI) from olanzapine treatment in persons with schizo-phrenia. Psychopharmacol Bull. 2007;40:57-62.
20. Kang SG, Lee HJ, Park YM, Choi JE, Han C, Kim YK, et al. Possible association between the -2548A/G polymorphism of the leptin gene and olanzapine-induced weight gain. Prog Neuropsycho-pharmacol Biol Psychiatry. 2008;32:160-3.
21. Portoles O, Sorli JV, Frances F, Coltell O, Gonzalez JI, Saiz C, et al. Effect of genetic variation in the leptin gene promoter and the leptin receptor gene on obesity risk in a population-based case-control study in Spain. Eur J Epidemiol. 2006;21:605-12. 22. Le Stunff C, Le Bihan C, Schork NJ, Bougneres P. A common
pro-moter variant of the leptin gene is associated with changes in the relationship between serum leptin and fat mass in obese girls. Diabetes. 2000;49:2196-200.
23. Ren W, Zhang SH, Wu J, Ni YX. Polymorphism of the leptin gene promoter in pedigrees of type 2 diabetes mellitus in Chongqing, China. Chin Med J (Engl). 2004;117:558-61.
24. Poitou C, Lacorte JM, Coupaye M, Bertrais S, Bedel JF, Lafon N, et al. Relationship between single nucleotide polymorphisms in leptin, IL6 and adiponectin genes and their circulating product in morbidly obese subjects before and after gastric banding sur-gery. Obes Surg. 2005;15:11-23.
25. Hoffstedt J, Eriksson P, Mottagui-Tabar S, Arner P. A polymor-phism in the leptin promoter region (-2548 g/a) inluences gene expression and adipose tissue secretion of leptin. Horm Metab Res. 2002;43:355-9.
26. Gong DW, Bi S, Pratley RE, Weintraub BD. Genomic structure and promoter analysis of the human obese gene. J Biol Chem. 1996;271:3971-4.
27. Mason MM, He Y, Chen H, Quon MJ, Reitman M. Regulation of leptin promoter function by Sp1, C/EBP, and a novel factor. Endo-crinology. 1998;139:1013-22.
28. Bi S, Gavrilova O, Gong DW, Mason MM, Reitman M. Identii-cation of a placental enhancer for the human leptin gene. J Biol Chem. 1997;272:30583-8.
29. Moreno-Aliaga MJ, Swarbrick MM, Lorente-Cebrian S, Stanhope KL, Havel PJ, Martinez JA. Sp1-mediated transcription is involved in the induction of leptin by insulin-stimulated glucose metabo-lism. J Mol Endocrinol. 2007;38:537-46.
30. Chagnon YC, Wilmore JH, Borecki IB, Gagnon J, Pérusse L, Chag-non M, et al. Associations between the leptin receptor gene and adiposity in middle-aged Caucasian males from the HERITAGE family study. J Clin Endocrinol Metab. 2000;85:29-34.
31. Mattevi VS, Zembrzuski VM, Hutz MH. Association analysis of genes involved in the leptin-signaling pathway with obesity in Brazil. Int J Obes Relat Metab Disord. 2002;26:1179-85.
32. Mizuta E, Kokubo Y, Yamanaka I, Miyamoto Y, Okayama A, Yoshi-masa Y, et al. Leptin gene and leptin receptor gene polymorphis-ms are associated with sweet preference and obesity. Hypertens Res. 2008;31:1069-77.
33. Ali BS, Kallel A, Sediri Y, Ftouhi B, Feki M, Slimene H, et al. LEPR p.Q223R Polymorphism inluences plasma leptin levels and body mass index in Tunisian obese patients. Arch Med Res. 2009;40:186-90.
34. Duarte SF, Francischetti EA, Genelhu VA, Cabello PH, Pimentel MM. LEPR p.Q223R, beta3-AR p.W64R and LEP c.-2548G>A gene va-riants in obese Brazilian subjects. Genet Mol Res. 2007;6:1035-43. 35. Hart Sailors ML, Folsom AR, Ballantyne CM, Hoelscher DM,
Ja-ckson AS, Linda Kao WH, et al. Genetic variation and decreased risk for obesity in the Atherosclerosis Risk in Communities Study. Diabetes Obes Metab. 2007;9:548-7.
36. Shintani M, Ikegami H, Fujisawa T, Kawaguchi Y, Ohishi M, Kat-suya T, et al. Leptin gene polymorphism is associated with hypertension independent of obesity. J Clin Endocrinol Metab. 2002;87:2909-12.
37. Rutkowski MP, Klanke CA, Su YR, Reif M, Menon AG. Genetic ma-rkers at the leptin (OB) locus are not signiicantly linked to hyper-tension in African Americans. Hyperhyper-tension. 1998;31:1230-4. 38. Maestrini S, Mencarelli M, Verti B, Walker GE, Savia G, Marzullo P,
et al. Lack of association between the tetranucleotide repeat polymorphism in the 3’-lanking region of the leptin gene and hypertension in severely obese patients. J Endocrinol Invest. 2006;29:776-80.