Printed version ISSN 0001-3765 / Online version ISSN 1678-2690 http://dx.doi.org/10.1590/0001-3765201620140530
www.scielo.br/aabc
Relevance of Hydrodynamic Effects for the Calculation of Outer Surface
Potential of Biological Membrane Using Electrophoretic Data
IZAN M. SILVA JUNIOR, MARIA CLÍCIA S. CASTRO, DILSON SILVA and CÉLIA M. CORTEZ
Universidade do Estado do Rio de Janeiro, Instituto de Matemática e Estatística, Rua São Francisco Xavier, 524, 6º andar, 20551-900 Rio de Janeiro, RJ, Brasil
Manuscript received on November 19, 2014; accepted for publication on August 31, 2015 ABSTRACT
In this paper, we present the results of a study on the infl uence of hydrodynamic effectson the surface potentials of the erythrocyte membrane, comparing two different models formulated to simulate the electrophoretic movement of a biological cell: the classical Helmholtz-Smoluchowski model and a model presented by Hsu et al. (1996). This model considers hydrodynamic effects to describe the distribution of the fl uid velocity. The electric potential equation was obtained from the non-linear Poisson–Boltzmann equation, considering the spatial distribution of electrical charges fi xed in glycocalyx and cytoplasmic proteins, as well as electrolyte charges and ones fi xed on the surfaces of lipidic bilayer. Our results show that the Helmholtz-Smoluchowski model is not able to refl ect the real forces responsible to the electrophoretic behavior of cell, because it does not take account the hydrodynamic effects of glycocalyx. This charged network that covers cellular surface constitutes a complex physical system whose electromechanical characteristics cannot be neglected. Then, supporting the hypothesis of other authors, we suggest that, in electrophoretic motion analyses of cells, the classical model represents a limiting case of models that take into account hydrodynamic effects to describe the velocity distribution of fl uid.
Key words: Modeling, electric potential profile, erythrocyte membrane, electrophoretic mobility, glyco-calyx, hydrodynamic effects.
Correspondence to: Celia Martins Cortez E-mail: [email protected]
INTRODUCTION
The electric surface potential is an important control parameter of the cellular metabolic process (Cortez et al. 2008, Genet et al. 2001, Bruner 1986). The activity of most enzymes is affected by this potential, since it is able to alter the passive transport rates and local concentrations of substrates and anionic ligands (Cortez and Bisch 1993, Ahrens 1983, Nørby and Essmann 1997, Dong et al. 2007). It also directly infl uences on the morphological and mechanical properties of erythrocytes, as remarked by Cortez and Bisch (1995, 1996), interfering in their movement through blood capillaries.
contributing to impaired physiological function and ageing process (Chen et al. 2007). The biconcave form of the erythrocyte is attributed to the appropriate balance among hydrostatic pressure, electrostatic forces and membrane tension (Katnik and Waugh 1990, Lopez et al. 1968); thus, the evaluation of cell surface electrical properties constitutes a basic condition to the understanding of its hydrodynamics and physiology. Electrochemical aspects of the erythrocyte membrane have been studied based on diverse models. It is well known that, like other cells of mammals, erythrocytes have a net negative surface charge at physiological pH. Classically, the Helmholtz-Smoluchowski equation (HS-equation) is consider valid to estimate the electrical surface potential and charge density of cells from electrophoretic data (Eylar et al. 1962), but now its validity scale has been examined. Searching a more realistic mathematical interpretation for experimentally determined electrophoretic mobility (µ), several models have been formulated. Many of them take into account the structure of the glycocalyx and its infl uence on the cell peripheral regions (Chen et al. 2007, Mehrishi and Bauer 2002, Hsu et al. 1993, Levine et al. 1983, Sharp and Brooks 1985, Donath and Lerche 1980).
The study of electric characteristics of cell surface and the electric potential profi le across the membrane using electrophoretic data can effectively contribute to the study of alterations in diffuse electrical double layers in function of changes at the lipid bilayer surface, and vice versa (Pinto et al. 2014, Cruz et al. 2000, Heinrich et al. 1982). The diffuse double layer occurs in the electrolytic solution very near the lipid bilayer surfaces. This accumulation of electric charges on both sides of membrane affects its mechanical properties (Ziebert and Lacoste 2010), infl uencing in the affi nity, adhesivity, aggregation and endocytosis, as well as the cellular mobility and immunity (Chen et al. 2007, Pöckel-Fernandes et al. 2011, Nagura et al. 1973).
In this paper, we are presenting results of a study on the infl uence of hydrodynamic effects in the surface potentials of erythrocyte membrane. For this, we built a membrane model considering the spatial charge distribution fi xed on the glycocalyx and cytoplasmatic proteins, as well as electrolytic charges (mono and divalent electrolytes) and ones fi xed at lipidic bilayer.
Then, effects of electrophoretic mobility, ionic strength, and surface charges on the surface potentials and potential profi le were verifi ed based on two different models formulate to simulate the electrophoretic motion of a biological cell: the classical Helmholtz-Smoluchowski model and a model presented by Hsu et al. (1996). For the numerical simulations, we used values of eletrophoretic mobility given by Bateman and Zellmer (1956) for four different ionic strength values.
ELECTROPHORETIC MOBILITY AND THE CHARGES ON CELL SURFACE
It is well known that, under physiological pH and ionic strength conditions, erythrocytes of many animal species exhibit a negative electrophoretic mobility, especially due to charged groups present in the glycocalyx layer (Jitendra et al. 2002, Jan and Chien 1973). There are strong evidences that the carboxyl group of sialic acid is mainly responsible for that negativity rather than phosphate groups of phospholipids (Eylar et al. 1962, Kabanov et al. 2008).
to the cell membrane, and containing uniformly distributed charges. Stokes friction forces generated by segments of an idealized polymer were taken as dominant for the fl uid fl ow in the glycocalyx. Thus, the authors obtained an expression for µ in function of the glycocalyx thickness and the mean radius of polymer segment, concluding that µ for a cell is closely related to the properties of the membrane phase.
In 1993, Hsu et al. extended the mathematical treatment applied to a particle coated with a layer of charged polymer to the case of a continuous distribution of fi xed charge. Then, Hsu and Kuo (1994) examined the electrophoretic mobility for an ion-penetrate cell, considering the case of a linear or exponential distribution of fi xed charges. Hsu and Fan, in 1995, analysed the case when the permittivity of the membrane phase was position-dependent for low potential values and/or symmetrical electrolytes. As the models did not consider a nonlinear Poisson-Boltzmann equation, they did not conduce to an explicit form for the electrical potential distribution, and the electrophoretic mobility expressions derived contained an implicit integration. In 1996, Hsuet al. introduced in the model of planar particle covered by a membrane the case of asymmetric electrolyte solutions, examining the effects of the parameters characterizing the nature of the liquid phase on the electrophoretic mobility.
ADOPTED MODEL AND METHOD
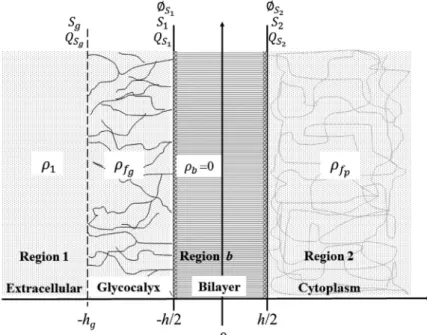
Figure 1 shows the adopted model in our study. It is constituted by 4 different regions: electrolytic phase surrounding the cell or bulk phase (region 1), glycocalyx region (region g), lipidic bilayer (region b) and cytoplasmatic region (region 2). As schematized of this fi gure, proteins are generic proteins, including channel ones.
The extracellular bulk region is constituted by extracellular electrolytic solution, where the spatial charge density is denoted by
ρ
1. Homogeneous spatial distributions of electric charges are found in glycocalyx and cytoplasm regions, denoted respectively byg
f
ρ
and pf
ρ
. The density pf
ρ
is due to groups mainly fi xed to cytoplasmic proteins. The origin of the cartesian coordinate axis is located at the center ofthe lipid bilayer, the glycocalyx extends from z=-h/2 to z=-hg, and the membrane surface is coincident with the glycocalyx surface (Sg), i.e., Sg is the interface bulk phase/glycocalyx, where the surface electric charge density is denoted by
g
S
Q
.The lipidic bilayer (region b) has dielectric constant
ε
f and thickness h, being delimitated by surfaces S1 and S2, which correspond to interfaces glycocalyx/bilayer (z=-h/2) and cytoplasm/bilayer (z=h/2), respectively. We named1
S
Q
and2
S
Q
the surface electric charge densities on S1 and S2, respectively. These charges are due to charged groups of phospholipid heads, being the phospholipid distribution in the two monolayers asymmetric (Gurtovenko and Vattulainen 2007, Hall and Latorre 1976). It is known that in the erythrocyte membrane, phosphatidylserine and phosphatidylethanolamine are preferentially located in the inner monolayer, whereas phosphatidylcholine and sphingomyelin are found in the outer monolayer. Phosphatidylserine is pointed as mainly responsible to the negative charge on the inner membrane surface (Heinrich et al. 1982).Our model considered that all charge distributions, spatial and surface, were homogeneous, and that the charge density QS1 was negligible, because of the dominant presence of neutral phospholipids in the outer layer of bilayer. In addition, due to the high hydrophobic degree in the lipidic bilayer,
ρ
b was taken as being vanish (ρ
b=0) (Cortez et al. 2008).Electric Potential Equations. For the adopted membrane model, the Poisson’s equation is written as
For i=1,g,b,p (1)
whose solution gives the electric potential φ(x,y,z) in any point of region i (i=1,g,b,2), and
ρ
i is the volumetric charge density due to electrolytes in solution, andi
f
ρ
is the volumetric density of fi xed charges in glycocalyx (g
f
ρ
) or cytoplasm proteins ( pf
ρ
), andε
i is the permittivity.As electric charges were homogeneously distributed on all surfaces, the electric potential in Eq. 1 was only depended on coordinate z. In bilayer, this equation assumes the form
∇
2φ
i( )
z
=
0
, since0
p
b f
ρ
=
ρ
=
(Figure 1), whose solution is a family of linear function, and electric fi eld in bilayer (E
b) is given by1 2)
(
) /
b S S
E
=
φ φ
−h
.The adopted boundary conditions were: (a) for z→-∞ (i=1) and z→∞ (i=p), bulk regions, the electric potential tended to the limit values
1
0
φ
and2
0
φ
, respectively, and the ionic concentrations assumed the values01
Sγ
η
and02
Sγ
η
; (b) at z=-hg and z=±h/2, the electric potential continuity was considered, assuming the valuesg
S
φ
on Sg,1
S
φ
on S1 and2
S
φ
on S2; (c) at these interfaces, the condition of discontinuity of electric displace-ment fi eld is considered.The density
ρ
ian be obtained from the summation of concentrations of positive and negative ions, , where Zγ is the valence of ion γ, e is the electron charge, andi
γ
η
is the molar concentration of ion γ. The electrochemical potential for ionic solutes in a diluted solution is given by *(
,
)
( )
Z
i i i i i
u
γ=
u
γP T
+
KTln
η
γ+
γe
φ
, where *(
,
)
i
u
γP T
is the term due to pressure and temperature,( )
iTln
η
γ is the term due to the ionic concentration, refers to electric potential, and KT are the Boltzmann’s constant, and absolute temperature, respectively.Using the electrochemical potential equation and taking into account the homogeneity of charge distribution on bilayer surface and the Boltzmann’s electrochemical equilibrium (
0
i
z
u
γ∇
=
and(
,
)
0
i
z
u
γP T
, (2)
where j
S
φ
is the electric potential on Sj ( j=g,1,2), is molar concentration of γ at surface Sj. Eq. 2 is theBoltzmann distribution of charge due to ion
γ
in phases adjacent to the bilayer.
Substituting Eq. 2 in Eq. 1, and considering the electroneutrality condition for solutions
( ), we have
, (3)
and considering only mono and divalent ions in the model, we have that
( )
(
(
)
)
(
(
)
)
2 2
4
z
k
k
2
i,
i j i j
f
i m i S d i S
i
sinh
sinh
z
πρ
φ
β φ φ
β φ φ
ε
∂
=
−
+
−
−
∂
(4)where β = e/KT,
=
γ and .Taking into account the boundary conditions mentioned above and that sinh (2βu) = 2sinh (βu) . cosh (βu), the integration of Eq. 4 gives
( )
21
(
)
2(
(
)
)
4
2z
2k
k
,
2
i
i j i j
f
i m i S d i S Si
i
sinh
sinh
E
z
πρ
φ
β φ φ
β φ φ
β
β
ε
∂
=
⎛
−
⎞
+
−
−
+
⎜
⎟
⎝
⎠
∂
for i=g,p (5)which is the equation for glycocalyx (i=g and j=1) and cytoplasmic regions (i=p and j=2), where
0
i
f
ρ ≠
. For bulk regions (i=1 and j=g), where0
i
f
ρ =
, Eq. 5 becomes( )
(
)
(
(
)
)
2
1
22k
k
2
z
,
i j i j
m i S d i S
i
sinh
sinh
z
β φ φ
β φ φ
φ
β
⎛
−
⎞
+
−
⎜
⎟
⎝
⎠
∂
=
∂
for i=1; j=g (6)
Outer Surface Charges. In the classical Helmholtz-Smoluchowski theory, µ is defi ned as µ = U/E, being U the steady-state velocity of the charged particlesmoving in the electrophoretic fi eld, and E is the electric fi eld strength, and it can be written as
(
0)
,
4
i S i
ε φ
φ
µ
πυ
−
=
(7)where
(
0)
iS
φ
−
φ
is zeta potential, beingφ
S the cell surface potential and 0 iφ
is the outer bulk potential (potential at the steady-state region, far from the membrane surface), which is normally considered vanish; ν is the medium viscosity.the dimensions of glycocalyx, where there is a spatial distribution of electric charges, and the radius of cellular curvature.
In the model of Hsu et al. (1996), µ is estimated considering the cellular movement in the electropho-retic fl uid, and the distribution of fl uid velocity is described by the Navier-Stokes equation:
( )
( )
( )
2 2
x
x
x
0,
x
dd V
V
E
d
υ
−
ξ
+
ρ
=
(8)where ν is the medium viscosity,
ζ
denotes the membrane friction coeffi cient, and E is the electric fi eld strength. For convenience, they assumed that the coordinate moved with the cell, and considered the following boundary conditions:and
/ x
0, when x
0,
V
→ −
U
dV d
→
→
(9)(
x
/ 2
)
(
x
/ 2 ,
)
V
→ −
h
−=
V
→ −
h
+ (10)(
dV d
/ x
)
z→−h/ 2=
(
dV D
/
x
)
z→−h/ 2+,
(11)where U is constant.
The mobility µof the cell, considering that µ = U/E, can be estimated by
( )
2 1tanh
X
X d dd
d
D
M
D
M
d
ψ
µ
λ
ψ
→ +
⎡
⎛
⎞
⎤
=
⎢
−
⎜
⎟
⎥
−
+
⎝
⎠
⎣
⎦
′
, For (12)where is dimensionless potential, d′ is the adimensional glycocalyx thickness and X the adimensional distance. In this case, , and
X
=
k
Dx
where is the surface potential, d is the glycocalyx thickness,k
D is the inverse of Debye length, is a measure of the asymmetry degree ofelectrolytes, F and R are the Faraday and ideal gas constants,respectively, and T is the absolute temperature. In addition,
, (13)
( )
( )
2 1 1
0 0
1
2
d d
d d d d
D
e
λe
λR X dX
e
λe
λR X dX
′ ′
′ − ′ − ′ ′
⎧
⎫
⎪
⎪
=
⎨
+
⎬
⎪
⎪
⎩
∫
∫
⎭
, (14)w
here( ) ( )
(
)
1
b X a X
MG
M
R
e
e
a b
a b
ψ −ψ
=
=
−
+
+
, (15)2
RF
M
F
ε
υ
2
2
Dk
b
a
−
=
, (17)These expressions suggest that the mobility is related to the electric potential at the interface bulk phase-glycocalyx and the electric potential distribution in the glycocalyx region.
From the boundary conditions and Eq. 8, Hsu et al. (1996) shows that
( )
( )
( )
( )
1
1
X X
i g
u X
=
M
ψ
X
µ
− =
u
X
=
Ae
λ+
Be
−λ+
D X
µ
(18)where
(
)
(
)
2 2
1
1
g
S g
A
=
MK
φ
−
D sinh
λ
h
µ
−
and B=-A (19)Using these equations, it is possible to estimate the potential at glycocalyx surface (cell surface, Sg. The analytical solution for Eq. 5 and Eq. 6 is not trivial. Then, the integrations through glycocalyx and cytoplasm regions were performed by means of numerical computation, using the forth order Range-Kutta method. All programs were built in C language and Table I shows some numerical values used in calculations.
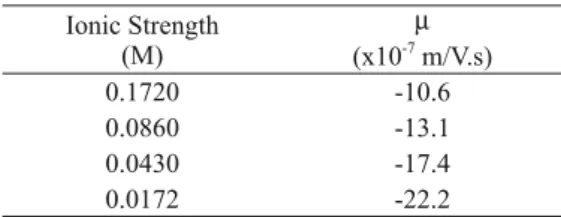
To estimate g
S
φ
and gS
Q
, we used Eqs 18 and 19 (Hsu et al. 1996), and Eq. 7 (HS-equation), applying the µ-values to four different ionic strength values taken from Bateman and Zellmer (1956), Table II.TABLE I
Values of parameters used for calculation.
Parameter Value Ref.
Membane dielectric constant 2
---Bulk dielectric constant 81
---Glycocalyx thickness 5.5 nm Heinrich et al. 1982
Bilayer thickness 7.5nm Blank et al. 1979
Extracellular concentration of univalent ions 160 mM Guyton 1984 Extracellular concentration of divalent ions 12.5 mM Guyton 1984 Intracellular concentration of univalent ions 155 mM Guyton 1984 Intracellular concentration of divalent ions 6 mM Guyton 1984 Spatial charge density in glycocalyx -3.50 x 10⁻⁴
C/m3
Cook et al. 1961 Spatial charge density in cytoplasm -1.23 x 10⁻⁷
C/m3
Elgsaeter et al. 1986 Charge density at inner bilayer surface -0.09 C/cm2
Hsu et al. 1993
Resting transmembrane Potential -12mV Dong et al. 2007
Permeability for Cl
-2.1 x 10⁻⁸
cm/s Hunter 1977
Permeability for K+ -2.0 x 10⁻⁸ cm/s Hunter 1977
Temperature 310 ºK
---TABLE II
Electrophoretic Mobility versus Ionic Strength.
Ionic Strength (M)
µ
(x10-7
m/V.s)
0.1720 -10.6
0.0860 -13.1
0.0430 -17.4
0.0172 -22.2
RESULTS AND DISCUSSION
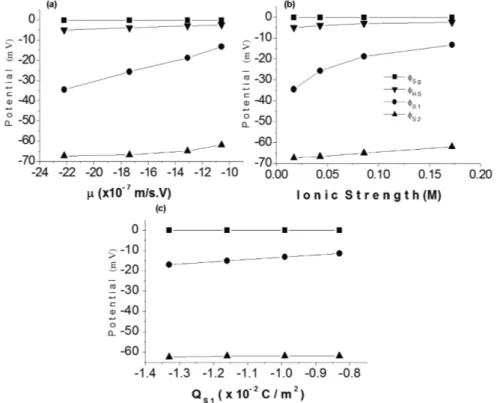
Figure 2(a) and 2(b) show how, according to our model, potentials g
S
φ
,1
S
φ
and2
S
φ
vary with the increase of µ and outer ionic strength, when surface charges were kept fi xed. The potential1
S
φ
was the most infl uenced by the increase of these parameters. Examining these fi gures, it can be observed that the plot forφ
HS, estimated through the HS-equation (Eq. 7), is located between the plots forg
S
φ
and1
S
φ
, but closer to gS
φ
than to1
S
φ
. These two plots were obtained associating the model of Hsu et al. (1996) to our model. However, the increase ratio ofφ
HS (52%) with the variation of µ (Figure 2(a)) and of ionic strength (Figure 2(b)) was nearer that calculated for1
S
φ
(60%) than for gS
φ
(35%).In agreement to observations of other authors (Chen et al. 2007, Mehrishi and Bauer 2002, Hsu et al. 1993, Levine et al. 1983, Sharp and Brooks 1985, Donath and Lerche 1980), these results evidence the limitation of the HS-equation to estimate the surface potential for cells. It is a good electrophoretic model for charged and rigid surface particles moving through electric fi eld, but it seems very simple to refl ect forces involved in electrophoretic motion of cells. The Helmholtz-Smoluchowski model do not compute the three-dimensional charged network that covers the biological cells, and the electric fi eld generated by this network is not small, and can be determinant for the calculation of µ.
Figure 2(c) evidences the fall in the potentials g
S
φ
,1
S
φ
,2
S
φ
with the negative charge density on the outer bilayer surface (1
S
Q
). It is important to observe the linearity in the three plots. An increase of 62% in QS1 -negativity caused a decrease of about 33% in theg
S
φ
-value (Figure 2(c)).Figure 2 - Potentials at glycocalyx surface (
g
S
φ ), outer (
1
S
φ ) and inner (
2
S
This variation cannot be neglected, and it shows that charges in glycocalyx and on bilayer surfaces contribute to the potential difference responsible for the motion of erythrocytes in an electrophoretic fi eld, although the electrical double layer extends over only about 1 nm from lipidic bilayer surface in physiological conditions. In addition, covering this surface there is a peripheral zone containing a glycoprotein layer, which extends over about 6 nm to the cell limit surface. This layer possesses a spatial distribution of ionogenic groups of sialic acid. (Chen et al. 2007, Mehrishi and Bauer 2002, Hsu et al. 1993, Levine et al. 1983, Sharp and Brooks 1985, Donath and Lerche 1980, Heinrich et al. 1982, Kawahata et al. 1990).
According to Eylar et al. (1962), the treatment of erythrocyte with neuraminidase is able to remove 95-100% of acid sialic from the cell surface, and it reduces µ. Removal by enzyme of 50% of total sialic acid from the outer cell layer can decrease the calculated surface charge of about 66%. It means that the electrophoretic cell motion would be specially produced by charges of glycocalyx. But our modelling evidences that the contribution given by the surface bilayer charges to the surface cell potential (
g
S
φ
) cannot be neglected. It is also important to consider that the precise distribution of the sialic acid molecules in the cellular surface is not known and this distribution is not independent to surface bilayer charge.To study the effect of ionic strength, surface charges and transmembrane potential on the potential profi le across membrane, we considered two distinct conditions: (A) the density
1
S
Q
varied, but2
S
Q
and ionic strength kept fi xed for all1
S
Q
. Thus, all penetrating ions (Na+, K+ and Cl-) maintained into electrochemical equilibrium and the transmembrane potential (Δφm) was approximately fi xed; (B) the ionic strength varied, while1
S
Q
and2
S
Q
kept fi xed for all ionic strength values. All penetrate ions (Na+, K+ and Cl-) maintained into electrochemical equilibrium, being the membrane permeability very high to Cl-, very low to K+ andit was practically impermeant to others ions. The cellular electroneutrality was maintained by intra and extracellular chemical potentials due to Cl- and K+. Thus, the transmembrane potential (Δφ
m) signifi cantly
changed with the ionic strength variation. To estimate Δφm for each ionic strength, we used the Nernst equation for chloride, , which is known as a good approximation for erythrocytes, where
[
Cl
−]
in and[
Cl
−]
ou are inner and outer chloride concentrations, respectively. The situation A simulated the experimental condition in which an enzyme (like neuraminidase) is used to remove charged groups from membrane surface, reducing then the surface charge without however altering the electrolytic equilibrium (Coakley and Deeley 1982, Mironov and Dolgaya 1985).Figure 3 compares the electric potential profi le for four values of
1
S
Q
: -0.8x10⁻², -1.0x10⁻², -1.1x10⁻² and -1.3x10⁻² C/m-2, considering the condition A, in which1
S
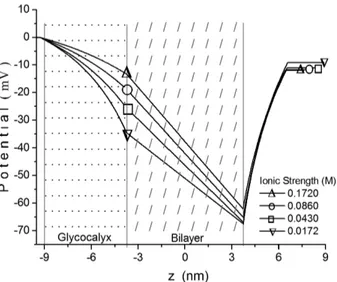
Q
varied without any change in the ionic strength. In Figure 4, we can see the electric potential profi le for four different values of outer ionic strength: F1, 0.5F1, 0.25F1 and 0.1F1 (Table II), taking into account the condition B. In these last fi gures, values ofg
S
φ
andg
S
Q
were also calculated based on the model of Hsu et al. (1996), using electrophoretic data given by Bateman and Zellmer (1956).(Figure 4) provoked a relevant deviation on the outer potential profi le, and a considerable change in the intramembrane electric fi eld.
According to Cortez and Bisch (1993), the alteration in the potential profi le is less pronounced when the ionic strength and surface charges vary together. They studied the behavior of the potential profi le of erythrocyte membranes using a simpler model that was described by a linear Poisson-Boltzmann equation, and they applied the HS-equation to estimate outer surface charge densities. The comparison of potential profi les shown in Figure 4 to those calculated by Cortez and Bisch (1993), for the same ionic strength values, evidences the important change in the intracellular potential profi le provoked by the inclusion of the term for representing the spatial charge density due to cytoplasmic protein ionic groups in the Poisson-Boltzmann equation.
Figure 4 - Electric potential profi le for four values of ionic strength (F): F1, 0.5F1, 0.25F1 and 0.1F1 (F1 is reference value, Table II), considering the situation B. Potential and charge density at Sgwere estimated based on the model of Hsu et al. (1996), Eqs. 18 and 19, using membrane values shown in Table I, and electrophoretic data given in Table II.
Figure 3 - Electric potential profi le for four values of surface charge density (
1
S
Q): -0.8x10⁻²
C, -1.0x10⁻²
C, -1.1x10⁻²
C, -1.3x10⁻² C, considering the situation A. Potential and charge density at Sgwere estimated based on the model of Hsu et al. (1996), Eqs. 18 and 19, using membrane values shown in Table I, and electrophoretic data given in Table II.
CONCLUSIONS
Our results showed that values of electric potential of the surface cell generated by HS-equation (
φ
HS) do not refl ect the real forces responsible for the electrophoretic cellular behavior. However, the equation may be useful for approximating, since the graph of φHS in function of µ was found betweeng
S
φ
and1
S
φ
plots (obtained from our model equations), and φHS-values were closer to φSg-values than those for1
S
φ
.hydrodynamic considerations, in addition to electrostatic data. Thus, our results are in agreement with the suggestion of Hsu et al. (1996) that the HS-model in analysis the electrophoretic motion of cells could be recovered as a limiting case of models which take into account hydrodynamic effects to describe the fl uid velocity distribution.
ACKNOWLEDGMENTS
The authors thank Fundação Carlos Chagas Filho de Amparo à Pesquisa do Estado do Rio de Janeiro (FAPERJ) for providing fi nancial support to this work.
RESUMO
Neste artigo, estamos apresentando os resultados de um estudo sobre a infl uência de efeitos hidrodinâmicos sobre os potenciais superfi ciais da membrana do eritrócito, comparando dois modelos diferentes formulados para simular o movimento eletroforético de uma célula biológica: o modelo clássico de Helmholtz-Smoluchowski e um modelo apresentado por Hsu et al. (1996). Este modelo considera efeitos hidrodinâmicos para descrever a distribuição da velocidade do fl uido. A equação do potencial eletrônico foi obtida da equação não linear de Poisson-Boltzmann, considerando a distribuição espacial das cargas elétricas fi xas no glicocálix e nas proteínas citoplasmáticas, assim como as cargas eletrolíticas e as fi xas nas superfícies da bicamada. Nossos resultados mostram que o modelo de Helmholtz-Smoluchowski não é capaz de refl etir as forças reais responsáveis pelo comportamento eletroforético de células, pois este não leva em conta os efeitos hidrodinâmicos do glicocálix. Esta rede carregada que cobre a superfície celular constitui um sistema físico complexo cujas características eletromecânicas que não podem ser desprezadas. Assim, corroborando a hipótese de outros autores, sugerimos que, em análises de movimento eletroforético de células, o modelo clássico representa um caso limite de modelos que levam em conta os efeitos hidrodinâmicos para descrever a distribuição de velocidade do fl uido.
Palavras-chave: Modelagem, perfi l de potencial elétrico, membrana do eritrócito, mobilidade eletroforética, glicocá-lix, efeitos hidrodinâmicos.
REFERENCES
AHRENS ML. 1983. Electrostatic control by lipids upon the membrane-bound (Na+-K+)-ATPase. Bioch Biophis Acta 642: 1-10. BATEMAN JB AND ZELLMER A. 1956. The electrophoretic properties of red blood cells. The effect of changing pH and ionic
strength. Arch Biochem Biophys 60: 40-46.
BLANK M, SOO L AND ABBOTT RE. 1979. Erythrocyte membrane proteins: a modified Gorter-Grendel experiment. J Membr Biol 47:185-193.
BRUNER LJ. 1986. Pressure effects on ion movement across planar bilayer membranes. Physica B 139: 860-869.
CHEN XY, HUANG YX, LIU WJ AND YUAN ZY. 2007. Membrane surface charge and morphological and mechanical properties of young and old erythrocytes. Curr Applied Phys 7: 94-96.
COAKLEY WT AND DEELEY JOT. 1982. Effects of ionic strength serun protein and surface charge in heated erythrocyte. Biochim Biophys Acta 602: 355-365.
COOK GMW, HEARD DH AND SEAMAN GVF. 1961. Sialic acids and the electrokinetic charge of the human erythrocyte. Nature 191: 44-49.
CORTEZ CM AND BISCH PM. 1993. The Effect of Ionic Strenght and Outer Surface Charge on the Electric Potential Profile. Bisch Bioelectroch Bioenerg 32: 305-315.
CORTEZ CM AND BISCH PM. 1995. Effect of Ionic Strenght and Outer Surface Charge on the Mechanical Stability of Erythrocyte Membrane. J Theor Biol 176: 325-339.
CORTEZ CM AND BISCH PM. 1996. Inner Surface Charge and Membrane Mechanical Stability. Braz J Phys 26: 604-610. CORTEZ CM, CRUZ FAO, SILVA D AND COSTA LF. 2008. Influence of fixed electric charges on potential profile across the squid
CRUZ FAO, VILHENA FSDS AND CORTEZ CM. 2000. Solution of non-linear Poisson-Boltzmann equation for erythrocyte membrane. Braz J Phys 30: 403-410.
DONATH E AND LERCHE D. 1980. Electrostatic and structural properties of the surface of human erythrocytes. Bioelectrochem Bioenerg 7: 41-53.
DONG N, HUI-JI S, YA-JUN Y AND LI-SHA N. 2007. Dynamics of phase separation in mixed lipid membranes between two bounding walls. Physica B 388: 159-166.
ELGSAETER A, STOKKE BT, MIKKELSEN A AND BRANTON D. 1986. The molecular basis of erythrocyte shape. Science 234: 1217-1223.
EYLAR EH, MADOFF MA, BRODY OV AND ONCLEY JL. 1962. The contribution of sialic acid to the surface charge of the erythrocyte. J Biol Chem 237: 1992-2000.
GENET S, COSTALAT R AND BURGER J. 2001. The influence of plasma membrane electrostatic properties on the stability of cell ionic composition. Biophys J 81: 2442-2457.
GURTOVENKO AA AND VATTULAINEN I. 2007. Lipid Transmembrane Asymmetry and Intrinsic Membrane Potential: Two Sides of the Same Coin. J Am Chem Soc 129: 5358-5359.
GUYTON AC. 1984. Physiology of the Human Body. CBS College Publishing.
HALL JE AND LATORRE R. 1976. Nonactin-K+ complex as a probe for membrane asymmetry. Biophys J 15: 99-103.
HEINRICH R, GAESTEL ME AND GLASER M. 1982. The Electric Potential across the erythrocyte membrane: a mathematical model. J Theor Biol 96: 211-231.
HSU JP AND FAN YP. 1995. Electrophoretic Mobility of a Particle Coated with a Charged Membrane - Effects of Fixed Charge and Dielectric-Constant Distributions. J Colloid Interface Sci 172: 230-241.
HSU JP, HSU WC AND CHANG YL. 1993. Electrostatic interactions between two ion penetrable charged membranes. J Colloid Interface Sci 155: 1-7.
HSU JP AND KUO YCJ. 1994. Approximate analytical expressions for the properties of a double layer with asymmetric electrolytes ion penetrable charged membranes. Colloid Int Sci 166: 208-216.
HSU JP, LIN SH AND TSENG S. 1996. Electrophoretic mobility of biological cells in asymmetric electrolyte solutions. J Theor Biol 182: 137-145.
HUNTER MJ. 1977. Human erythrocyte anion permeabilities measured under conditions of net charge transfer. J Physiol 268: 35-49.
JAN KM AND CHIEN S. 1973. Role of surface electric charge in red blood cell interactions. J Gen Physiol 61: 638-654.
JITENDRA N, MEHRISHI JN AND BAUER J. 2002. Electrophoresis of cells and the biological relevance of surface charge. Electrophoresis 23: 1984-1994.
KABANOV DS, IVANOV AYU, MELZER M AND PROKHORENKO IR. 2008. Effects of surface proteins of human erythrocyte membrane on the interaction with lipopolysaccharides from Escherichia coli O55:B5. Biochemistry (Moskow) Supp. A: Memb Cell Biol 2: 128-132.
KATNIK C AND WAUGH R. 1990. Alterations of the apparent area expansivity modulus of red blood cell membrane by electric fields. Biophys J 57: 877-882.
KAWAHATA S, OHSHIMA H, MURAMATSU N AND KONDO TJ. 1990. Colloid Interface Sci 138: 182-186.
LEVINE S, LEVINE M, SHARP KA AND BROOKS DE. 1983. Theory of the electrokinetic behavior of human erythrocytes. Biophys J 42: 127-135.
LOPEZ L, DUCK IM AND HUNT WA. 1968. On the Shape of the Erythrocyte. Biophys J 8: 1228-1240.
MEHRISHI JN AND BAUER J. 2002. Electrophoresis of cells and the biological relevance of surface charge. Electrophoresis 23: 1984-1994.
MIRONOV SL AND DOLGAYA EV. 1985. Surface charge of mammalian neurons as revealed by electrophoresis. J Membrane Biol 86: 197-202.
NAGURA H, ASAI J, KATSUMATA Y AND KOJIMA K. 1973. Role of electric surface charge of cell membrane in phagocytosis. Pathology Int 23: 279-290.
NØRBY JG AND ESSMANN M. 1997. The effect of ionic strenght and specific anions on substrate binding and hydrolytic activities of Na,K-ATPase. J Gen Physiol 109: 555-570.
PINTO TM, WEDEMANN RS AND CORTEZ CM. 2014. Modelling the electric potential across neuronal membranes: the effects of fixed charges on spinal ganglion neurons and neuroblastoma cells. Plos One 9: e96194.
PÖCKEL-FERNANDES H, CESAR CL AND BARJAS-CASTRO ML. 2011. Rev Bras Hematol Hemoter 33: 297-301.
TATULIAN SA, TULUPOV AN AND POLISHCHUK EV. 1988. Effect of ion adsorption on the electrokinetic properties of erythrocytes. Gen Physiol Biophys 7: 613-632.
WUNDERLICH RW. 1982. The pH as well as the potential at the membrane/solution interface is shown to be much. J Colloid Interface Sci 88: 385-389.