__________________________________
1 Engo Agrícola e Ambiental, Professor, Doutor em Engenharia Agrícola, Universidade Federal do Piauí, Campus Bom Jesus,
2 Engo Agrônomo, Professor, Ph. D. em Engenharia de Água e Solo, Universidade Federal de Viçosa, [email protected]. 3 Biólogo, Professor, Doutor em Fisiologia Vegetal, Universidade Federal de Viçosa, Câmpus Florestal, [email protected] 4 Matemático, Professor, Ph. D. em Agrometeorologia, Universidade Federal de Viçosa, [email protected].
5 Engo Agrônomo, Professor, Doutor em Genética e Melhoramento, Universidade Federal de Viçosa, [email protected].
Recebido pelo Conselho Editorial em: 21-2-2011 Aprovado pelo Conselho Editorial em: 3-12-2011
CONCENTRATION IN MAIZE CROP
JOÃO B. LOPES DA SILVA1, PAULO A. FERREIRA2, EDUARDO G. PEREIRA3,
LUÍS C. COSTA4, GLAUCO V. MIRANDA5
ABSTRACT: Maize is a C4 plant that shows few or no response to high [CO2]. Thus, this study
aimed to analyze the photosynthetic rate and yield of maize under high [CO2] and develop open-top
chambers (OTC) to create an atmosphere enriched with CO2. The experiment was conducted
between October 2008 and March 2009. The OTCs were developed in modular scheme. Measurement of photosynthetic rates, transpiration, stomata conductance, grain yield and dry matter were performed. The experimental design was randomized blocks with four replications and three treatments: P1 - plants grown in OTC with 700 ppm [CO2], P2 - plants grown in OTC with
environmental [CO2], and P3 - control, cultivated in open field. The results were analyzed by
ANOVA and Tukey’s test (Pr< 0.05). The chambers can reduce by 25% the photosynthetically active radiation and increase the air and leaf temperatures. Plants under high [CO2] (P1) showed the
highest photosynthetic rates and the lowest stomata conductance and transpiration. The total weight of grains (g) and dry mass of shoots (g) showed no increases for P1, despite their higher photosynthetic rates.
KEYWORDS: open-top chambers, climate change, Zea mays L.
DESENVOLVIMENTO DE ESTRUTURA EXPERIMENTALE INFLUÊNCIAS DA ALTA
CONCENTRAÇÃO DE CO2 NA CULTURA DO MILHO
RESUMO:O milho é uma planta C4 que apresenta pouca, ou nenhuma, resposta às elevadas [CO2];
assim, neste trabalho, objetivou-se analisar respostas fisiológicas e produtivas da cultura do milho sob alta [CO2], e desenvolver câmaras de topo aberto (CTA) para criar uma atmosfera enriquecida
com CO2. O experimento foi conduzido entre outubro de 2008 e março de 2009. As CTAs foram
desenvolvidas em esquema modular. Foram realizadas medições da taxa fotossintética, transpiração, condutância estomática, produção de grãos e matéria seca. O delineamento experimental foi em blocos casualizados, com quatro repetições e três tratamentos: P1 - plantas cultivadas em CTA a [CO2] de 700ppm; P2 - plantas cultivadas em CTAcom [CO2] ambiente; e P3
-plantas cultivadas em campo aberto, testemunhas. Os resultados obtidos foram submetidos à análise de variância e teste de Tukey (Pr<0,05). As câmaras reduzem em 25% a Radiação Fotossinteticamente Ativa e aumentam a temperatura do ar e das folhas, em relação ao ambiente externo. As plantas sob alta [CO2] (P1) apresentaram as maiores taxas fotossintéticas e as menores
condutâncias estomáticas e transpiração. O peso total dos grãos (g) e a matéria seca da parte aérea (g) não apresentaram incrementos para P1, apesar das maiores taxas fotossintéticas.
INTRODUCTION
Since 1958, when systematic measurements of CO2 at Mauna Loa, Hawaii, began, CO2
concentrations increased more than 17% and it may reach 600 ppm by 2020 (TAIZ & ZEIGER, 2004). In general, [CO2] 200-400 ppm higher than normal produces stimuli in growth and
production of C3-type plants, but not in C4-type crops, because increase in the [CO2] have little
effect on photosynthetic rates of C4 plants, due to the mechanism that increases the [CO2]on the site
of action of Rubisco from these plants (ZISKA & BUNCE, 2006).
Maize (Zea mays L.) is a C4 plant that generally tends to present little or no additional growth
in response to elevated [CO2] (GHANNOUM et al., 2000). Here, LEAKEY et al. (2004) argue that
the effects of high [CO2] in plants are not sufficiently understood to allow for future predictions of
climate change. RUDORFF et al. (1996) did not observe increases in grain yield of [CO2] of
500 ppm in open-top chambers. Similar results were reported by Kim et al. (2007) working with high-[CO2] chambers. However, LEAKEY et al. (2004) observed that maize under high [CO2]
showed a maximum of 41% increase in CO2 assimilation, with an average of 10%, with the
maximum value occurring during periods with less rain. These increments are due to the high intracellular concentration of CO2 at low stomatal conductance and reduced transpiration. In
experiments with open-top chambers (SAMARAKOON & GIFFORD, 1996), maize plants under water stress and high [CO2] showed an increase of 50% growth compared to well-watered plants
under environmental [CO2]. PRINS et al. (2007) also obtained positive responses for corn growth at
high [CO2].
Because maize is a crop with high nutritional and economic values, more research is needed to quantify the impacts of climate change on this culture. Thus, this study aimed to analyze some of the physiological responses and quantify the yield of maize under CO2-enriched atmosphere, but
also to develop open-top chambers to enable the enrichment of the air with CO2.
MATERIALS AND METHODS
The experiment was carried out in drainage lysimeters at the campus of the Federal University of Viçosa (UFV), Viçosa-MG, between October 2008 and March 2009. To enrich the air with CO2,
open-top chambers were developed, based on COSTA (2003), LOBO (2003) and SOUZA (2007). The developed chambers consisted of rectangular modules to monitor plant growth, with side doors to facilitate data collection (Figure 1). A hood was also added to allow control of the water in the chamber environment. The chambers were made of steel structure and the sides were covered with a transparent plastic film.
The air injection system in the chambers was made of a centrifugal fan, in which the airflow was directed into the chamber by perforated PVC pipes for homogeneous air distribution. CO2 was
stored in cylinders at a rate regulated by primary pressure gauge coupled to a high-pressure solenoid valve. The solenoid valve also controlled plant day time exposure to CO2 between 6 am and 6 pm
with timers. Next to the chambers, the flow was again regulated with a fine adjustment valve. [CO2]
in the chambers was monitored and adjusted every other day with environment [CO2]-meter, model
Testo 535.
Lysimeters with 1.0 x 1.4 m section and 0.8 m depth were filled with Red-Yellow Dystrophic Latosol, of very clayey textural class (70% clay, 9% silt, 12% coarse sand, and 9% fine sand). Soil acidity correction was carried out in this substrate with lime (80%PRNT) at a dose of 3 t ha-1. Two fertilizations were also carried out during the experiment, being the first with 8-28-16 NPK at the time of planting and the second as top fertilization, 20-05-20NPK at the dose of 800 kg ha-1. The maize cultivar used was ‘AG9010’, with spacing of 0.20 m between plants and 0.50 m between rows, totaling 14 plants per lysimeter.
The plants were irrigated with dripping tapes to maintain the soil at field capacity (FC, 33.62%), with the soil water content monitored by a TDR (time domain reflectometry) with probes positioned at 0.20 and 0.40 m depth.
Environmental, physiological and phenological data were collected. Environmental data were gathered daily at every hour with an automatic portable weather station, Davis Vantage-Promodel. At the station, data were collected for photosynthetically active radiation (PAR) and temperature in the environment and inside the chambers. Also, it was used a pyranometer to measure the PAR radiation inside the chambers.
The physiological data collected were: photosynthetic rate (A), transpiration (E) and stomata conductance (Gs), collected at flowering (60 days after planting - DAP) and at the phase of grain formation (90 DAP). Measurements were performed between 8 am and 11 am on the 10th leaf of each plant, with a portable photosynthesis analyzer (IRGA - Infra Red Gas Analyzer), LCi model, with an external radiation source system, 1,200 µmol m-2 s-1 and environmental conditions inside and outside the chambers (temperature, [CO2] and relative humidity). The phenological data
collected were: plant height, leaf temperature, shoot dry weight, and yield. Leaf temperature was collected daily at 8 am, 11 am, 2 pm and 5 pm, using an infrared thermometer. For yield evaluation, the following variables were analyzed: total grain weight per plot, weight of thousand grains, and number of grains per spike.
The experimental design used was randomized complete block design (RBD) with four replications. The treatments were: P1 - plants grown in open-top chambers with [CO2] to 700 ppm;
P2 - plants grown in open-top chambers with environmental [CO2], and P3 - plants grown in open
air, control.
The variables were analyzed using simple descriptive statistics (mean, standard deviation and coefficient of variation) for further analysis of variance (ANOVA). For comparison among the
treatments, the Tukey’s test at 5% probability (Pr<0.05) was applied.
RESULTS AND DISCUSSION
Microclimate changes in the developed open-top chambers
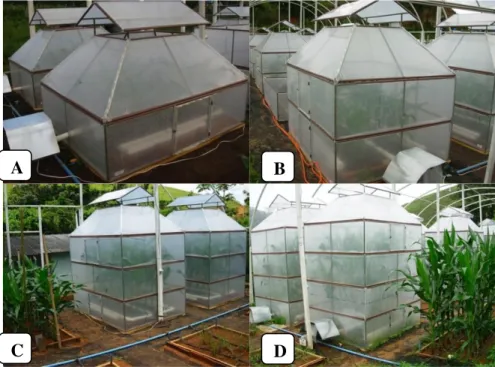
The addition of modules into the open top chamber developed (Figure 2) optimized CO2
consumption, reducing the experimental cost to obtain an atmosphere with high [CO2], for
increasing the CO2 flow, through the injection system and environmental airflow control (Figure 3)
which was increased with the addition of modules.
chambers (P3). The maximum and average temperatures of external and internal environments of the chambers showed significant differences between treatments (Tables 1 and 2). Higher temperatures were expected in P1, given that higher [CO2] in the environment causes major
microclimate changes, but in fact P2 showed higher values (Table 2).
This demonstrates that in the chamber, the key factor to increase temperature is water vapor, which is originated from the high humidity in the chamber due to the higher P2 plant transpiration (Table 2). Despite the small differences in values of average temperatures between P1 and P2, 0.42°C, the same did not occur for the maximum values, 1.04°C. These results indicate that the cameras altered the microclimate, increasing the average daily temperature in more than 2°C, and the maximum temperature in over 7°C in comparison to the environment. These results corroborate with the observations by AINSWORTH & LONG (2005) and LONG et al. (2005).
FIGURE 2. Open-top chambers with the addition of modules to follow the crop growth: A - 1 module, B - 2 modules, C - 3 modules, and D - 4 modules.
FIGURE 3. CO2 injection system and flow control to the chambers: A – Fan and pipes to distribute
the air in the chambers; B – Manometer, solenoid valve and CO2 cylinders.
A B
C D
TABLE 1. Descriptive statistics and analysis of variance of the variables.
Variables Mean Square Mean St. Deviation C.V. (%)
PAR (MW m-2day-1) 35.71 * 12.21 2.23 18.26
Mean Environmental Temperature (o C) 163.29 * 23.59 1.66 7.06
Maximum Environmental Temperature (o C) 1876.94 * 33.15 4.06 12.25
Minimum Environmental Temperature (o C) 0.12 * 18.39 1.42 7.73
1st measurement of A (µmol m-2 s-1) 91.16 * 45.16 4.60 10.18
2nd measurement of A (µmol m-2 s-1) 135.03 * 37.79 2.72 7.21
1st measurement of E (mmol m-2 s-1) 2.06 NS 4.28 1.22 28.62
2nd measurement of E (mmol m-2 s-1) 2.35 * 4.59 0.42 9.23
1st measurement of Gs (µmol m-2 s-1) 3.41 10-4 * 3.24 10-2 5.34 10-3 16.49 2nd measurement of Gs (µmol m-2 s-1) 1.52 10-4 * 2.76 10-2 3.72 10-3 13.46
Maximum plant height (cm) 2039.68 * 219.61 10.90 4.97
Mean leaf temperature (o C) 7.58 * 26.13 0.14 0.55
Maximum leaf temperature(o C) 12.29 * 29.54 0.17 0.58
Minimum leaf temperature(o C) 4.66 * 22.42 0.10 0.45
Total dry weight of aerial system (g) 60976.86 * 1867.50 92.48 4.95
Total grain weight (g) 8089.19 NS 716.47 52.19 7.28
Weight of 1.000 grains (g) 337.03 NS 303.99 19.80 6.51
Number of grains per spike (grains) 3774.08 NS 370.67 41.63 11.23
QM - mean square, NS - not significant Pr <0.05 and * significant at Pr <0.05; C.V. - coefficient of variation; PAR - Photosynthetic Active Radiation, A - photosynthetic rate; E - sweating, and Gs - stomatal conductance.
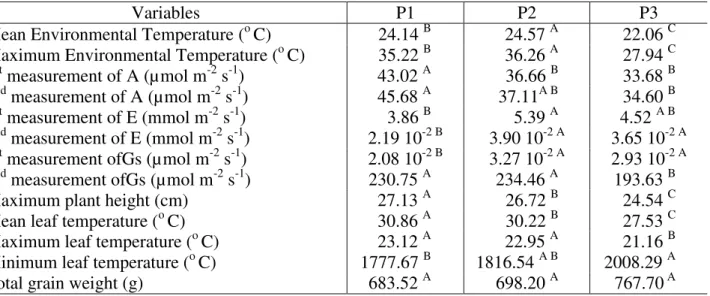
TABLE 2. Means of the variables collected for each treatment compared by Tukey test (Pr< 0.05)*
Variables P1 P2 P3
Mean Environmental Temperature (o C) 24.14 B 24.57 A 22.06 C
Maximum Environmental Temperature (o C) 35.22 B 36.26 A 27.94 C
1st measurement of A (µmol m-2 s-1) 43.02 A 36.66 B 33.68 B
2nd measurement of A (µmol m-2 s-1) 45.68 A 37.11A B 34.60 B
1st measurement of E (mmol m-2 s-1) 3.86 B 5.39 A 4.52 A B
2nd measurement of E (mmol m-2 s-1) 2.19 10-2 B 3.90 10-2 A 3.65 10-2 A 1st measurement ofGs (µmol m-2 s-1) 2.08 10-2 B 3.27 10-2 A 2.93 10-2 A
2nd measurement ofGs (µmol m-2 s-1) 230.75 A 234.46 A 193.63 B
Maximum plant height (cm) 27.13 A 26.72 B 24.54 C
Mean leaf temperature (o C) 30.86 A 30.22 B 27.53 C
Maximum leaf temperature (o C) 23.12 A 22.95 A 21.16 B
Minimum leaf temperature (o C) 1777.67 B 1816.54 A B 2008.29 A
Total grain weight (g) 683.52 A 698.20 A 767.70 A
* Means in the same row followed by same letter are equal. A - photosynthetic rate; E - transpiration; Gs - stomatal conductance; P1 - chambers with [CO2] to 700 ppm; P2 - chambers with environmental [CO2], and P3 - control.
Physiology, growth and yield in the maize crop
There were significant differences between treatments in both measurements of photosynthetic rate (A) and stomatal conductance (Gs) (Table 1). Although the net photosynthesis (A) did not present statistical difference in the second measurement between P1 and P2 (Table 2),plants subjected to P1 treatment showed higher photosynthetic rates in the two measurements, 27.03 and 32.02% respectively higher than P3, thus responding positively to the increase of [CO2].
This result indicates that C4-type plants may respond to increased [CO2] in the environment, unlike
the findings by TAIZ & ZEIGER (2004) and ZISKA & BUNCE (2006), who reported that C4
plants do not benefit from increased [CO2] in the atmosphere. Nevertheless, PRITHCARD &
AMTHOR (2005) mentioned that the C4 plants benefit from increases of [CO2], although not
and transpiration (Table 2). Moreover, WAND et al. (1995), LEAKEY et al. (2004) and SOUZA (2007) found similar increases in photosynthetic rates of C4 plants. Conversely, KIM et al. (2007)
found no stimulation in photosynthetic maize plants grown at high [CO2].
Transpiration (E) showed significant differences only in the second measurement (Table 1). Possibly, the first measurement showed no significant differences due to the high coefficient of variation (CV), 28.62%, as the differences between P1 and P2 were similar between the two measurements, 1.5 mmolm-2 s-1. The reduction of perspiration (E) in plants under high [CO2], was
due to reduction of stomatal conductance (Gs), which also caused these plants (P1) to present higher leaf temperatures (Table 2), as it reduced heat exchange with the environment, increasing the leaf temperature, a fact that corroborates observations reported by DAVIES (2006), KÖNER (2006) and LARCHER (2006). Increase in leaf temperature should be beneficial because it increases the photosynthetic rate. However, this benefit was not observed, since P2 and P3 showed no significant differences (Table 2), although leaf temperatures in P2 were higher than that of P3, and P2 photosynthetic rates are 8.85% and 7.25% higher in relation to P3 in the first and second measurement, respectively.
The increases in leaf and ambient temperatures (Table 2) were not sufficient to reduce the crop cycle, although high temperatures are commonly reported to reduce it (KÖNER, 2006, MENZEL & SPARKS, 2006). This cycle reduction due to increased temperature was observed by RENATO (2009), using simulation models of crop growth of sugarcane; nonetheless this increase greatly reduced the cycle of the crop. Thus, the results of this study are important for modeling and simulation, as they help in the calibration and simulation of models, since most of them have leaf temperature as input, as the model proposed by FARQUAR et al. (1980).
Maximum plant heights were higher for plants grown inside P1 and P2 chambers (Table 2). However, this greater height was not due to increased leaf and chamber temperatures (Table 2), or even [CO2], but for PAR reduction (Table 1), which caused plant etiolation. Due to shading, P1 and
P2 plants approached to VT phase (tasseling) faster, thus shortening the vegetative stage (stage V0 to V15). However, this reduction of the vegetative stage length did not reduce the plant cycle because the plants arrived together at the reproductive stage (R1); nor it reduced the leaf number, as all plants developed 15 leaves.
Only the total dry matter of shoots showed significant differences among treatments (Table 1). The total weight of grains (g), the thousand grain weight (g) and the number of grains per spike showed no significant differences, even with the highest photosynthetic rates of P1 (Table 2), thus showing that increase of [CO2] does not increase the weight of individual grains, but also it does not
provide increased reproduction in experimental conditions similar to this work. This fact is in disagreement with the affirmations by JABLONSKI et al. (2002) and ZISKA & BUNCE (2006), who argued that increases in [CO2] affect reproduction, which in turn increases the number of
flowers and pollen production, therefore leading to increase in the number of grains.
It was expected larger amount of dry matter and yield (total weight of the grains) in plants subjected to P1, in view of the highest photosynthetic rate in P1 (Table 2). The hypothesis for the failure to increase the dry matter and total grain weight is the average PAR reduction in the chambers, 25.41% (Table 1), because the photosynthetic rate measurements were performed with irradiance close to the saturation point (1,200 µmol m-2 s-1), thus evaluating the maximum photosynthetic capacity of the leaf. As well, measurements of photosynthesis were made on a single leaf per plant and grain yield is more related to carbon gain of the whole plant. This is in agreement with ZISKA & BUNCE (2006), who stated that only one leaf is not a good indicator for the response of photosynthesis and growth of the whole plant.
positive results for maize production at high [CO2], along with OLIVEIRA (2007) and COSTA et
al. (2009) who worked with crop growth models.
CONCLUSIONS
The open-top chambers developed in this work change the internal microclimate, with additions of more than 2°C in the average daily temperature, but also reduce the average PAR (Photosynthetic Active Radiation) in 25.41%, causing etiolation. The addition of modules in the open-top chamber optimizes CO2 consumption, reducing the experimental cost to obtain an
atmosphere with high [CO2].
The photosynthetic rate of maize (C4) shows stimulation at high [CO2] in the environment.
However, the increase in leaf temperature, of more than 2°C on average, does not provide increased photosynthetic rate. Nonetheless, it is not sufficient to change the plant cycle length. Despite the higher rate of plant photosynthesis in environments with high [CO2], grain production did not
increase, as well as there was not an increase in dry matter of the aerial system.
ACKNOWLEDGMENTS
The authors thank FAPEMIG for research funding, and Capes and CNPq for awarding research grants.
REFERENCES
AINSWORTH, E.A.; LONG, S.P. What have we learned from 15 years of free air-CO2 enrichment
(FACE)? A meta-analytic review of the responses of photosynthesis, canopy properties and plant production to rising CO2. New Phytologist, Cambridge, v.165, p.351-372, 2005. Disponível em:
<http://www.sciencedirect.com>. Acesso em: 24 ago. 2007.
COSTA, A.C. Respostas fisiológicas de duas linhagens de soja à atmosfera enriquecida com CO2 e à restrição hídrica. 2003. 36 f. Dissertação (Mestrado em Fisiologia Vegetal) - Universidade
Federal de Viçosa, Viçosa, 2003.
COSTA, L.C.; JUSTINO, F.; OLIVEIRA, L.J.C.; SEDIYAMA, G.C.; FERREIRA, W.P.M.; LEMOS, C.F. Potential forcing of CO2, technology and climate changes in maize (Zea mays) and
bean (Phaseolus vulgaris) yield in southeast Brazil. Environmental Research Letters, San Diego, v.4, p.1-10, 2009.
DAVIES, W.J. Responses of plant growth and functioning to changes in water supply in a changing climate. In: MORISON, J.;MORECROFT, M. Plant growth and climate change. Chichester: Blackwell Publishing, 2006, 213 p.
FARQUAR, G.D.; CAEMMERES, S. Von; BERRY, J.A. A biochemical model of photosynthetic CO2 assimilation in leaves of C3 species. Planta, Berlin, n.149, p.78-90, 1980.
GHANNOUM, O.; CAEMMERER, S. Von; ZISKA, L.H.; CONROY, J.P. The growth response of C4 plants to rising atmospheric CO2 partial pressure: a reassessment. Plant, Cell and Environment,
Oxford, v.23, p.931-942, 2000. Disponível em: <http://www.sciencedirect.com>. Acesso em: 24 ago. 2007.
JABLONSKI, L.M.; WANG, X.; CURTIS, P.S. Plant reproduction under elevated CO2 conditions:
a meta-analysis of reports on 79 crops and wild species. New Phytologist, Cambridge, v.156, p.9-26, 2002. Disponível em: <http://www.sciencedirect.com>. Acesso em: 27 out. 2007.
KIM, S.H.; GITZ, D.C.; SICHER, R.C.; BAKER, J.T.; TIMLIN, D.J.; REDDY, V.R. Temperature dependence of growth, development, and photosynthesis in maize under elevated CO2.
KÖNER, C. Significance of temperature in plant life. In: MORISON, J.; MORECROFT, M. Plant growth and climate change. Oxford: Blackwell Publishing, 2006. 213 p.
LARCHER, W. Ecofisiologia vegetal. Tradução: Carlos Henrique Britto de Assis Prado. São Carlos: RiMa, 2006. 531 p.
LEAKEY, A.D.B.; BERNACCHI, C.J.; DOHLEMAN, F.G.; ORT, D.R.; LONG, S.P. Will
photosynthesis of maize (Zea mays) in the US Corn Belt increase in future [CO2] rich atmospheres?
An analyses of diurnal courses of CO2 uptake under free-air concentration enrichment (FACE).
Global Change Biology, Oxford, v.10, p.951-962, 2004. Disponível em: <http://www.sciencedirect.com>. Acesso em: 26 ago. 2007.
LOBO, F.A. Alterações na assimilação e metabolismo do carbono em plantas de soja sob condições de atmosfera enriquecida com CO2. 2003. 105 f. Tese (Doutorado em Fisiologia Vegetal), Universidade Federal de Viçosa, Viçosa, 2003.
LONG, S.P.; AINSWORTH, E.A.; LEAKEY, A.D.B.; MORGAN, P.B. Global food insecurity. Treatment of major food crops with elevated carbon dioxide or ozone under large-scale fully open-air conditions suggests recent models may have overestimated future yields. Philosophical
Transactions of The Royal Society B: Biological Sciences, London, n.360, p.2011-2020, 2005. Disponível em: <http://apps.isiknowledge.com>. Acesso em: 29 fev. 2007.
MENZEL, A.; SPARKS, T. Temperature and plant development: phenology and seasonality. In: MORISON, J.; MORECROFT, M. Plant growth and climate change. London: Blackwell
Publishing, 2006. 213 p.
OLIVEIRA, L.J.C. Mudanças climáticas e seus impactos nas produtividades das culturas do feijão e do milho no estado de Minas Gerais. 2007. 67 f. Dissertação (Mestrado em Meteorologia
Agrícola), Universidade Federal de Viçosa, Viçosa, 2007.
PRINS, A.; VERRIER, P.; KUNERT, K.J.; FOYER, C.H. Acclimation of the maize transcriptome to CO2 enrichment. South African Journal of Botany, Pretoria, v.73, n.2, p.307-308, 2007.
Disponível em: <http://www.sciencedirect.com>. Acesso em: 29 out. 2007.
PRITCHARD, S.G.; AMTHOR, J.S. Crops and environmental change: an introduction to effects of global warming, increasing atmospheric CO2 and O3 concentrations, and soil salinization on crop physiology and yield. New York: Food Products Press, 2005. 421 p.
RENATO, N.S. Fotossíntese em cenários de mudanças climáticas: adaptação de modelo para a produtividade potencial da cana de açúcar. 2009. 53 f. Dissertação (Mestrado em Meteorologia Agrícola) - Universidade Federal de Viçosa, Viçosa, 2009.
RUDORFF, B.F.T.; MULCHI, C.L.; LEE, E.H.; ROWLAND, R.; PAUSCH, R. Effects of enhanced O3 and CO2 enrichment on plant characteristics in wheat and corn. Environmentul
Pollution, Barking, v.94, n.1, p.53-60, 1996. Disponível em: <http://www.sciencedirect.com>. Acesso em: 29 out. 2007.
SAMARAKOON, A.B.; GIFFORD, R.M. Elevated CO2 effects on water use and growth of maize
in wet and drying soil. Australian Journal of Plant Physiology, Melbourne, v.23, p.53-62, 1996. Disponível em: <http://www.isiknowledge.com>. Acesso em: 20 jun. 2010.
SOUZA, A.P. A cana-de-açúcar e as mudanças climáticas: efeitos de uma atmosfera enriquecida em CO2 sobre o crescimento, desenvolvimento e metabolismo de carboidratos de Saccharum ssp.
2007. 91 f. Dissertação (Mestrado em Biologia Celular) - Universidade Estadual de Campinas, Campinas, 2007.
WAND, S.J.E.; MIDGLEY, G.F.; JONES, M.H.; CURTIS, P.S. Responses of wild C4 and C3 grass
(Poaceae) species to elevated atmospheric CO2 concentration: a meta analytic test of current
theories and perceptions. Global Change Biology, Oxford, v.5, p.723-741, 1995.