Efficiency of hospital cholera
treatment in Ecuador
Germán Creamer,
1Ninfa León,
2Mark Kenber,
2Pablo Samaniego,
2and Gregory Buchholz
3This study analyzed the efficiency of cholera treatment in three hospitals representative of the Ecuadorian public health system in order to provide hospital directors and administrators and health service policy-makers with information to plan responses to future epidemics and to re-duce the costs of cholera treatment in general. For the study, total and excess cholera treatment costs were calculated using hospital files and statistics and an in-hospital surveillance system of the cholera cases. The type and quantity of each input used for each treatment were analyzed, as well as the number of days hospitalized, according to the severity of the illness. With this process, excess costs were determined in relation to a “treatment norm” that would have been appropriate for each patient.
The researchers found that 45% of the cholera treatment costs were excessive. The most im-portant contributor was excess recurrent costs (90%), including extended hospital stays, dis-proportionate use of intravenous rehydration solutions, and unnecessary laboratory tests. Ex-cess capital costs, from land, buildings, and hospital equipment, represented 10% of the total excess treatment costs. No significant relationship was found between treatment costs and the severity of the illness, nor between costs and a patient’s age. A patient’s sex appeared to be an important variable, with the cost of treating women being notably higher than for men. An in-verse relationship was found between treatment costs and the complexity of the hospital. The researchers concluded there was an inefficient use of resources in the treatment of cholera in the three hospitals where the research was performed.
ABSTRACT
The Latin American cholera epi-demic spread rapidly after reaching Ecuador in 1991. That year the number of cases in the country totaled 46 284, with another 31 870 registered in 1992. While the number declined to 6 833 in 1993, there have been subsequent out-breaks, especially in the first half of
1995 (1–3). Cholera treatment in Ecua-dor has been principally carried out in hospitals. In 1991, 81% of registered cholera patients were hospitalized, with the figures for 1992, 1993, and the first 6 months of 1994 being 89%, 80%, and 69%, respectively (1). Neverthe-less, experience in other countries has shown that a significant proportion of cholera cases can be successfully treated as outpatients or in community rehydration centers (4).
In Ecuador there have been very few cost studies of the health sector. One worth mentioning is that of Robertson et al., in which the costs of several im-portant services in the system man-aged by the Ministry of Public Health
(MPH) were found to be consider-ably lower than costs in the rural So-cial Security program (5). Using cost-effectiveness analysis, Shepard et al. compared the national mass vaccina-tion programs with the ordinary vacci-nation services offered by the public health system (6). An exploratory study of cholera during the height of the epidemic in Ecuador calculated the total treatment costs in two Sierra (highlands region) hospitals (2 459 cases in Ibarra and Otavalo) as ap-proximately US$ 65 000 (7). These fig-ures suggest that, taking the nation as a whole, cholera treatment during the epidemic would have constituted a significant item in the MPH budget.
1 Tulane University, A.B. Freeman School of
Busi-ness, New Orleans, Louisiana, USA. Mailing ad-dress: A.B. Freeman School of Business, Tulane University, MR 5027, 31 McAlester Dr., New Or-leans, LA 70118 USA. Phone: (504) 865-5856. Fax: (504) 865-6751. E-mail: gcreame@mailhost.tcs. tulane.edu
2 Facultad Latinoamericana de Ciencias Sociales,
Quito, Ecuador.
3 Universidad San Francisco de Quito, Quito,
This conclusion is particularly worry-ing if one takes into account the fact that public health expenditure has fallen in recent years, not only as a per-centage of the national budget, but also in absolute terms. The reduction was on the order of 54% between 1992 and 1994 (8, 9).
The little research done on cholera treatment in Ecuador reveals that intra-venous (IV) rehydration is used far more widely than oral rehydration therapy (ORT) and that hospital stays are often unnecessarily long (7, 10, 11), both of which raise treatment costs. Similar results have been found in other Latin American countries (12, 13). Nevertheless, studies in several devel-oping countries, including Lesotho (14) and India (15, 16), have found that ORT is both highly effective and can significantly reduce treatment costs. The principal objective of this study was to calculate the level of total and excess cholera treatment costs in se-lected Ecuadorian MPH hospitals.
MATERIALS AND METHODS
The excess cholera treatment costs were identified, and their component elements were investigated. Such costs were calculated by subtracting from the total cost the “ideal” treatment cost—based on a preestablished treat-ment norm determined for each case according to the degree of dehydra-tion. Given that it was possible that conditions specific to each hospital could lead to higher costs, regardless of whether the norm was strictly ap-plied, the project also sought to ana-lyze the underlying cost structure in each hospital and its effect on the cost of cholera treatment.
During the period of field research, the project team sought to answer the following questions:
1. Are cholera treatment costs in MPH hospitals significantly excessive when compared to an ideal treat-ment based on a diagnosis of the de-gree of dehydration of each patient? 2. If treatment costs are found to be excessive, is overuse of IV
rehydra-tion therapy a significant determi-nant of these excess costs?
3. Do treatment costs vary propor-tionately with the severity of each case?
4. Does the variation in treatment costs bear any relationship to the complexity of the hospital (i.e., na-tional, provincial, or primary level) where a patient is admitted? 5. Do a patient’s sex and/or age affect
cholera treatment costs?
Considering the fact that all the pa-tients in the study left the hospital fully cured, it can be assumed that oral and IV rehydration therapy are equally effective. Since treatment ef-fectiveness in all cases is the same, this renders a cost-effectiveness analysis redundant and the analysis effectively becomes one of cost-minimization. The research presented here centered on the analysis of the capital and re-current costs incurred in oral treat-ment and in IV treattreat-ment and took into account the severity of the cases (mild, moderate, or severe), the com-plexity of the hospitals, and the age and sex of the patients.
The study population was made up of patients who were admitted to a hospital with a cholera diagnosis. Cri-teria for exclusion included the pres-ence of blood in feces, fever, and any other associated acute or chronic ill-ness. Patients below the age of 5 were also excluded because they were thought to run a higher risk of compli-cations. The population was grouped by age in the following way: 5–19 years, 20–39 years, 40–59 years, and 60 years and older.
The choice of the hospitals to be included in the study was based on three criteria:
• location in a zone of high cholera in-cidence during the research period • previous admission of large
num-bers of cholera patients • differing levels of complexity
Looking at different levels of hospi-tal complexity enabled the results of the study to be extrapolated tenta-tively to other, similar hospitals in the
public health system. The following hospitals were selected: the “Dr. José Daniel Rodríguez Maridueña” Infec-tious Diseases Hospital in Guayaquil, a specialized national reference hos-pital with 107 beds; the Chimborazo Polyclinic Hospital in Riobamba, a provincial-level hospital with 173 beds which from the onset of the epidemic received a large number of the cases in the central Sierra; and the “León Be-cerra” Hospital in Milagro, a primary-level canton (municipality) hospital with 74 beds which, at the beginning of the study, had received the greatest number of cases nationally for a hospi-tal of its complexity (17).
For the purpose of the analysis, costs were divided into recurrent and capi-tal costs (see Annex 1). Recurrent costs included:
• the costs of medicines (including antibiotics and other medication) and rehydration salts (oral and pa-renteral), the equipment used for their administration, and laboratory tests
• personnel and administration costs: wages, salaries, and benefits; food, cleaning, electricity, fuel, and water; and other administrative costs.
Capital costs were determined on the basis of the present value of hospi-tal buildings, land, and medical and other equipment.
It is worth noting that the research concentrated on the factors that af-fected the efficiency of in-hospital cholera treatment from the point of view of the providers of the service, in this case the MPH and the hospitals. For this reason, other costs caused by the disease, such as reduced produc-tivity and lost wages and other effects on patients’ families, or other savings generated by treating patients out of hospital, while undoubtedly impor-tant, were not taken into account.
on criteria established by Barua and Greenough III (4) and the guidelines laid down by the World Health Orga-nization and Pan American Health Organization (18).
Evaluation of the initial rehydration requirement was based on an assess-ment the research team made of each patient’s degree of dehydration at the time of admission. The maintenance rehydration requirement was not esti-mated, given the difficulty in ensuring an accurate monitoring of the inges-tion and eliminainges-tion of liquids. For this reason, the total volume of liquids administered to each patient was as-sumed to be correct and only the need for ORT or IV treatment was assessed. The appropriate length of hospital stay was also calculated on the basis of the treatment norm, estimating the values of necessary variables from a patient’s clinical history.
Over the three months of April–June 1994 an in-hospital surveillance sys-tem of the cholera cases in the selected hospitals provided information on the type and quantity of each input used for each treatment, as well as the num-ber of days hospitalized, according to the severity of dehydration. Nurses hired by the project and trained by the research team collected this informa-tion. An instruction manual was also prepared and distributed to the nurses. Prior to the data collection itself, the survey and its application by the nurses were subjected to a “dry run” and any problems that arose were cor-rected. With this procedure, it was possible to determine the excess costs in relation to the treatment norm for each patient in terms of inputs and hospital stay (see Annex 2).
The average cost of each of the med-icines and rehydration inputs was as-sessed in three pharmacies and labo-ratories in the area, including those within the hospitals themselves, and this average was then multiplied by the quantity used. The information on the recurrent costs in the personnel and ad-ministrative category was obtained from MPH and hospital files and inter-views with key staff in each institution. The capital cost imputable to land and buildings was based on data from
municipal property registry and valu-ation departments, while the cost of hospital equipment was calculated from information in hospital invento-ries, balance sheets, and purchase re-ceipts. (Given that municipal property valuations may differ from market val-uations, the calculation of capital costs may not be as accurate as the calcula-tion of recurrent costs.) Calculacalcula-tions were made on the basis of the percent-age of the hospital area occupied by cholera patients. The percentage of general services (administration, food, cleaning services, electricity, water, and fuel) attributable to these areas was calculated according to the ratio of cholera-patient-days to the total number of patient-days for the hospi-tal during the study period. This pro-portion, multiplied by the total cost for each item and then divided by the number of cholera-patient-days, gave the personnel, administration, and capital costs per cholera-patient-day. The results are presented in the tables in terms of excess costs and the ratio of excess to total observed costs for each cost category.
On the basis of these values, multi-ple regression analyses using dummy variables were run in order to identify correlations between the independent variables (severity of the illness, sex, age, and hospital type) and the results of the fieldwork (excess total, capital, and recurrent costs, and excess use of oral and IV rehydration salts). The re-sults of the regressions showed that there was no significant relationship between excess treatment costs and patient age or severity of illness. The relationship between hospital type and patient sex was not included be-cause its regression coefficients were not statistically significant.
Further details on the calculation of observed recurrent and capital costs and estimated appropriate levels of expenditure for cholera treatment are available on request.
RESULTS
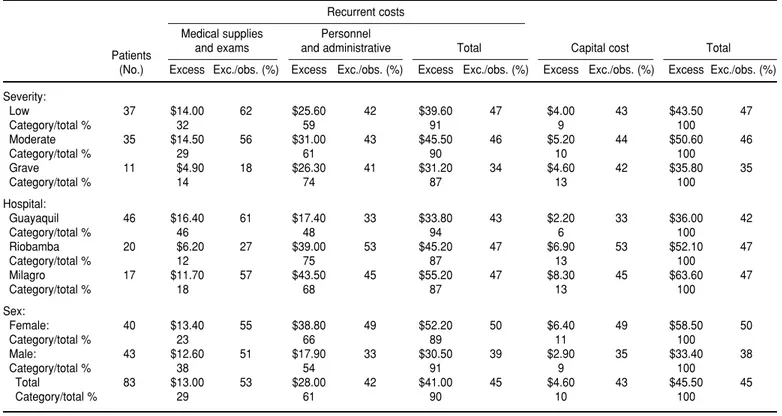
On average, 45% of the observed cholera treatment costs in the three
hospitals studied can be considered ex-cessive (see Table 1). At the rate of 2 200 Ecuadorian sucres per United States dollar (US$), the average treat-ment cost was US$ 101.62 per patient and the excess costs were $45.50. The most important contributor to these excess costs (61%) was personnel and administration costs, which corrobo-rates the results found in other coun-tries in studies of immunization pro-grams and the treatment of diarrheal diseases (19–21). However, the indi-vidual cost category with the highest ratio of excess to total costs was labo-ratory tests and medical supplies (53%). Within this category, 63% of the total spent on IV rehydration salts was excessive. This suggests that IV rehy-dration therapy requires greater use of equipment and other supplies than oral therapy (see Tables 1 and 2). Cor-respondingly, the observed expendi-ture for oral rehydration salts was lower than would have been the case if the treatment norm had been followed.
With respect to the severity of the cases being treated, in the three cate-gories (mild, moderate, and severe), excessive use of IV rehydration salts accounts for between 60% and 69% of the excess expenditure on lab tests and medical supplies (Table 2). Of the total excess costs for each of the three sever-ity groupings, recurrent expenditures take up between 87% and 91% and capital costs account for between 9% and 13% (Table 1). No significant dif-ferences were found between total treatment costs for cases of differing severity. It is worth pointing out that, in absolute terms, the group with the highest excess costs were the moderate cases ($50.60), followed by the mild ($43.50), and last, the severe patients ($35.80).
TABLE 1. Excess and observed recurrent and capital average costs per patient for cholera treatment by severity, hospital, and sex (dollars and percentages), Ecuador, 1994
Recurrent costs Medical supplies Personnel
Patients and exams and administrative Total Capital cost Total (No.) Excess Exc./obs. (%) Excess Exc./obs. (%) Excess Exc./obs. (%) Excess Exc./obs. (%) Excess Exc./obs. (%)
Severity:
Low 37 $14.00 62 $25.60 42 $39.60 47 $4.00 43 $43.50 47
Category/total % 32 59 91 9 100
Moderate 35 $14.50 56 $31.00 43 $45.50 46 $5.20 44 $50.60 46
Category/total % 29 61 90 10 100
Grave 11 $4.90 18 $26.30 41 $31.20 34 $4.60 42 $35.80 35
Category/total % 14 74 87 13 100
Hospital:
Guayaquil 46 $16.40 61 $17.40 33 $33.80 43 $2.20 33 $36.00 42
Category/total % 46 48 94 6 100
Riobamba 20 $6.20 27 $39.00 53 $45.20 47 $6.90 53 $52.10 47
Category/total % 12 75 87 13 100
Milagro 17 $11.70 57 $43.50 45 $55.20 47 $8.30 45 $63.60 47
Category/total % 18 68 87 13 100
Sex:
Female: 40 $13.40 55 $38.80 49 $52.20 50 $6.40 49 $58.50 50
Category/total % 23 66 89 11 100
Male: 43 $12.60 51 $17.90 33 $30.50 39 $2.90 35 $33.40 38
Category/total % 38 54 91 9 100
Total 83 $13.00 53 $28.00 42 $41.00 45 $4.60 43 $45.50 45
Category/total % 29 61 90 10 100
TABLE 2. Excess and observed oral and intravenous rehydration solutions and other medical supplies, average costs by severity, hospi-tal, and sex (dollars and percentages), Ecuador, 1994
Intravenous Other
Oral rehydration salts rehydration solutions medical supplies Total Patients (No.) Excess Exc./obs. (%) Excess Exc./obs. (%) Excess Exc./obs. (%) Excess Exc./obs. (%)
Severity:
Low 37 ⫺$0.60 ⫺119 $8.40 81 $6.20 53 $14.00 62
Category/total % ⫺4 60 44 100
Moderate 35 ⫺$0.80 ⫺93 $9.50 70 $5.80 51 $14.50 56
Category/total % ⫺5 65 40 100
Grave 11 ⫺$0.10 ⫺7 $3.40 22 $1.60 15 $4.90 18
Category/total % ⫺2 69 32 100
Hospital:
Guayaquil 46 ⫺$0.80 ⫺667 $10.40 72 $6.80 56 $16.40 61
Category/total % ⫺5 64 41 100
Riobamba 20 ⫺$0.00 2 $4.80 40 $1.30 14 $6.20 27
Category/total % 0 78 22 100
Milagro 17 ⫺$0.80 ⫺47 $6.10 86 $6.40 54 $11.70 57
Category/total % ⫺7 52 55 100
Sex:
Female: 40 ⫺$0.50 ⫺62 $8.30 72 $5.60 46 $13.40 55
Category/total % ⫺4 62 42 100
Male: 43 ⫺$0.70 ⫺108 $8.10 62 $5.20 48 $12.60 51
Category/total % ⫺5 64 41 100
Total 83 ⫺$0.60 ⫺83 $8.20 66 $5.40 47 $13.00 53
in the more complex hospitals, due to the higher proportion of specialized staff in these institutions. No clear pat-tern emerged with IV rehydration salts; the percentage of excess costs in the total spent on them was 86% in Mi-lagro, 72% in Guayaquil, and 40% in Riobamba (Table 2).
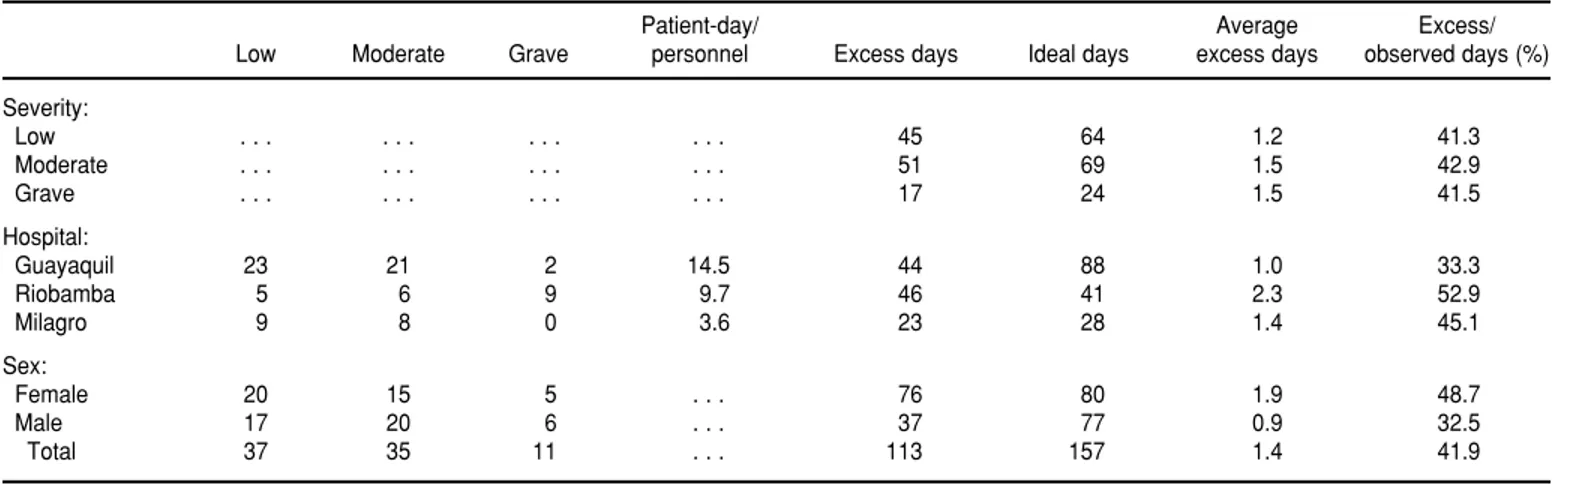
The differences in costs related to a patient’s sex were evident in the aver-age treatment cost, which was $117.40 for women (50% excessive) and $86.90 for men (38% excessive). There was lit-tle difference between the two groups in terms of expenditures on laboratory tests and medical supplies. However, for capital costs and for personnel and administration costs, the excess-to-total cost ratios were 49% in both cate-gories for women patients and 35% and 33%, respectively, for men (Table 1). These variations were largely a re-sult of the longer time spent in the hos-pital by women patients, whose aver-age stay was more than double that of men, although there was no significant difference between the groups in terms of the distribution of cases by severity (Table 3).
The age groupings showed a “U” curve in total average excess costs. The group 5–19 years old had average total excess costs of $59.00. The figure was $40.00 for those 20–39, $45.00 for the group between 40 and 59 years old, and $53.00 for the group 60 and older.
The variance analysis was done using computer software from SPSS
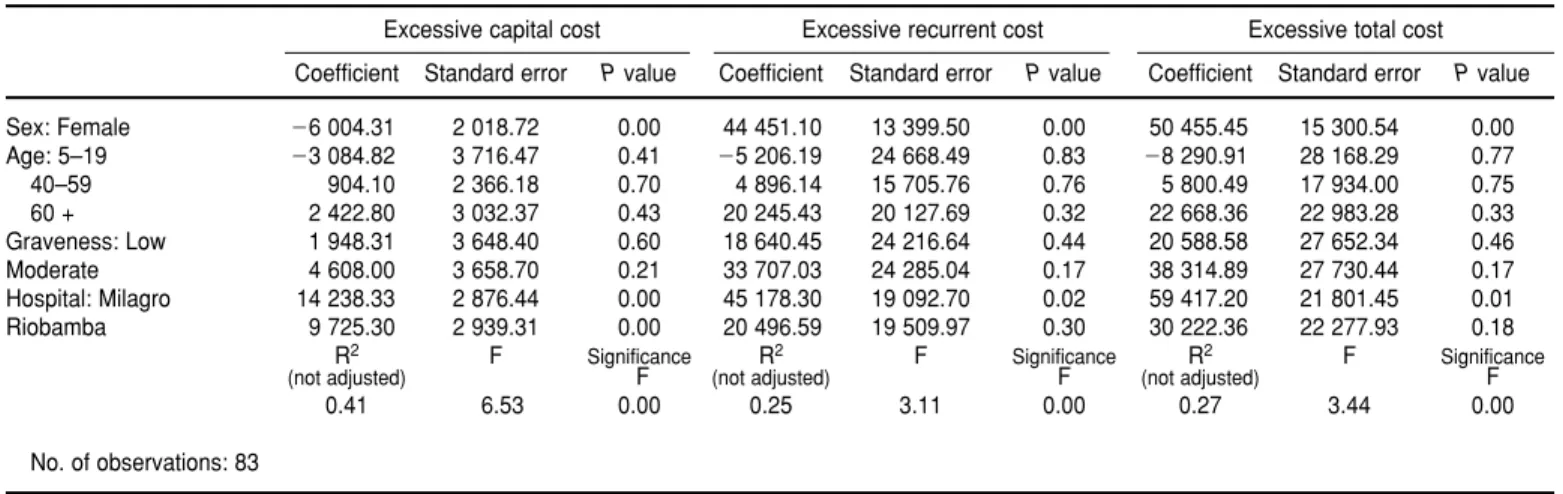
(Chicago, Illinois). The analysis showed (see Tables 4 and 5) the following dif-ferences between the hospitals to be statistically significant: the least com-plex hospital, in Milagro, had signifi-cantly higher excess capital, recurrent, IV rehydration salt, and total costs than the more complex hospital in Guayaquil (P = 0.00, 0.02, 0.05, and 0.01, respectively). Similarly, the ex-cess capital costs and IV and oral rehy-dration salt costs in Riobamba were significantly higher than in Guayaquil (P= 0.00, 0.03, and 0.00, respectively). Finally, the excess capital, recurrent, and total costs of treating women were significantly higher than for men (P =0.00 in all cases).
DISCUSSION
The results show that the overuse of IV rehydration is an important source of inefficiency, occasioning much higher treatment costs than oral hy-dration methods. All the patients who had vomiting as one of their symp-toms received IV treatment, but the switch to oral therapy was never made soon enough. This is just one example of a clear pattern of indiscriminate use of IV rehydration therapy, regardless of the severity of the dehydration. This pattern could be due to:
• the absence of clear, adequately dis-seminated treatment norms, coupled
with poor diagnoses, leading to ex-cess demand for laboratory tests and overcautious treatment. This is ag-gravated by the lack of supervision and well-defined communication channels, both within hospitals and between hospitals and the Ministry of Public Health. The MPH prepared and distributed a cholera treatment manual, yet when asked, many hos-pital staff members responded that they were unaware of it.
• the limited training given to junior residents, who are largely responsi-ble for attending to cholera patients. Senior doctors, on the other hand, tend to eschew the treatment of “less-prestigious” ailments. During the early stages of the epidemic in 1991, nurses and auxiliary staff were given training, while many doctors in the hospitals most affected did not attend the programs, giving as reasons their lack of time and the limited status coming from basic training (11).
According to the norm, treating mild cases should be cheaper than treating more severe ones. Neverthe-less, the results of this research show that excess costs were highest with moderate cases, followed by the mild cases, and lastly, the most-severe cases. This would appear to suggest that all the patients were treated simi-larly, regardless of the severity of their illness as indicated by their symptoms.
TABLE 3. Cholera-patient-days by severity, hospital, and sex, Ecuador, 1994a
Patient-day/ Average Excess/
Low Moderate Grave personnel Excess days Ideal days excess days observed days (%)
Severity:
Low . . . 45 64 1.2 41.3
Moderate . . . 51 69 1.5 42.9
Grave . . . 17 24 1.5 41.5
Hospital:
Guayaquil 23 21 2 14.5 44 88 1.0 33.3
Riobamba 5 6 9 9.7 46 41 2.3 52.9
Milagro 9 8 0 3.6 23 28 1.4 45.1
Sex:
Female 20 15 5 . . . 76 80 1.9 48.7
Male 17 20 6 . . . 37 77 0.9 32.5
Total 37 35 11 . . . 113 157 1.4 41.9
The inverse relationship found be-tween hospital complexity and excess treatment costs could be the result of greater demand for cholera treatment and better-qualified staff working in the more-specialized hospitals, in turn contributing to a more efficient use of resources (Tables 1, 4, and 5).
The least-complex hospital, in Mila-gro, had a higher cost of land, build-ings, and equipment per patient-day, $6.20, versus $2.30 in Guayaquil and $3.00 in Riobamba. That may be in part the result of remodeling carried out in Milagro over the last five years. While the Milagro hospital may not be com-parable with other primary-level
hos-pitals due to these higher capital costs, it could be argued that the Milagro hospital suffered from lower occu-pancy rates or excess capacity of facil-ities, resulting in excess treatment costs. For this reason, in the future it will be important to analyze carefully the value of expanding the canton-level hospitals if patients can be more efficiently treated in the larger hospi-tals where economies of scale can re-duce costs and increase efficiency.
The Riobamba hospital had a greater proportion of severe cases (45%), cou-pled with the previously noted ten-dency to treat all patients similarly, re-gardless of their severity. This in part
explains its relatively lower excess expenditure on laboratory tests and medical supplies, especially IV rehy-dration salts (Table 2), even though in absolute terms the excess days of hos-pitalization are higher than in the other hospitals (Table 3). This suggests that, in spite of having a greater pro-portion of severe cases, the hospital was more efficient than the hospitals in Guayaquil and Milagro in terms of excess use of IV rehydration therapy.
The Guayaquil hospital, the busiest and most complex in the sample, had the lowest recurrent, capital, and total costs per patient (Table 1). Although its ratio of excess to observed costs was lower than in Milagro, it had a higher per-patient expenditure on IV therapy (Table 2) which, in view of the fact that it received a particularly large number of cholera patients, would have made a significant contribution to the hospital’s overall costs. This would be especially worrying if there were a new epidemic, since the Guay-aquil hospital would be the major re-cipient of cases in its region.
The high level of excess costs in-curred in cholera treatment in all three of the hospitals studied raises the question as to the reasons why trained medical staff prescribe treatments that are inefficient and often not recom-mended for cholera patients. One im-portant factor would appear to be that MPH hospital budgets are established on the basis of the previous year’s oc-TABLE 4. Determinants of excessive cholera treatment cost, Ecuador, 1994, multiple regression analysis results (with intercept), dependent variables
Excessive capital cost Excessive recurrent cost Excessive total cost Coefficient Standard error Pvalue Coefficient Standard error Pvalue Coefficient Standard error Pvalue
Sex: Female ⫺6 004.31 2 018.72 0.00 44 451.10 13 399.50 0.00 50 455.45 15 300.54 0.00 Age: 5–19 ⫺3 084.82 3 716.47 0.41 ⫺5 206.19 24 668.49 0.83 ⫺8 290.91 28 168.29 0.77 40–59 904.10 2 366.18 0.70 4 896.14 15 705.76 0.76 5 800.49 17 934.00 0.75 60 + 2 422.80 3 032.37 0.43 20 245.43 20 127.69 0.32 22 668.36 22 983.28 0.33 Graveness: Low 1 948.31 3 648.40 0.60 18 640.45 24 216.64 0.44 20 588.58 27 652.34 0.46 Moderate 4 608.00 3 658.70 0.21 33 707.03 24 285.04 0.17 38 314.89 27 730.44 0.17 Hospital: Milagro 14 238.33 2 876.44 0.00 45 178.30 19 092.70 0.02 59 417.20 21 801.45 0.01 Riobamba 9 725.30 2 939.31 0.00 20 496.59 19 509.97 0.30 30 222.36 22 277.93 0.18
R2 F Significance R2 F Significance R2 F Significance
(not adjusted) F (not adjusted) F (not adjusted) F
0.41 6.53 0.00 0.25 3.11 0.00 0.27 3.44 0.00
No. of observations: 83
TABLE 5. Determinants of excessive rehydration solution costs, Ecuador, 1994, multiple re-gression analysis results (with intercept), dependent variables
Intravenous Oral
Standard Standard
Coefficient error Pvalue Coefficient error Pvalue
Sex: Female 2 662.17 3 399.96 0.44 65.04 285.78 0.82 Age: 5–19 ⫺291.96 6 259.32 0.96 ⫺283.31 526.12 0.59 40–59 ⫺2 497.88 3 985.14 0.53 334.39 334.97 0.32 60 + 3 651.72 5 107.15 0.48 93.58 429.28 0.83 Graveness: Low 5 389.06 6 144.67 0.38 123.95 516.49 0.81 Moderate 7 948.65 6 162.02 0.20 ⫺373.72 517.95 0.47 Hospital: Milagro ⫺9 562.63 4 844.53 0.05 201.71 407.21 0.62 Riobamba ⫺10 809.86 4 950.41 0.03 1 793.22 416.11 0.00
R2 F Significance R2 F Significance (not adjusted) F (not adjusted) F
cupancy rate (the ratio of occupied bed-days to total available bed-days). This provides an incentive to hospital-ize patients unnecessarily and extend a patient’s stay once admitted, so as to raise the occupancy rate. Additionally, hospitals have been known to close wards with this same aim of increas-ing the proportion of occupied bed-days and thus securing more funds in the subsequent year’s budget.
It is worth underlining that the hos-pitals could have saved money by ad-ministering the correct treatment and avoiding unnecessary and excessively long periods of hospitalization. An ex-ample of these savings can be found in the Babahoyo provincial hospital, where the costs of cholera treatment have been significantly reduced by im-plementing a management system based on continuous improvement in patient care (11). Another possible so-lution would be to adopt the budget system many countries use, where funds are assigned on the basis of the income and specific diagnosis of each patient and hospitals receive more funding if they treat more patients. This approach provides a disincentive to prolonged hospital stays and unnec-essary and expensive treatments.
In general, it can be said that if the cholera treatment guidelines of the U.S. Institute of Medicine (22) were observed, 29% of the total excess costs corresponding to medical supplies and exams would be automatically re-duced. The reduction of the rest of the excess costs (personnel, administra-tion, and capital costs) would require measures other than the correct appli-cation of treatment guidelines, such as the elimination of excess hospital beds and staff.
The higher treatment costs observed with women patients is related to their longer periods of stay in hospital, with their excess periods of hospitalization more than double those of men. This directly raises the capital and person-nel and administration costs of their treatment (Table 1). Although the treatment norm specified a slightly longer treatment period for women, this distinction is not enough to ex-plain the differences found. Nor do
differences in the severity of the cases account for the variation, since more of the female patients were among the mild cases (Table 3).
The small influence a patient’s age has on excess costs is not surprising when one takes into account that around 70% of the sample population was in the 20–59 age range and that children under 5 were excluded from the study. Both the very young and the old would have been more likely to suffer complications. The exclusion of young children produced a more ho-mogenous population and reduced the size of the “U” curve in the excess average total costs for the different age groups.
The results of this study could, with due caution about the homogeneity of the treatment facilities in the Ecua-dorian public health system, be ex-trapolated to other, similar hospitals. Nevertheless, to corroborate the results found here and have a larger sample from which to extrapolate, further re-search is required in which the meth-odology is varied with the focus of the study. This research analyzed treat-ment costs from the perspective of each individual hospital, specifically highlighting the impact of different factors in the generation of excess treatment costs, in order to provide hospital directors and administrators and health service policy-makers with information to plan responses to fu-ture epidemics and to reduce the costs of cholera treatment in general. If, for example, the objective were to identify priorities for cost reductions in the public health system as a whole, it would be necessary to analyze the real demand for health care and then focus investment in those areas where de-mand is highest and where economies of scale can be achieved.
The research did not attempt to pre-dict the excess costs of cholera treat-ment or project them on a nationwide basis; this would require a different research methodology with factors not considered in the present analysis. Likewise, no attempt was made to es-timate the social cost of the cholera epidemic, for which information on the real or imputed income foregone
by each patient and the opportunity costs of their treatment would have been necessary.
Finally, it is worth mentioning that a new cholera strain, Vibrio cholerae0139, has been identified in Bangladesh and other parts of South Asia and to which immunity is not acquired through pre-vious exposure to the disease (23). If this strain were to arrive in Latin Amer-ica, the resultant epidemic could be as serious as the one studied in the re-search reported here. For this reason, and to prevent a severe drain on the resources of the Ecuadorian health system, it is vital that training pro-grams for medical staff be developed that take into account the relative effi-ciency of different treatments and that strengthen diagnostic and prescription procedures. Emphasis should also be put on the use of oral rehydration ther-apy whenever possible. As part of this process, hospital communication and information systems need to be im-proved so that policies and procedures can be monitored and evaluated and treatment norms adequately dissemi-nated, following such approaches to developing and using clinical-practice guidelines as those recommended by the U.S. Institute of Medicine (22).
Acknowledgements. Financial
sup-port for this research was provided by the Harvard University Applied Diar-rheal Disease Research project by way of a cooperative agreement sponsored by the United States Agency for Inter-national Development.
The authors are also grateful for the comments and technical sugges-tions provided by four anonymous referees, as well as Robert Robertson, John Rapoport, Robert Gilman, Car-los Campillo, Davidson Hamer, and James Trostle, the last of whom also helped the research through the Har-vard Institute for International Devel-opment (HIID).
Fuen-ANNEX 1. Methodology used to calculate recurrent and capital costs
I. Recurrent Costs
1) Personnel Costs
i) From payrolls and staff distributions, personnel were divided into three groups: [A] those whose work was exclusively confined to the pediatrics or clinical departments (Riobamba and Milagro) or infectious diseases (Guayaquil), [B] those who worked exclusively in other areas, and [C] those who worked in the hospitals’ general services departments (e.g., administration, kitchens, etc.).
ii) In calculating the staff costs associated with cholera treatment, the total wage bill of the work-ers in group A was included, none from group B, and that part of the wages of the workwork-ers in group mayor, Betty Pomboza, Laura Quinzo,
and Luz María Cóndor. Likewise, we are indebted to Dr. Alberto Narváez, National Director of Epidemiology at the Ministry of Public Health; Dr. Ri-cardo Cañizares, regional Epidemiol-ogy Chief in the Region II Health Un-dersecretariat; Dr. Telmo Fernández,
Director of the Hospital Infectológico de Guayaquil “Dr. José Daniel Ro-dríguez Maridueña”; Dr. Eduardo Chafla, Director of the Hospital Poli-clínico de Chimborazo; and Dr. Roberto Del Salto, Director of the Hos-pital “León Becerra” de Milagro. We are also indebted to the administrative
staff, doctors, and nurses in the three hospitals and in the Ministry of Public Health who participated in the work-shop held in Guayaquil in March 1995, without whom this research would have been impossible, and, finally, to Mariana Naranjo, who participated in the preparatory stages of the project.
1. Ecuador, Ministerio de Salud Pública. Datos sobre el cólera en el Ecuador. Quito: MSP; 1994. 2. Weil O, Berche P. The cholera epidemic in Ecuador: Towards an endemic in Latin Amer-ica. Rev Epidemiol Sante Publique 1992;40: 145–155.
3. Sempértegui R, García L. Cólera in: Ministerio de Salud Pública/UNICEF. Panorama epide-miológico del Ecuador. Quito: MSP/UNICEF; 1992.
4. Barua D, Greenough III W. Cholera. New York: Plenum Publishing Corporation; 1992. 5. Robertson R, Castro C, Gómez L, Gwynne G,
Tinajero C, Zschock D. Primary health ser-vices in Ecuador: Comparative costs, quality and equity of care in Ministry of Health and rural Social Security facilities. Soc Sci Med 1991;32:1327–1336.
6. Shepard D, Robertson R, Cameron III C, Sa-turno P, Pollack M, Manceau J, et al. Costo-eficacia de las estrategias de vacunación en ser-vicios ordinarios y en campañas en el Ecuador. Bol Oficina Sanit Panam 1992;112:110–129. 7. Nieto P, et al. Análisis de costos de
hospita-lización en pacientes afectados por cólera en la provincia de Imbabura [unpublished re-port]. Quito, Ecuador; 1991.
8. Ecuador, Ministerio de Finanzas. Presupuesto del estado, 1993 [supplement to] Registro ofi-cial, Year I, Volume II, Number 99; 1993. 9. Ecuador, Ministerio de Finanzas. Presupuesto
del estado, 1994 [supplement to] Registro ofi-cial, Year II, Volume I, Number 350; 1994.
10. Cañizares R, Valle K, Briones A. Manejo hos-pitalario del cólera en el Hospital de Guaya-quil. In: Ministerio de Salud Pública/Organi-zación Mundial de la Salud/OrganiPública/Organi-zación Panamericana de la Salud. Boletín Informa-tivo sobre el cólera en la costa ecuatoriana. Guayaquil, Ecuador: MSP/OPS/OMS; 1992. (Boletín epidemiológico especial).
11. Hermida J, Laspina C, Idrovo F. Improving quality of cholera case management in a hos-pital setting in Ecuador [draft of report]. Be-thesda, Maryland: Quality Assurance Project; 1994.
12. Endsley S, McCarthy D. Field-test of cost ele-ments of revised WHO/PAHO health facility survey [trip report]. Honduras: Pan American Health Organization; 1993.
13. Phillips M. Report on the development and field-testing of a costing component in the CDD health facility survey manual. Pan Amer-ican Health Organization; 1992.
14. Cost-effectiveness analysis of oral rehydration therapy. Wkly Epidemiol Rec 1990;36:275–279. 15. Srivastava V, Arya H, Uppal S, Rath B, Lais-ram N. Comparison of oral and intravenous rehydration among hospitalized children with acute diarrhoea. J Diarrhoeal Dis Res 1985;3:92–95.
16. Sircar BK, Saha MR, Deb BC, Singh PK, Pal SC. Effectiveness of oral rehydration salt solu-tion (ORS) in reducsolu-tion of death during cho-lera epidemic. Indian J of Public Health 1990;34:68–70.
17. Ecuador, Instituto Nacional de Estadística y Censos. Anuario de estadísticas hospitalarias. Quito: INEC; 1993.
18. Organización Mundial de la Salud/Organi-zación Panamericana de la Salud. Guía para la prevención y control del cólera. Quito: OMS/ OPS; 1991.
19. Horton S, Claquin P. Cost-effectiveness and user characteristics of clinic based services for the treatment of diarrhea: a case study in Ban-gladesh. Soc Sci Med 1983;17:721–729. 20. Creese A. Cost effectiveness of potential
im-munization interventions against diarrhoeal disease. Soc Sci Med 1986;23:231–240. 21. Creese A, Sriyabbaya N, Casabal G, Wiseso G.
Cost-effectiveness appraisal of immunization programmes. Bull World Health Organ 1982; 4:621–632.
22. Field MJ, Lohr KN, eds. Guidelines for clinical practice: From development to use. Washing-ton, D.C.: National Academy Press; 1992. 23. Shears P. Cholera. Ann Trop Med Parasitol
1994;88:109–122.
Manuscript received on 13 June 1997. Revised version accepted for publication 24 September 1998.
C corresponding to the proportion of clinical, pediatric, and infectious disease patient-days to total patient-days in each hospital.
iii) Having summed the relevant wages for the first six months of 1994, this total was divided by the daily average of clinical, pediatrics, and infectious disease patient-days in the same period, thus producing the staff cost per patient-day.
2) Other Recurrent Costs
For the remaining recurrent costs (administration, food, cleaning, electricity, fuel, and water), the total expenditure on each item recorded in the hospital accounts was summed for the first six months of 1994, and then divided by total number of patient-days for the period, giving the average cost per patient-day.
3) Total Recurrent Costs
To obtain the total recurrent cost per patient-day, the totals from 1 and 2 above were added to the expenditure on medicines and other materials necessary to administer rehydration salts. This figure was then multiplied by the number of days each patient spent being treated, thus generating the ideal, excess, and total costs per patient.
II. Capital Costs: Land, Buildings, and Hospital Equipment
1) Land and Buildings
i) The cost of hospital land and buildings per patient-day was calculated on the basis of the com-mercial value used for taxation purposes by the municipal valuation and property registry office in each city.
2) Hospital Equipment
i) In order to calculate the value of hospital equipment, information was taken from hospital in-ventories, the items referring to equipment investments in budget statements, and details of pur-chases made directly by the Ministry of Public Health (MPH).
ii) The estimation of the value of the equipment whose use was associated with cholera treatment followed a procedure similar to that used to calculate personnel costs. First, the total inventory was divided into three groups: [A] those pieces of equipment used exclusively in the clinical, pediatrics, and infectious disease departments, [B] those not used in cholera treatment, and [C] those of general usage (e.g., computers, beds, desks).
iii) In the case of the equipment registered in hospital inventories, its current value was deter-mined by taking the value recorded in the inventory as the initial value (this assumption, despite its obvious imprecision, was used due to the lack of data available on purchase prices and dates) and then depreciating that at a rate of 14% a year, up to a maximum of 70%. These values were then con-verted into April 1994 (the start date of the project) sucres on the basis of the cumulative inflation rates in each of the cities between the date of the inventory and the beginning of the project. To cal-culate the total equipment costs, the total value of the equipment in group A, none of group B, and the value of equipment in group C was multiplied by the ratio of clinical, pediatrics, and infectious disease patient-days to total patient-days.
iv) To the value of equipment registered in hospital inventories as calculated above in iii were added the value of the equipment recorded in hospital budgets. However, since there was no men-tion of the type or use of the equipment registered, the value used was the current value multiplied by the ratio of clinical, pediatrics, and infectious disease patient-days to total patient-days.
equip-ment involved four stages. First, the prices in each contract were converted into sucres at the date of delivery to the receiving hospital, using national price indexes. Second, each piece of equipment was depreciated, using the formula described earlier, from the hospital delivery date to the beginning of the project. Third, these values were converted into April 1994 sucres using the respective inflation rates in each of the three cities. Finally, the value corresponding to cholera treatment was calculated in the same way as already described for the other cost categories.
vi) The values obtained above were then added together to give the total value of equipment as-sociated with cholera treatment in each hospital.
3) Total Land, Building, and Equipment Costs per Patient-day
Adding the values of land and buildings to those of hospital equipment, the total current value of the hospital was determined. An annual rental value equal to 10% of the total current value (and 5% for the six months covering the study) was assumed. The total land, building, and equipment costs per day were then calculated by dividing this six-month value by the total number of patient-days during that period.
Notes to Annex 1:
a) Since inflation data were not available for Milagro, figures corresponding to Guayaquil, the nearest large city, were used.
b) In calculating the value of buildings, the value of areas totally unrelated to cholera treatment was not deducted from the total, thus leading to an overestimation of the costs per patient-day in this category.
c) With regard to personnel costs, in the case of Guayaquil the payroll for June 1994 alone was used for the calculations, due to the lack of information on the other months covered by the study.
d) In the calculations based on budget statements, in Guayaquil patient information was only available for the first five months of 1994, in Milagro there was only data on budgets and patients for the period January–May, and in Riobamba, in the absence of consolidated budget statements, other documents from the accounting department were used.
ANNEX 2. Norm used for estimating correct cholera treatment
1. Loss of liquids: Estimate loss of liquids using the following formula:
(weight in kg) ⫻(degree of dehydration expressed as a proportion) = liters of liquid lost 2. Initial rehydration requirement: Evaluate the initial rehydration requirement as follows:
• Severe cases: IV—50% during the first hour, the rest during the subsequent 2–4 hours • Moderate cases with uncontrollable vomiting: treatment as per severe cases, followed by oral
rehydration
• Mild cases with uncontrollable vomiting: IV until the vomiting has passed, followed by oral rehydration. When vomiting is not present and liquids are tolerated: oral rehydration from the outset.
3. Maintenance rehydration therapy: Maintenance rehydration therapy should at all times be ad-ministered orally, except when uncontrollable vomiting is present. As soon as the vomiting has passed, oral therapy should be adopted.
4. Quantity of liquids administered: It is to be assumed that the quantity of liquids the relevant health unit administers as part of the maintenance rehydration is correct.
5. Type of liquid administered: The types of liquid to be administered are as follows:
• When a patient stays less than one day in hospital and the initial rehydration has not been completed, the remaining rehydration salts should be given to the patient for oral administra-tion at home.
• When a patient has spent more than one complete day in hospital and is sent home with oral rehydration salts, even if the initial rehydration is deemed adequate, these additional salts are considered appropriate but not obligatory.
• When a patient receives less than the required initial rehydration therapy, the initial rehydra-tion administered is considered to be equal to the ideal treatment.
6. Hospital stay: The length of the hospital stay depends on severity:
• Mild cases without uncontrollable vomiting should not be admitted to hospital.
• Mild cases with uncontrollable vomiting should be hospitalized while they receive intra-venous therapy, and then until they have fewer than three diarrheal depositions within 24 hours.
• Moderate and severe cases should remain in hospital during the initial rehydration and until they have fewer than three diarrheal depositions within 24 hours, are not vomiting, and their vital signs are stable.
7. Antibiotics: Antibiotics should be administered as follows: • Tetracycline – adults: 500 mg every 6 hours for three days • Erythromycin – adults: 250 mg every 6 hours for three days
– children: 30 mg/kg three times a day for three days
• Sulfas – adults: 160 mg/kg trimethoprim and 800 mg/kg sulfamethoxazole twice a day for three days
– children: 5 mg/kg trimethoprim and 25 mg/kg sulfamethoxazole twice a day for three days
8. Laboratory exams: The test considered appropriate is a Gram’s stain to identify Vibrio cholerae, although it is not considered necessary for diagnosis. All other tests are considered excessive. 9. All other medication is considered excessive, with the exception of those necessary for the
treat-ment of passing symptoms, such as migraine.
10. Medications to treat parasites are not taken into account.
En este estudio se examinó la eficiencia del tratamiento del cólera en tres hospitales representativos del sistema público de salud ecuatoriano, a fin de ofrecer a los direc-tores y administradores de hospitales y a las autoridades que dictan las políticas de los sistemas de salud información de utilidad para planificar la respuesta frente a fu-turas epidemias y reducir los costos del tratamiento del cólera en general. Para los fines del estudio se calcularon los costos totales y excesivos del tratamiento del cólera usando como fuente los archivos y estadísticas de hospitales y un sistema intrahospi-talario para la vigilancia de casos de cólera. Se examinaron el tipo y la cantidad de los recursos usados para tratar a cada paciente, así como el número de días de hospita-lización, de acuerdo con la gravedad de la enfermedad. Mediante este proceso se de-terminaron los costos excesivos en relación con la “norma terapéutica” que hubiera sido la apropiada para cada paciente.
Los investigadores encontraron que 45% de los costos del tratamiento del cólera eran excesivos. El componente que más contribuyó al exceso fue el de costos recur-rentes (90%), entre los cuales se contemplan las hospitalizaciones largas, el uso des-proporcionado de las soluciones rehidratantes para uso intravenoso y las pruebas de laboratorio innecesarias. Los costos de capital excesivos, desde el terreno y los edifi-cios, hasta la indumentaria del hospital, representaron 10% del total de los costos ex-cesivos en tratamientos. No se halló ninguna asociación significativa entre los costos del tratamiento y la gravedad de la enfermedad, ni entre estos costos y la edad del pa-ciente. El sexo del paciente fue una variable de importancia, ya que el costo de tratar a las mujeres fue notablemente mayor que el de tratar a los hombres. Se encontró una relación inversa entre los costos en tratamientos y la complejidad del hospital. Los in-vestigadores llegaron a la conclusión de que en el tratamiento del cólera se hizo un uso ineficiente de los recursos en los tres hospitales donde se realizó el estudio. RESUMEN