BGD
9, 6409–6443, 2012Silicon isotopes in the eastern South
Pacific
G. F. de Souza et al.
Title Page
Abstract Introduction
Conclusions References
Tables Figures
◭ ◮
◭ ◮
Back Close
Full Screen / Esc
Printer-friendly Version Interactive Discussion
Discussion
P
a
per
|
Dis
cussion
P
a
per
|
Discussion
P
a
per
|
Discussio
n
P
a
per
|
Biogeosciences Discuss., 9, 6409–6443, 2012 www.biogeosciences-discuss.net/9/6409/2012/ doi:10.5194/bgd-9-6409-2012
© Author(s) 2012. CC Attribution 3.0 License.
Biogeosciences Discussions
This discussion paper is/has been under review for the journal Biogeosciences (BG). Please refer to the corresponding final paper in BG if available.
Silicon stable isotope distribution traces
Southern Ocean export of Si to the
eastern South Pacific thermocline
G. F. de Souza1,*, B. C. Reynolds1, G. C. Johnson2, J. L. Bullister2, and B. Bourdon1,**
1
ETH Zurich, Institute of Geochemistry and Petrology, Zurich, Switzerland
2
Pacific Marine Environmental Laboratory, National Oceanic and Atmospheric Administration, Seattle, Washington, USA
*
now at: Atmospheric and Oceanic Sciences Program, Princeton University, Princeton, New Jersey, USA
**
now at: Laboratoire de G ´eologie de Lyon, ENS Lyon, CNRS and UCBL, Lyon, France Received: 23 April 2012 – Accepted: 7 May 2012 – Published: 5 June 2012
Correspondence to: G. F. de Souza ([email protected])
BGD
9, 6409–6443, 2012Silicon isotopes in the eastern South
Pacific
G. F. de Souza et al.
Title Page
Abstract Introduction
Conclusions References
Tables Figures
◭ ◮
◭ ◮
Back Close
Full Screen / Esc
Printer-friendly Version Interactive Discussion
Discussion
P
a
per
|
Dis
cussion
P
a
per
|
Discussion
P
a
per
|
Discussio
n
P
a
per
|
Abstract
The cycling and transport of dissolved silicon (Si) in the ocean may be traced by its stable isotope composition,δ30Si. We present a dataset ofδ30Si values along 103◦W in the eastern South Pacific Ocean, ranging from the Antarctic Zone of the Southern Ocean (62◦S) to the equatorial Pacific (12◦S). At high southern latitudes, the uptake
5
and associated isotope fractionation of Si by diatoms results in highly elevatedδ30Si values (up to+3.2 ‰) in the summer mixed layer. The efficient export of diatom opal to depths inaccessible to annual winter convection is reflected by high δ30Si values (+2 ‰) preserved in high-latitude winter mixed layers. These elevated δ30Si values are introduced into the ocean interior by the subduction of Subantarctic Mode Water
10
(SAMW) and Antarctic Intermediate Water (AAIW), whose northward spreading results in a strong isopycnal control on lower-thermocline and intermediateδ30Si values in the well-ventilated eastern South Pacific. Values of δ30Si are strongly conserved along SAMW and AAIW density levels as far north as 26◦S, documenting the importance of the export of preformed Si from the surface Southern Ocean to lower latitudes. In
con-15
trast, in the equatorial Pacific, depressedδ30Si values in the mesopelagic ocean are observed, most likely documenting the combined influence of a North Pacific Si source as well as the accumulation of remineralized Si within the eastern equatorial Pacific shadow zone. At depth,δ30Si values in the South Pacific remain indistinguishable from deep Southern Ocean values of +1.25 ‰, even within Si-rich and oxygen-poor deep
20
waters returning from the North Pacific. This homogeneity implies that the dissolution of opal plays a negligible role in altering theδ30Si value of deep waters as they traverse the deep Pacific Ocean.
1 Introduction
The eastern South Pacific is a region of considerable importance for the global ocean,
25
BGD
9, 6409–6443, 2012Silicon isotopes in the eastern South
Pacific
G. F. de Souza et al.
Title Page
Abstract Introduction
Conclusions References
Tables Figures
◭ ◮
◭ ◮
Back Close
Full Screen / Esc
Printer-friendly Version Interactive Discussion
Discussion
P
a
per
|
Dis
cussion
P
a
per
|
Discussion
P
a
per
|
Discussio
n
P
a
per
|
formation region of Subantarctic Mode Water and Antarctic Intermediate Water (SAMW and AAIW; McCartney, 1982; Hanawa and Talley, 2001; Aoki et al., 2007; Sall ´ee et al., 2010). These water masses are important participants in the ocean’s meridional over-turning circulation (MOC), contributing to the upper return flow of waters to the North Atlantic (e.g., Sloyan and Rintoul, 2001; Lumpkin and Speer, 2007). In addition, it has
5
been suggested that SAMW exported northward from the Southern Ocean plays a key role in supplying nutrients to lower latitudes at the near-global scale, controlling the magnitude of low-latitude productivity and leading to the widespread depletion in sil-icon (Si) – a vital nutrient for siliceous phytoplankton – observed in the low-latitude thermocline (Sarmiento et al., 2004; Palter et al., 2010). Within the Pacific Ocean,
10
SAMW/AAIW subducted in the eastern South Pacific also represent a dominant path-way for the supply of nutrients and oxygen to the upwelling zones of the equatorial Pacific (Tsuchiya et al., 1989; Toggweiler et al., 1991; Fine et al., 2001; Dugdale et al., 2002; Karstensen et al., 2008; Sall ´ee et al., 2010), a biogeochemically dynamic region that represents the largest oceanic source of CO2 to the atmosphere (Gruber et al., 15
2009) and hosts the ocean’s most extensive oxygen minimum zones (OMZs). The in-efficiency of the equatorial Pacific biological pump, manifested by its strong CO2 out-gassing, appears to owe its origin at least partially to the low Si content of SAMW/AAIW (Dugdale et al., 2002; Brzezinski et al., 2008), which limits the productivity of diatoms, siliceous phytoplankton that are efficient exporters of carbon to depth (e.g., Buesseler,
20
1998).
In this study, we investigate the influence of the formation and circulation of SAMW/AAIW on the cycling and transport of Si in the eastern South Pacific from the Antarctic Zone (62◦S) to the tropics (12◦S), by analyzing the distribution of the stable isotope composition of dissolved Si, expressed asδ30Si (Eq. 1). When diatoms in the
25
BGD
9, 6409–6443, 2012Silicon isotopes in the eastern South
Pacific
G. F. de Souza et al.
Title Page
Abstract Introduction
Conclusions References
Tables Figures
◭ ◮
◭ ◮
Back Close
Full Screen / Esc
Printer-friendly Version Interactive Discussion
Discussion
P
a
per
|
Dis
cussion
P
a
per
|
Discussion
P
a
per
|
Discussio
n
P
a
per
|
thus trace the biogeochemical processes affecting Si, and may be used as an element-specific constraint on the processes that cycle Si within the sea. Recently, de Souza et al. (2012) have shown that dissolved Si in North Atlantic Deep Water (NADW) has aδ30Si value that is∼0.5 ‰ higher than that of Circumpolar Deep Water (CDW) in the
deep Southern Ocean. They inferred that this difference results from the transport of
5
Si with an elevatedδ30Si value into the North Atlantic by SAMW/AAIW. This inference implies that the process of intermediate/mode water formation in the surface Southern Ocean creates subsurface seawaterδ30Si variability that can be used to trace large-scale oceanic Si transport.
Here, we exploit the broad latitudinal scope of our study to analyze theδ30Si
distri-10
bution in the context of the regional- to large-scale circulation. We trace the evolution of δ30Si values from the SAMW/AAIW formation regions in the high latitudes of the eastern South Pacific into the low-latitude ocean interior. We show that elevatedδ30Si values preserved in high-latitude winter mixed layers are exported to lower latitudes in SAMW/AAIW and conserved as these water masses traverse the subtropical Pacific
15
Ocean, documenting the importance of Southern Ocean export in supplying Si to the base of the permanent thermocline. Furthermore, we show that in the equatorial Pa-cific, theδ30Si distribution reflects the influence of both sources of Si to, and cycling of Si within, this biogeochemically complex system. In the deep waters of the South Pacific Ocean, we document lowδ30Si variability that points towards a minimal role of
20
opal dissolution in altering seawaterδ30Si values.
2 Sampling and analytical methods
This study primarily focuses on 62 seawater samples collected on expedition 33RO20071215 of R/VRonald H. Brown (15 December 2007 to 23 February 2008), a re-occupation of the World Ocean Circulation Experiment (WOCE) line P18
under-25
BGD
9, 6409–6443, 2012Silicon isotopes in the eastern South
Pacific
G. F. de Souza et al.
Title Page
Abstract Introduction
Conclusions References
Tables Figures
◭ ◮
◭ ◮
Back Close
Full Screen / Esc
Printer-friendly Version Interactive Discussion
Discussion
P
a
per
|
Dis
cussion
P
a
per
|
Discussion
P
a
per
|
Discussio
n
P
a
per
|
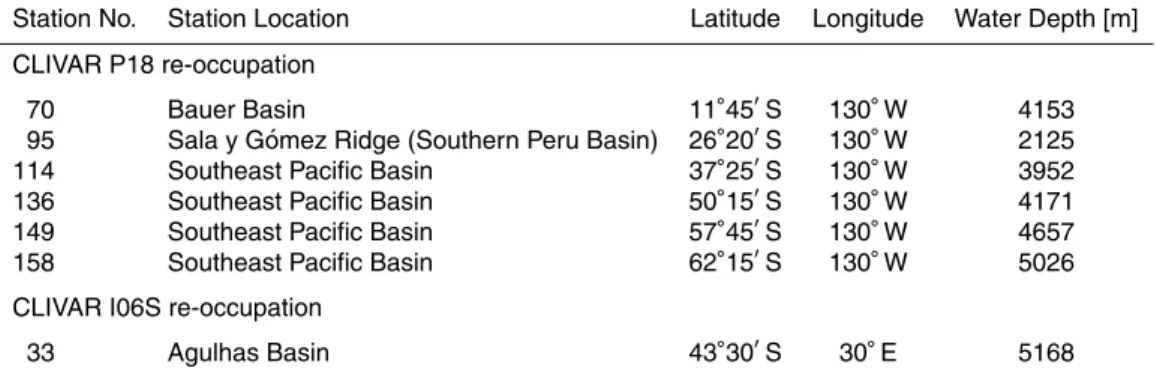
103◦W, from 12◦S to 62◦S (Fig. 1 and Table 1). All samples were filtered onboard us-ing 0.2 µm glass fiber filters and acidified with 1 % v/v distilled 6 M HCl in the laboratory at least 12 h before sample processing. The presented dataset also includes six South-ern Ocean deep water samples from the Indo-Atlantic sector, collected on expedition 33RR20080204 of R/V Roger Revelle (4 February to 17 March 2008), a CLIVAR
re-5
occupation of WOCE line I06S along 30◦E. These samples were filtered using 0.2 µm polyethersulfone filters at our land-based laboratory and acidified as above.
Sample processing and analytical methods were adapted from Georg et al. (2006) and Reynolds et al. (2006), and are described in detail by de Souza et al. (2012). Briefly, Si is separated from sea salt by co-precipitation with brucite and subsequent
10
cation-exchange chromatography. Silicon stable isotope composition is analyzed us-ing a high-resolution multicollector inductively-coupled plasma mass spectrometer ( Nu-Plasma 1700; Nu Instruments, UK) by sample–standard bracketing, and reported as the permil deviation from the standard reference material NBS28, denoted byδ30Si:
δ30Si=
30Si 28Si
sample
30
Si 28Si
NBS 28
−1
×1000 [‰] (1)
15
The long-term external reproducibility of our δ30Si analyses is ±0.12 ‰ (2σSD), as
estimated from the variance of∼300 analyses of the secondary isotopic standard Di-atomite (Brzezinski et al., 2006) over >3 yr. The average δ30Si value of Diatomite measured over this period is+1.22±0.01 ‰ (2 standard errors of the mean, 2σSEM),
consistent with the inter-laboratory comparison study of Reynolds et al. (2007). Most
20
seawater analyses (∼70 %) were completely replicated 2–5 times in separate ana-lytical sessions. External errors on these seawater data, reported as 2σSEM, average
±0.08 ‰ (see Supplementary Table 1). External errors on seawater samples analyzed once are assumed to be equal to the long-term external reproducibility. Error bars shown in all figures are external 2σSEM (or external 2 standard deviations, 2σSD, for
25
BGD
9, 6409–6443, 2012Silicon isotopes in the eastern South
Pacific
G. F. de Souza et al.
Title Page
Abstract Introduction
Conclusions References
Tables Figures
◭ ◮
◭ ◮
Back Close
Full Screen / Esc
Printer-friendly Version Interactive Discussion
Discussion
P
a
per
|
Dis
cussion
P
a
per
|
Discussion
P
a
per
|
Discussio
n
P
a
per
|
In this study, the notations Si, [Si] andδ30Si will refer todissolved silicon (i.e. silicic acid), its concentration, and its stable isotope composition, respectively. Seawater den-sity will be presented as neutral denden-sityγn (Jackett and McDougall, 1997), since this variable is applicable over the entire depth range of the water column.
3 Hydrographic description
5
Line P18 traverses the western margins of four deep ocean basins (Fig. 1): the South-east Pacific Basin, the Chile Basin, the Peru Basin, and the Bauer Basin, which are separated from each other by the Chile Rise (35◦S at 103◦W), Sala y G ´omez Ridge (26–27◦S) and the Gal ´apagos Rise (17–18◦S). The deep Pacific Ocean displays lit-tle variability in the conservative parameters potential temperature,θ, and salinity,S,
10
since it only possesses one source of deep water, CDW from the Southern Ocean (e.g., Schmitz, 1996). The main salinity feature at depth (Fig. 2a) is a muted maximum in the far south, deepening with theγn≈28.1 kg m−3 surface from about 1200 m at 70◦S to the bottom at∼45◦S. This is a highly diluted NADW signal in the Upper Circumpolar
Deep Water (Warren, 1973; Tsuchiya and Talley, 1998). Along the bottom, elevated
15
oxygen concentrations, [O2], trace the northward spreading of CDW up to Chile Rise
(Fig. 2b). Above this lies a mild mid-depth [O2] minimum that has been associated with
return flow from the North Pacific (Reid, 1986; Tsuchiya and Talley, 1998). The basins to the north of Chile Rise are generally less well-oxygenated at depth; in the Peru and Bauer Basins, [O2] decreases northward in two steps that are both associated with 20
increases in [Si] (Fig. 2c). The low [O2] and high [Si] in the northern Bauer Basin are related to the westward flow of deep waters of North Pacific origin that enter the Bauer Basin at its northeastern margin (Reid, 1986, 1997; Tsuchiya and Talley, 1998).
In contrast to the deep ocean, the upper ∼1 km of the South Pacific water
col-umn shows rich water mass structure, reflected most clearly in the salinity distribution
25
BGD
9, 6409–6443, 2012Silicon isotopes in the eastern South
Pacific
G. F. de Souza et al.
Title Page
Abstract Introduction
Conclusions References
Tables Figures
◭ ◮
◭ ◮
Back Close
Full Screen / Esc
Printer-friendly Version Interactive Discussion
Discussion
P
a
per
|
Dis
cussion
P
a
per
|
Discussion
P
a
per
|
Discussio
n
P
a
per
|
spreading of AAIW and SAMW (Tsuchiya and Talley, 1996, 1998) that are formed by deep winter convection in the subantarctic South Pacific (Hanawa and Talley, 2001; Sloyan et al., 2010). Subantarctic Mode Water can be identified as a pronounced po-tential vorticity minimum (not shown) found slightly above the salinity minimum. The high [O2] (Fig. 2b) of SAMW and AAIW highlights the importance of these waters for the 5
ventilation of the subtropical subsurface at lower thermocline and intermediate depths. The northern end of the pronounced salinity minimum, at∼20◦S, is related to the
anti-cyclonic subtropical circulation, which advects AAIW and SAMW westward at this lati-tude. The salinity minimum persists to the north at slightly higher salinity (∼34.55 psu), tracing AAIW that has entered the zonal equatorial circulation further west (Tsuchiya,
10
1991; Tsuchiya and Talley, 1996, 1998).
Another major feature of the salinity distribution is the bowl of salty water that ex-tends from the subtropical front to about 10◦S at the surface (and further north within the subsurface), with a maximum depth of∼300 m. The potential vorticity distribution
allows the distinction of South Pacific Eastern Subtropical Mode Water (SPESTMW),
15
centered around 150 m depth, from the salinity maximum of Subtropical Water (STW) above it (O’Connor et al., 2002; Wong and Johnson, 2003). Both these subtropical water masses are highly depleted in macronutrients over their entire depth and lateral extent. Their extremely low [Si] (0.5–1.5 µM; Fig. 2c) precludedδ30Si analysis, given collected sample volumes of 50–100 ml.
20
North of 20◦S, the mesopelagic water column below SPESTMW and STW is domi-nated by more uniformly saline waters of the equatorial regime. These waters host the South Pacific OMZ, with [O2]<20 µM within the most intense portion of the OMZ cen-tered at 400 m (γn≈26.9 kg m−3) and 6◦S (Fig. 2b). A minor oxygen minimum extends further south to about 27◦S at ∼450 m (γn≈26.75 kg m−3), associated with elevated
25
BGD
9, 6409–6443, 2012Silicon isotopes in the eastern South
Pacific
G. F. de Souza et al.
Title Page
Abstract Introduction
Conclusions References
Tables Figures
◭ ◮
◭ ◮
Back Close
Full Screen / Esc
Printer-friendly Version Interactive Discussion
Discussion
P
a
per
|
Dis
cussion
P
a
per
|
Discussion
P
a
per
|
Discussio
n
P
a
per
|
waters poleward and sheds eddies into the ocean interior (Johnson and McTaggart, 2010).
4 Results
Values ofδ30Si generally increase upwards through the water column, with the high-est values (up to +3.2 ‰) found within the surface mixed layer (Fig. 3,
Supplemen-5
tary Table 1). At depth, the Southern Ocean is exceptionally homogeneous, with an averageδ30Si value of+1.25±0.05 ‰ (2σSD,n=6) at water depths≥1000 m,
corre-sponding to neutral densitiesγn≥27.93 kg m−3. Deep waters at stations further north show similarly lowδ30Si values: the average δ30Si value for all samples outside the Southern Ocean below the salinity minimum of AAIW (≥1400 m, γn≥27.77 kg m−3)
10
is+1.32±0.11 ‰ (2σSD,n=20). Over the same density range as the deep Southern Ocean (γn≥27.93 kg m−3) the average δ30Si value is +1.30±0.08 ‰ (2σSD,n=13). A Monte Carlot-test (see Supplement) indicates a probability of only 7 % that these values are significantly different at the 95 % level, emphasizing the high degree of homogeneity in deep waterδ30Si values. Visually, the deep water column at 37.5◦S
15
appears as an exception, exhibiting a nominally higherδ30Si value than the Southern Ocean (Fig. 3), but the Monte Carlo approach indicates only a 25 % probability that this difference is significant.
In general, seawaterδ30Si values show the strongest vertical gradient within the up-permost 1000 m of the water column, although the depth extent of this gradient varies
20
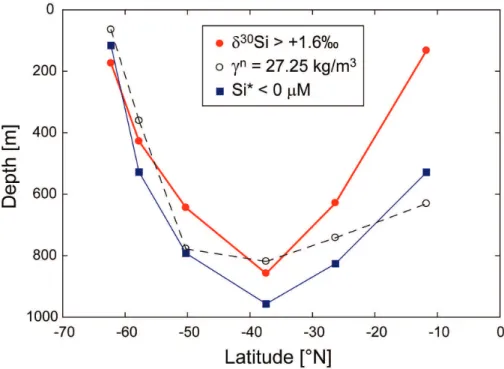
strongly with latitude (Fig. 3) and, on visual inspection, appears to follow the salinity minimum associated with the northward spreading of SAMW/AAIW. The strong north-ward deepening of this gradient can be quantitatively illustrated by considering the depth at which seawaterδ30Si values nominally exceed an elevated value of+1.6 ‰: this surface deepens from just 175 m at 62◦S to a maximum of 858 m at 37.5◦S before
25
BGD
9, 6409–6443, 2012Silicon isotopes in the eastern South
Pacific
G. F. de Souza et al.
Title Page
Abstract Introduction
Conclusions References
Tables Figures
◭ ◮
◭ ◮
Back Close
Full Screen / Esc
Printer-friendly Version Interactive Discussion
Discussion
P
a
per
|
Dis
cussion
P
a
per
|
Discussion
P
a
per
|
Discussio
n
P
a
per
|
50◦S: theγn=27.25 kg m−3surface (Tsuchiya and Talley, 1998) and the deepest sur-face with negative values of the tracer Si∗(=[Si]−[NO3]; Sarmiento et al., 2004). This
close similarity implies a strong isopycnal control on theδ30Si distribution, as expected from Fig. 3.
Accounting for the changes in isopycnal depths across the latitudinal range of this
5
study by usingγn as the vertical axis (Fig. 5) emphasizes the coherence in theδ30Si distribution along isopycnals. Profiles in the deeper water column (γn≥27.7 kg m−3) show thatδ30Si values do not change significantly at depth (Fig. 5c), even though [Si] increases northwards along isopycnals by as much as 63 % (Fig. 5d). In the upper wa-ter column, however, both marked meridional differences as well as clear structure are
10
seen in theδ30Si distribution. The summer and winter mixed layers (stars in Fig. 5) of the southernmost stations (62◦and 58◦S) show highδ30Si values (+1.8 ‰ to+3.2 ‰) at relatively high densities (up toγn=27.5 kg m−3) that outcrop at these high latitudes. In the subsurface water column below the depth of the winter mixed layer, all stations from 62◦S to 37.5◦S exhibit very similar δ30Si−γn relationships, increasing to δ30Si
15
values of around+1.8 ‰ atγn≈27.15 kg m−3, the level of SAMW. A completely diff er-entδ30Si−γnrelationship is seen at 12◦S, whereδ30Si values remain constant around a low value of+1.4 ‰ up to densities as low asγn=26.6 kg m−3.
The only non-monotonicδ30Si−γnrelationship is observed at 26◦S, which remains similar to the more southerly stations up toγn≈27.15 kg m−3, above which it appears
20
to follow the relationship defined by the equatorial water column at 12◦S. This transi-tional nature is also reflected in the mesopelagic [Si] distribution (Fig. 5b, and Figs. S1 and S2 in the Supplement): forγn≥27.15 kg m−3, Si concentrations at 26◦S are very similar to those further south, which are essentially invariant along isopyncals. Above this level, the water column at 26◦S exhibits elevated [Si] over a range centered at
25
γn≈26.75 kg m−3, the level at which a low-[O2] equatorial signal propagates
south-wards (Sect. 3). Silicon concentrations along this isopycnal increase linearly with salin-ity towards the north (Fig. S2), reflecting the spreading of saline, Si-rich and O2-poor
BGD
9, 6409–6443, 2012Silicon isotopes in the eastern South
Pacific
G. F. de Souza et al.
Title Page
Abstract Introduction
Conclusions References
Tables Figures
◭ ◮
◭ ◮
Back Close
Full Screen / Esc
Printer-friendly Version Interactive Discussion
Discussion
P
a
per
|
Dis
cussion
P
a
per
|
Discussion
P
a
per
|
Discussio
n
P
a
per
|
5 Discussion
We first discuss theδ30Si distribution in the upper ocean, analyzing the systematics of
δ30Si values at the high-latitude surface before tracing their subsurface evolution in the mesopelagic subtropical (Sect. 5.1) and equatorial (Sect. 5.2) South Pacific. We then discuss the deep Pacificδ30Si distribution (Sect. 5.3), and identify key questions that
5
will require more detailed study in the future (Sect. 5.4).
5.1 High-latitude control on subtropicalδ30Si distribution
Values ofδ30Si are high in the surface mixed layers of the high-latitude stations at 62◦S and 58◦S, as well as in the nutricline just below the base of the mixed layer at 58◦S and 50◦S. These elevated δ30Si values are the direct result of Si isotope
fractiona-10
tion during uptake of Si by diatoms; satellite-based estimates (MODIS Aqua; Fig. S3) indicate that the highest chlorophylla concentrations were attained about 6–8 weeks before theRonald H. Brownarrived at high latitudes in late summer (February 2008). The extremely highδ30Si values of up to+3.2 ‰ confirm previous observations that di-atom Si isotope fractionation in the surface Southern Ocean produces highly elevated
15
δ30Si values at relatively high [Si] of 3–6 µM (e.g., Varela et al., 2004; Fripiat et al., 2011a, Fig. S4). Late summer mixed layers at high latitudes thus represent a consid-erable inventory of high-δ30Si silicic acid, such that they have the potential to influence seawater δ30Si values when mixed with other water masses by physical processes. Below, we show that this influence is clearly visible, and trace the introduction of the
20
surface nutrient utilization signal into the ocean interior over a number of steps.
5.1.1 Deep winter convection
At high latitudes, strong cooling of surface water in winter leads to destabilization of the water column and convection to depths of >400 m (e.g., Dong et al., 2008), forming a thick winter mixed layer with uniform properties. Analysis of theδ30Si systematics of
BGD
9, 6409–6443, 2012Silicon isotopes in the eastern South
Pacific
G. F. de Souza et al.
Title Page
Abstract Introduction
Conclusions References
Tables Figures
◭ ◮
◭ ◮
Back Close
Full Screen / Esc
Printer-friendly Version Interactive Discussion
Discussion
P
a
per
|
Dis
cussion
P
a
per
|
Discussion
P
a
per
|
Discussio
n
P
a
per
|
the near-surface water column at the two southernmost stations shows that the high
δ30Si values produced in the surface during summer are communicated to the win-ter mixed layer during deep winwin-ter convection: a mixing diagram (Fig. 6) shows that the winter mixed layers lie on a mixing line between the summer mixed layer and the deeper water column. Since the Si-depleted surface waters entrain Si-replete
subsur-5
face waters during convection, they contribute only 20–25 % of the Si within the winter mixed layer (see Supplement). Thus, theδ30Si signal of utilization is strongly attenu-ated by convection, from values over+3 ‰ to values around +2 ‰, but the influence of the high-δ30Si signal continues to be clearly expressed in the winter mixed layer, as similarly observed by Fripiat et al. (2011a), who identify numerous “mixing interfaces”
10
in the Atlantic sector of the Southern Ocean.
Viewed in terms of annual mass balance, the preservation of highδ30Si values in the winter mixed layer implies that a significant portion of the opal produced in the surface ocean is exported past the depth of deepest convection, and that this opal has a low δ30Si value. Thus, the effects of a strongly expressed isotope effect of Si
15
utilization, efficient particulate export, and buoyancy-driven mixing combine over the annual cycle to fractionate Si isotopes between the deeper Southern Ocean and the annually accessible surface. This is the first step in the production of a highδ30Si value in the ocean interior, as discussed below.
5.1.2 Subduction of mode and intermediate waters
20
The winter convection that leads to deep mixed layers in the Subantarctic Zone is the first step in the formation of SAMW, of which southeast Pacific AAIW is the densest type (McCartney, 1977; Hanawa and Talley, 2001). These water masses are subducted into the ocean interior from the winter outcrops of their density surfaces (56◦–61◦S at 103◦W; Antonov et al., 2010; Locarnini et al., 2010) by the combined effects of lateral
25
BGD
9, 6409–6443, 2012Silicon isotopes in the eastern South
Pacific
G. F. de Souza et al.
Title Page
Abstract Introduction
Conclusions References
Tables Figures
◭ ◮
◭ ◮
Back Close
Full Screen / Esc
Printer-friendly Version Interactive Discussion
Discussion
P
a
per
|
Dis
cussion
P
a
per
|
Discussion
P
a
per
|
Discussio
n
P
a
per
|
oxygen and anthropogenic chlorofluorocarbons (CFCs; Fine et al., 2001) and negative Si* values (Sarmiento et al., 2004), into the basal levels of the permanent thermo-cline (Stommel, 1979). This same process also necessarily subducts the high δ30Si values of the winter mixed layer into the ocean interior. As theδ30Si−γn relationship
documents (Fig. 5), these high values are not destroyed by mixing downstream, but
5
rather conserved exceptionally well along the flow path of SAMW and AAIW in the sub-tropical interior. For all samples within the SAMW–AAIW density range ofγn=27.15– 27.3 kg m−3, theδ30Si values of all stations south of 12◦S are essentially identical to each other (and to the winter mixed layer at 58◦S). As Fig. 3 shows, there is a striking correspondence of high subsurface δ30Si values with the tongue of low salinity and
10
negative Si* that traces SAMW/AAIW. The close association of these well-ventilated waters with highδ30Si values in the subsurface is further illustrated by the correlation between highδ30Si values and significant concentrations of anthropogenic CFC-11 in subsurface waters (Fig. S5).
The broad latitudinal span of our data thus reveals that the high-δ30Si signal of
15
SAMW/AAIW, a result of high-latitude nutrient dynamics, is preserved far to the north as these waters spread into the subtropical ocean interior. The strong isopycnal coherence ofδ30Si values unequivocally documents the importance of these water masses in sup-plying Si to the low-latitude thermocline, as postulated by Sarmiento et al. (2004). Fur-thermore, the degree to whichδ30Si values are conserved far into the subtropical
Pa-20
cific Ocean implies that the preformed component of Si, incorporated into SAMW/AAIW during subduction, remains dominant in the well-ventilated subtropical gyre – and thus that opal dissolution plays an insignificant role in determining the Si distribution here. This picture changes dramatically in the equatorial regime north of 20◦S, and it is to this section of the dataset that we now turn.
25
5.2 Lowδ30Si in the mesopelagic equatorial Pacific
BGD
9, 6409–6443, 2012Silicon isotopes in the eastern South
Pacific
G. F. de Souza et al.
Title Page
Abstract Introduction
Conclusions References
Tables Figures
◭ ◮
◭ ◮
Back Close
Full Screen / Esc
Printer-friendly Version Interactive Discussion
Discussion
P
a
per
|
Dis
cussion
P
a
per
|
Discussion
P
a
per
|
Discussio
n
P
a
per
|
signature of SAMW and AAIW, which is strongly conserved further south, is lost in the equatorial Pacific. In the following, we attempt to identify the origin of this difference, which requires consideration of the circulation and nature of biogeochemical cycling in the equatorial Pacific Ocean.
Tracer distributions (Fig. 2) as well as θ–S relationships (Fig. S6) show that the
5
mesopelagic water column at 12◦S is markedly different from that within the subtrop-ical gyre: it is more saline, poorer in oxygen and richer in nutrients. These features are the result of a number of processes. Thermocline and intermediate waters of the subtropical gyre transit to the equatorial regime via a northward western boundary un-dercurrent in the Western Pacific. The downward mixing of upper, more saline waters
10
in the undercurrent is the most likely cause of the observed salinity increase (Tsuchiya and Talley, 1996), since AAIW already exhibits the typical salinity and density of its equatorial type (S=34.5, γn=27.45 kg m−3) when it reaches the western equatorial Pacific (Tsuchiya, 1991). Within the equatorial system, conservative parameters show little zonal variability on mesopelagic isopycnals. In stark contrast to this,
biogeochem-15
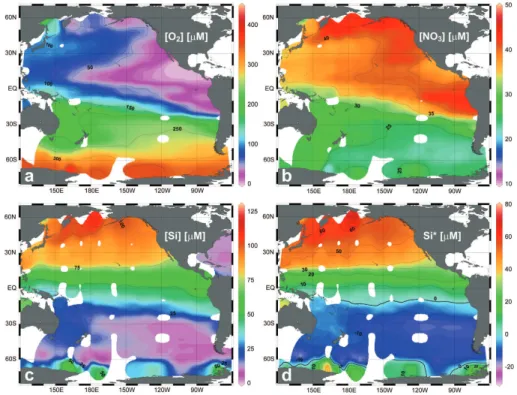
ical tracers such as oxygen and nitrate show strong zonal isopycnal gradients, with the Eastern Pacific being nitrate-richer and oxygen-poorer than the west (Fig. 7a, b); indeed, the Eastern Pacific hosts the ocean’s most extensive OMZs. The oxygen de-pletion and nitrate enrichment are the result of a combination of sluggish ventilation, strongly zonal flow, and the remineralization of organic matter that leads to a high
oxy-20
gen demand (e.g., Karstensen et al., 2008). These processes lead to the build-up of a large pool of remineralized nutrients in the eastern subsurface (e.g., Toggweiler and Carson, 1995).
Interestingly, Si is an exception to the general rule of strong zonal concentration gradients (Fig. 7c): Si concentrations primarily show a strong meridional gradient, with
25
BGD
9, 6409–6443, 2012Silicon isotopes in the eastern South
Pacific
G. F. de Souza et al.
Title Page
Abstract Introduction
Conclusions References
Tables Figures
◭ ◮
◭ ◮
Back Close
Full Screen / Esc
Printer-friendly Version Interactive Discussion
Discussion
P
a
per
|
Dis
cussion
P
a
per
|
Discussion
P
a
per
|
Discussio
n
P
a
per
|
content of basal thermocline waters of South and North Pacific origin. This disparity is displayed in the distribution of the tracer Si*, which increases from negative values in the south (representing a Si deficit) to highly positive values in the north (Fig. 7d; Sarmiento et al., 2004). At the depth level of the Equatorial Undercurrent (EUC) that is fed by both northern and southern sources (Tsuchiya et al., 1989; Toggweiler et al.,
5
1991), Dugdale et al. (2002) have shown that the disparate Si content of northern and southern waters results in waters of North Pacific origin contributing disproportionately to the Si budget, supplying 70 % of Si in the EUC. This lateral influence of the Si-rich North Pacific is reflected in the meridional Si∗ and [Si] gradients across the equatorial Pacific Ocean.
10
In addition to this meridional gradient, there is also a zonal [Si] gradient south of the equator, associated with the Peruvian coastal upwelling. This gradient can be viewed as the result of an additional enrichment of Si on isopycnals towards the east, over and above the enrichment caused by the incorporation of a Si-rich North Pacific com-ponent. Such an enrichment is analogous to the accumulation of remineralized nitrate
15
documented by the model of Toggweiler and Carson (1995), suggesting that there is a significant contribution of remineralized Si at the eastern margin of the equatorial Pacific subsurface, which may find its surface expression in the tongue of high surface [Si] (6–8 µM) extending westwards from the Peruvian coast (Garcia et al., 2010b).
Thus, the >100 % increase in [Si] (from 21 µM to 46 µM) at SAMW densities
20
(γn≈27.15 kg m−3) between 26◦S and 12◦S can be viewed as the combined result of lateral input of Si from the North Pacific, and the accumulation of remineralized Si within the shadow zone of the eastern equatorial Pacific. A simple isotope mass bal-ance calculation indicates that to explain the observed decrease inδ30Si values at the density level of SAMW (from+1.76 ‰ to+1.38 ‰) between 26◦S and 12◦S, these two
25
BGD
9, 6409–6443, 2012Silicon isotopes in the eastern South
Pacific
G. F. de Souza et al.
Title Page
Abstract Introduction
Conclusions References
Tables Figures
◭ ◮
◭ ◮
Back Close
Full Screen / Esc
Printer-friendly Version Interactive Discussion
Discussion
P
a
per
|
Dis
cussion
P
a
per
|
Discussion
P
a
per
|
Discussio
n
P
a
per
|
γn=27.15 kg m−3surface (600 m and 900 m), indicating that the input of North Pacific Si would be expected to lowerδ30Si values in the mesopelagic equatorial Pacific. The dissolution of opal produced in the Peruvian coastal upwelling may also add Si with a low δ30Si value to subsurface waters, by a mechanism analogous to that we have seen at work in another upwelling region, the Southern Ocean. In the Peruvian
up-5
welling, Si utilization is below 100 %, as documented by elevated [Si] at the surface (Garcia et al., 2010b). As a result, opal exported from the surface will tend to add a low
δ30Si value to the subsurface when it dissolves. Thus, subsurface waters may accu-mulate a pool of Si with lowerδ30Si values during their long residence in the shadow zone of the equatorial Pacific.
10
The observed differences in theδ30Si distribution in the mesopelagic subtropical and equatorial Pacific are thus due to the fact that (a) the equatorial Pacific is one of the few ocean regions where the mesopelagic Si inventory is not dominantly supplied by wa-ters of Southern Ocean origin (Dugdale et al., 2002; Sarmiento et al., 2004) and/or that (b) the remineralized component of Si appears to be higher in the southeast equatorial
15
region, associated with the Peruvian coastal upwelling. In other words, the subsurface
δ30Si distribution traces the cycling of Si within the upper ocean, but records the combi-nation of a preformed signal and a remineralized signal that is integrated over the entire circulation history of the water mass in which the dissolved Si pool is transported, and must be interpreted as such. Although the conflation of source and cycling signals in
20
the equatorial Pacific means that the effect of dissolution cannot be robustly separated from the signal of Si addition from the North Pacific, it appears that the sluggish circula-tion of the eastern equatorial Pacific, which contains some of the most poorly-ventilated waters of the global ocean (Karstensen et al., 2008; Garcia et al., 2010a), allows such a remineralization signal to be recorded, whilst within well-ventilated subtropical
wa-25
ters, theδ30Si signal is dominated by the preformed component of Si introduced into the interior by SAMW/AAIW.
BGD
9, 6409–6443, 2012Silicon isotopes in the eastern South
Pacific
G. F. de Souza et al.
Title Page
Abstract Introduction
Conclusions References
Tables Figures
◭ ◮
◭ ◮
Back Close
Full Screen / Esc
Printer-friendly Version Interactive Discussion
Discussion
P
a
per
|
Dis
cussion
P
a
per
|
Discussion
P
a
per
|
Discussio
n
P
a
per
|
subtropical station exhibits an isopycnal Si-enrichment aroundγn=26.75 kg m−3that is associated with the southward spreading of O2-poor equatorial waters into the
subtrop-ics (Sect. 3 and Supplement). Theδ30Si distribution appears to reflect this interleaving of subtropical and tropical waters (Figs. 3 and 5a): a tongue of high “subtropical”δ30Si values extends below the southward-spreading O2minimum, which exhibits low “equa-5
torial”δ30Si values that are essentially identical to those observed in the Peru–Chile Undercurrent (Ehlert et al., 2012), a potential conduit of equatorial waters into the sub-tropics (Sect. 3). This pattern provides further evidence of the strong isopycnal control onδ30Si values in the oceanic thermocline.
5.3 Evidence for widespread deepδ30Si uniformity
10
In contrast to the rich structure observed in the upper ocean, the deep waters analyzed in this study exhibit remarkable homogeneity inδ30Si values. In the Southern Ocean,
δ30Si values average +1.25±0.05 ‰ (2σSD) over the entire deep water column. This
value is indistinguishable from three other geographically widespread observations of deep Southern Oceanδ30Si: values of +1.21±0.06 ‰ in CDW from Drake Passage
15
(de Souza et al., 2012), +1.22±0.12 ‰ in the deep Southern Ocean south of
Aus-tralia (∼140◦E; Cardinal et al., 2005), and+1.26±0.13 ‰ that we observe in Southern
Ocean deep waters in the Indo-Atlantic sector at 30◦E (Supplementary Table 1). Frip-iat et al. (2011a) have recently suggested, on the basis of their and Cardinal et al.’s (2005) data (Fig. S7), that CDWδ30Si values decrease by ∼0.2 ‰ from the Atlantic
20
to the Australian sectors of the Southern Ocean. They suggested that a higherδ30Si value in the Atlantic sector may result from the influence of NADW, which transports Si with a highδ30Si value (de Souza et al., 2012). Such an influence would be surprising, given the low Si mass flux associated with NADW – mixing calculations indicate that the influence of freshly-ventilated NADW on CDWδ30Si values should be restricted to
25
BGD
9, 6409–6443, 2012Silicon isotopes in the eastern South
Pacific
G. F. de Souza et al.
Title Page
Abstract Introduction
Conclusions References
Tables Figures
◭ ◮
◭ ◮
Back Close
Full Screen / Esc
Printer-friendly Version Interactive Discussion
Discussion
P
a
per
|
Dis
cussion
P
a
per
|
Discussion
P
a
per
|
Discussio
n
P
a
per
|
the absence of any significant influence on deep water δ30Si values there (Supple-mentary Table 1). In fact, most observations of δ30Si in the deep Southern Ocean, including this study’s data from Southern Ocean sectors as far from each other as the Indo-Atlantic and the Eastern Pacific, indicate that theδ30Si value of Circumpolar Deep Water is zonally homogeneous at the sub-0.1 ‰ level (Fig. S7).
5
Additionally, the statistical tests detailed in Sect. 4 indicate that significance cannot be attributed to the small nominalδ30Si variations observed further north in the deep South Pacific. Our deep Pacific data document a high degree ofδ30Si homogeneity (Fig. 5c), with no significant δ30Si differences for deep waters with γn>27.7 kg m−3, whilstδ30Si values in lighter waters begin to increase (Fig. 5a). Importantly, this
ho-10
mogeneity extends to deep waters from the northern Bauer Basin (12◦S) where other water properties document a North Pacific origin. Although uncertainties regarding the deep North Pacific δ30Si distribution (discussed in Sect. 5.4) make firm conclusions difficult, we would argue that this marked constancy may reflect a fundamental prop-erty of the oceanicδ30Si distribution. The density level below which no significantδ30Si
15
variation occurs corresponds closely to the density that separates the upper and lower cells of the overturning circulation in the inverse model of Lumpkin and Speer (2007,
γn=27.6 kg m−3). This separation reflects the fact that the predominant source of deep waters to the Pacific is CDW from the deep Southern Ocean, the lower limb of the MOC (Johnson, 2008). If theδ30Si values of these deep waters remain constant over their
20
multicentennial sojourn in the deep Pacific (Matsumoto, 2007), the implication is that the accumulation of Si from the dissolution of sinking diatom opal produces no signifi-cantδ30Si signal in the deep Pacific Ocean. This would, in turn, indicate that the pro-duction of significant deep waterδ30Si variation requires the presence of aδ30Si signal in the preformed component, analogous to the case for both SAMW/AAIW (Sect. 5.1)
25
BGD
9, 6409–6443, 2012Silicon isotopes in the eastern South
Pacific
G. F. de Souza et al.
Title Page
Abstract Introduction
Conclusions References
Tables Figures
◭ ◮
◭ ◮
Back Close
Full Screen / Esc
Printer-friendly Version Interactive Discussion
Discussion
P
a
per
|
Dis
cussion
P
a
per
|
Discussion
P
a
per
|
Discussio
n
P
a
per
|
5.4 The deep Pacificδ30Si conundrum
A wide range ofδ30Si values have been reported from the deep North Pacific Ocean. De La Rocha et al. (2000) and Reynolds et al. (2006) have reported low δ30Si val-ues of around +0.8 ‰ in deep waters of the Northwestern Pacific (24◦–45◦N, 150◦– 170◦W), whilst Beucher et al. (2008) observed values as high as +1.63 ‰ in the
ex-5
tremely Si-rich (∼200 µM) waters of the Cascadia Basin in the Northeastern Pacific. Both De La Rocha et al. (2000) and Reynolds et al. (2006) interpreted their results as documenting the dissolution of low-δ30Si opal in the deep ocean, whilst Beucher et al. (2008) conversely inferred that the highδ30Si values they observed result from the dissolution of opal with ahigher δ30Si value than Pacific deep waters. These
mu-10
tually contradictory conclusions highlight the ambiguity of the extantδ30Si data, and also contrast with our inference of essentially invariantδ30Si values in the deep Pacific (Sect. 5.3).
Further uncertainty exists regarding the variability or constancy of deep Pacificδ30Si values at lower latitudes. Beucher et al. (2008) observed a δ30Si value of +1.32±
15
0.11 ‰ (n=6) in the equatorial Pacific (1◦N–3◦S, 110◦W), very similar to the average deep South Pacific δ30Si value of +1.30±0.08 ‰ reported here. However, Beucher
et al. (2008) attributed significance to the fact that the δ30Si value they observed is nominally higher than that reported for CDW by De La Rocha et al. (2000, +1.1±
0.2 ‰) and Cardinal et al. (2005, +1.22±0.12 ‰). They inferred that this difference
20
results from mixing between CDW and high-δ30Si waters of the deep Si plume that emanates from the Northeastern Pacific (e.g., Talley and Joyce, 1992). However, such an inference is not upheld by the isotope systematics of a compilation of equatorial and Southern Pacific deep water data (this study; Beucher et al., 2008, 2011). In a mixing diagram (Fig. 8), these data do not display any systematic δ30Si variability such as
25
BGD
9, 6409–6443, 2012Silicon isotopes in the eastern South
Pacific
G. F. de Souza et al.
Title Page
Abstract Introduction
Conclusions References
Tables Figures
◭ ◮
◭ ◮
Back Close
Full Screen / Esc
Printer-friendly Version Interactive Discussion
Discussion
P
a
per
|
Dis
cussion
P
a
per
|
Discussion
P
a
per
|
Discussio
n
P
a
per
|
Pacific waters on the low-latitude open Pacificδ30Si distribution postulated by Beucher et al. (2008) thus remains questionable.
The clarity of the situation is not improved by the fact that the pioneering data of De La Rocha et al. (2000) show some surprising features, such as mid-depth δ30Si variations of as much as 0.5 ‰ at a single North Pacific station, as well as values as
5
low as +0.8 ‰ at 300 m water depth at 24◦N. Considering the range of subsurface seawaterδ30Si variation documented by the literature published since that first study (Cardinal et al., 2005; Reynolds et al., 2006; Beucher et al., 2008, 2011; Cavagna et al., 2011; Fripiat et al., 2011a,b; de Souza et al., 2012, and this study), these features appear anomalous, and cast some doubt on the accuracy of De La Rocha et al.’s (2000)
10
data, thus adding a further layer of uncertainty to the deep Pacificδ30Si distribution. Clearly, there are numerous questions regarding the deep Pacificδ30Si distribution that remain unanswered. Tackling them will require a systematic regional-scale North Pacificδ30Si survey that encompasses the Northeastern Pacific deep Si plume. In the absence of this, a conclusive characterization of the deep Pacific δ30Si distribution
15
remains out of reach. This is unfortunate, since a good handle on the Pacific δ30Si distribution is needed to draw robust conclusions regarding the controls on the global-scaleδ30Si distribution, and the oceanic Si cycle that it reflects. Nonetheless, our own data document lowδ30Si variability at densities associated with the lower cell of the MOC, including high-[Si] waters returning from the North Pacific Ocean. This constancy
20
suggests that theδ30Si values of deep waters are not strongly altered by opal disso-lution along their deep circulation path; i.e. that large variations in deep water δ30Si signatures require the introduction of a preformedδ30Si signal. This would mean that the ultimate cause of most subsurface seawaterδ30Si variability in the global ocean is the fractionation of Si isotopes between the upper and lower limbs of the MOC in
25
BGD
9, 6409–6443, 2012Silicon isotopes in the eastern South
Pacific
G. F. de Souza et al.
Title Page
Abstract Introduction
Conclusions References
Tables Figures
◭ ◮
◭ ◮
Back Close
Full Screen / Esc
Printer-friendly Version Interactive Discussion
Discussion
P
a
per
|
Dis
cussion
P
a
per
|
Discussion
P
a
per
|
Discussio
n
P
a
per
|
6 Summary and conclusions
This study presents the first δ30Si data from the eastern South Pacific and the Pa-cific sector of the Southern Ocean, a region that plays an important role in the venti-lation of the mid- and low-latitude thermocline. Our analysis traces the incorporation of highδ30Si values into AAIW and SAMW, and their export to the base of the
sub-5
tropical thermocline, as previously inferred (de Souza et al., 2012). Within the sub-tropical ocean interior, theδ30Si distribution documents the dominant influence of the spreading of AAIW and SAMW in determining the mesopelagicδ30Si distribution, trac-ing the important contribution of the preformed component to the Si inventory of the well-ventilated eastern South Pacific. The data also reveal that the high δ30Si
signa-10
ture of SAMW/AAIW is not conserved in the equatorial Pacific Ocean. This marked change in the lower thermocline and intermediateδ30Si distribution appears to record two phenomena: a switch in the dominant source of Si from the Southern Ocean to the North Pacific (Dugdale et al., 2002; Sarmiento et al., 2004), and the accumulation of remineralized Si in the shadow zone of the eastern equatorial Pacific. The clear diff
er-15
ence between the mesopelagicδ30Si distribution in these two regions demonstrates that seawaterδ30Si values trace Si cycling and transport within the ocean, and that the signal they record must be interpreted in the context of water mass history.
The low variability of δ30Si values in deep South Pacific waters denser than γn=
27.7 kg m−3, which circulate within the lower limb of the meridional overturning
circula-20
tion (Lumpkin and Speer, 2007), suggests that the dissolution of opal plays a negligible role in altering deep waterδ30Si values. However, the certainty of this conclusion is undermined by uncertainties that still exist regarding the deep Pacific δ30Si distribu-tion, especially in the North Pacific. A detailed study of the meridional and/or zonal
δ30Si distribution in the North Pacific, including its high-Si plume, is needed before this
25
BGD
9, 6409–6443, 2012Silicon isotopes in the eastern South
Pacific
G. F. de Souza et al.
Title Page
Abstract Introduction
Conclusions References
Tables Figures
◭ ◮
◭ ◮
Back Close
Full Screen / Esc
Printer-friendly Version Interactive Discussion
Discussion
P
a
per
|
Dis
cussion
P
a
per
|
Discussion
P
a
per
|
Discussio
n
P
a
per
|
Supplementary material related to this article is available online at: http://www.biogeosciences-discuss.net/9/6409/2012/
bgd-9-6409-2012-supplement.zip.
Acknowledgements. William Landing is gratefully acknowledged for collecting samples for δ30Si analysis from the CLIVAR I06S re-occupation. Cruises 33RO20071215 and 5
33RR20080204 were undertaken as part of the US Repeat Hydrography Program funded by NSF/NOAA; the authors wish to thank the captains and crews of R/VsRonald H. Brown
and Roger Revelle as well as K. Speer as Chief Scientist on cruise 33RR20080204. Bot-tle data were accessed from datafiles p18 33RO20071215 hy1.csv (dated 20111215) and i06s 33RR20080204 hy1.csv (dated 20110904), CLIVAR and Carbon Hydrographic Data Of-10
fice, La Jolla, CA, USA; the contributions of Molly Baringer, Calvin Mordy, Jia-Zhong Zhang, Chris Langdon, and Mark Warner toward producing these data are acknowledged. This study was supported by Swiss National Science Foundation grants 200021-116473 and 200020-130361.
References
15
Antonov, J. I., Seidov, D., Boyer, T. P., Locarnini, R. A., Mishonov, A., and Garcia, H. E.: World Ocean Atlas 2009, vol. 2, Salinity, NOAA Atlas NESDIS 69, US Government Printing Office, Washington DC, 2010. 6419
Aoki, S., Hariyama, M., Mitsudera, H., Sasaki, H., and Sasai, Y.: Formation regions of Sub-antarctic Mode Water detected by OFES and Argo profiling floats, Geophys. Res. Lett., 34, 20
L10606, doi:10.1029/2007gl029828, 2007. 6411
Beucher, C. P., Brzezinski, M. A., and Jones, J. L.: Sources and biological fractionation of Silicon isotopes in the Eastern Equatorial Pacific, Geochim. Cosmochim. Ac., 72, 3063–3073, 2008. 6411, 6426, 6427, 6443
Beucher, C. P., Brzezinski, M. A., and Jones, J. L.: Mechanisms controlling silicon isotope dis-25
BGD
9, 6409–6443, 2012Silicon isotopes in the eastern South
Pacific
G. F. de Souza et al.
Title Page
Abstract Introduction
Conclusions References
Tables Figures
◭ ◮
◭ ◮
Back Close
Full Screen / Esc
Printer-friendly Version Interactive Discussion
Discussion
P
a
per
|
Dis
cussion
P
a
per
|
Discussion
P
a
per
|
Discussio
n
P
a
per
|
Blanco, J. L., Thomas, A. C., Carr, M.-E., and Strub, P. T.: Seasonal climatology of hydrographic conditions in the upwelling region of Northern Chile, J. Geophys. Res.-Oceans, 106, 11451– 11467, 2001. 6415
Brzezinski, M. A., Jones, J. L., Beucher, C. P., Demarest, M. S., and Berg, H. L.: Automated determination of silicon isotope natural abundance by the acid decomposition of cesium 5
hexafluosilicate, Anal. Chem., 78, 6109–6114, 2006. 6413
Brzezinski, M. A., Dumousseaud, C., Krause, J. W., Measures, C. I., and Nelson, D. M.: Iron and silicic acid concentrations together regulate Si uptake in the equatorial Pacific Ocean, Limnol. Oceanogr., 53, 875–889, 2008. 6411
Buesseler, K. O.: The decoupling of production and particulate export in the surface ocean, 10
Global Biogeochem. Cy., 12, 297–310, 1998. 6411
Cardinal, D., Alleman, L. Y., Dehairs, F., Savoye, N., Trull, T. W., and Andre, L.: Relevance of silicon isotopes to Si-nutrient utilization and Si-source assessment in Antarctic waters, Global Biogeochem. Cy., 19, GB2007, doi:10.1029/2004GB002364, 2005. 6411, 6424, 6426, 6427 Cavagna, A.-J., Fripiat, F., Dehairs, F., Wolf-Gladrow, D. A., Cisewski, B., Savoye, N., Andr ´e, L., 15
and Cardinal, D.: Silicon uptake and supply during a Southern Ocean iron fertilization exper-iment (EIFEX) tracked by Si isotopes, Limnol. Oceanogr., 56, 147–160, 2011. 6427
De La Rocha, C. L., Brzezinski, M. A., and DeNiro, M. J.: Fractionation of silicon isotopes by marine diatoms during biogenic silica formation, Geochim. Cosmochim. Ac., 61, 5051–5056, 1997. 6411
20
De La Rocha, C. L., Brzezinski, M. A., and DeNiro, M. J.: A first look at the distribution of the stable isotopes of silicon in natural waters, Geochim. Cosmochim. Ac., 64, 2467–2477, 2000. 6426, 6427
de Souza, G. F., Reynolds, B. C., Rickli, J., Frank, M., Saito, M., Gerringa, L. J. A., and Bour-don, B.: Southern Ocean control of silicon stable isotope distribution in the deep Atlantic 25
Ocean, Global Biogeochem. Cy., in press, doi:10.1029/2011GB004141, 2012. 6412, 6413, 6424, 6425, 6426, 6427, 6428, 6438
Dong, S., Sprintall, J., Gille, S. T., and Talley, L.: Southern Ocean mixed-layer depth from Argo float profiles, J. Geophys. Res.-Oceans, 113, C06013, doi:10.1029/2006jc004051, 2008. 6418
30
BGD
9, 6409–6443, 2012Silicon isotopes in the eastern South
Pacific
G. F. de Souza et al.
Title Page
Abstract Introduction
Conclusions References
Tables Figures
◭ ◮
◭ ◮
Back Close
Full Screen / Esc
Printer-friendly Version Interactive Discussion
Discussion
P
a
per
|
Dis
cussion
P
a
per
|
Discussion
P
a
per
|
Discussio
n
P
a
per
|
ecosystem and its potential impact on ocean-atmosphere CO2 flux; a data and modeling approach, Deep-Sea Res. Pt. II, 49, 2513–2531, 2002. 6411, 6422, 6423, 6428
Ehlert, C., Grasse, P., Mollier-Vogel, E., B ¨oschen, T., Franz, J., de Souza, G. F., Reynolds, B. C., Stramma, L., and Frank, M.: Silicon isotope distribution in waters and surface sediments of the Peruvian coastal upwelling, Geochim. Cosmochim. Ac., in review, 2012. 6424
5
Fine, R. A., Maillet, K. A., Sullivan, K. F., and Willey, D.: Circulation and ventilation flux of the Pacific Ocean, J. Geophys. Res.-Oceans, 106, 22159–22178, 2001. 6411, 6420
Fripiat, F., Cavagna, A.-J., Dehairs, F., Speich, S., Andr ´e, L., and Cardinal, D.: Silicon pool dynamics and biogenic silica export in the Southern Ocean inferred from Si-isotopes, Ocean Sci., 7, 533–547, doi:10.5194/os-7-533-2011, 2011a. 6411, 6418, 6419, 6424, 6427 10
Fripiat, F., Cavagna, A.-J., Savoye, N., Dehairs, F., Andr ´e, L., and Cardinal, D.: Isotopic con-straints on the Si-biogeochemical cycle of the Antarctic Zone in the Kerguelen area (KEOPS), Mar. Chem., 123, 11–22, 2011b. 6427
Garcia, H. E., Locarnini, R. A., Boyer, T. P., and Antonov, J. I.: World Ocean Atlas 2009, vol. 3, Dissolved Oxygen, Apparant Oxygen Utilization, and Oxygen Saturation, NOAA Atlas NES-15
DIS 70, US Government Printing Office, Washington DC, 2010a. 6423
Garcia, H. E., Locarnini, R. A., Boyer, T. P., and Antonov, J. I.: World Ocean Atlas 2009, vol. 4, Nutrients (phosphate, nitrate, silicate), NOAA Atlas NESDIS 71, US Government Printing Office, Washington DC, 2010b. 6422, 6423
Georg, R., Reynolds, B., Frank, M., and Halliday, A.: New sample preparation techniques for 20
the determination of Si isotopic compositions using MC-ICPMS, Chem. Geol., 235, 95–104, 2006. 6413
Gruber, N., Gloor, M., Mikaloff Fletcher, S. E., Doney, S. C., Dutkiewicz, S., Follows, M. J., Gerber, M., Jacobson, A. R., Joos, F., Lindsay, K., Menemenlis, D., Mouchet, A., M ¨uller, S. A., Sarmiento, J. L., and Takahashi, T.: Oceanic sources, sinks, and transport of atmospheric 25
CO2, Global Biogeochem. Cy., 23, GB1005, doi:10.1029/2008gb003349, 2009. 6411 Hanawa, K. and Talley, L. D.: Mode waters, in: Ocean Circulation and Climate – Observing and
Modelling the Global Ocean, edited by: Siedler, G., Church, J. A., and Gould, J., vol. 77 of International Geophysics, Academic Press, San Diego, 373–386, 2001. 6411, 6415, 6419 Jackett, D. R. and McDougall, T. J.: A neutral density variable for the world’s oceans, J. Phys. 30
Oceanogr., 27, 237–263, 1997. 6414
BGD
9, 6409–6443, 2012Silicon isotopes in the eastern South
Pacific
G. F. de Souza et al.
Title Page
Abstract Introduction
Conclusions References
Tables Figures
◭ ◮
◭ ◮
Back Close
Full Screen / Esc
Printer-friendly Version Interactive Discussion
Discussion
P
a
per
|
Dis
cussion
P
a
per
|
Discussion
P
a
per
|
Discussio
n
P
a
per
|
Johnson, G. C. and McPhaden, M. J.: Interior pycnocline flow from the subtropical to the equa-torial Pacific Ocean, J. Phys. Oceanogr., 29, 3073–3089, 1999. 6415
Johnson, G. C. and McTaggart, K. E.: Equatorial Pacific 13◦
C Water eddies in the eastern subtropical South Pacific Ocean, J. Phys. Oceanogr., 40, 226–236, 2010. 6416
Karstensen, J. and Quadfasel, D.: Formation of southern hemisphere thermocline waters: water 5
mass conversion and subduction, J. Phys. Oceanogr., 32, 3020–3038, 2002. 6419
Karstensen, J., Stramma, L., and Visbeck, M.: Oxygen minimum zones in the eastern tropical Atlantic and Pacific oceans, Prog. Oceanogr., 77, 331–350, 2008. 6411, 6421, 6423
Locarnini, R. A., Mishonov, A., Antonov, J. I., Boyer, T. P., and Garcia, H. E.: World Ocean Atlas 2009, vol. 1, Temperature, NOAA Atlas NESDIS 68, US Government Printing Office, 10
Washington DC, 2010. 6419
Lumpkin, R. and Speer, K.: Global ocean meridional overturning, J. Phys. Oceanogr., 37, 2550– 2562, 2007. 6411, 6425, 6428
Matsumoto, K.: Radiocarbon-based circulation age of the world oceans, J. Geophys. Res.-Oceans, 112, C09004, doi:10.1029/2007JC004095, 2007. 6425
15
McCartney, M. S.: Subantarctic mode water, in: A Voyage of Discovery, Supplement to Deep-Sea Research vol. 24, edited by: Angel, M., Pergamon Press, Oxford, 103–119, 1977. 6419 McCartney, M. S.: The subtropical recirculation of Mode Waters, J. Mar. Res., 40 (Suppl.),
427–464, 1982. 6411
Milligan, A. J., Varela, D. E., Brzezinski, M. A., and Morel, F. M. M.: Dynamics of silicon 20
metabolism and silicon isotopic discrimination in a marine diatom as a function of pCO2, Limnol. Oceanogr., 49, 322–329, 2004. 6411
O’Connor, B. M., Fine, R. A., Maillet, K. A., and Olson, D. B.: Formation rates of subtropical underwater in the Pacific Ocean, Deep-Sea Res. Pt. I, 49, 1571–1590, 2002. 6415
Orsi, A. H., Whitworth, T., and Nowlin, W. D.: On the meridional extent and fronts of the Antarctic 25
Circumpolar Current, Deep-Sea Res. Pt. I, 42, 641–673, 1995. 6436
Palter, J. B., Sarmiento, J. L., Gnanadesikan, A., Simeon, J., and Slater, R. D.: Fueling ex-port production: nutrient return pathways from the deep ocean and their dependence on the Meridional Overturning Circulation, Biogeosciences, 7, 3549–3568, doi:10.5194/bg-7-3549-2010, 2010. 6411
30
BGD
9, 6409–6443, 2012Silicon isotopes in the eastern South
Pacific
G. F. de Souza et al.
Title Page
Abstract Introduction
Conclusions References
Tables Figures
◭ ◮
◭ ◮
Back Close
Full Screen / Esc
Printer-friendly Version Interactive Discussion
Discussion
P
a
per
|
Dis
cussion
P
a
per
|
Discussion
P
a
per
|
Discussio
n
P
a
per
|
Reid, J. L.: On the total geostrophic circulation of the Pacific Ocean: flow patterns, tracers, and transports, Prog. Oceanogr., 39, 263–352, 1997. 6414
Reynolds, B. C., Frank, M., and Halliday, A. N.: Silicon isotope fractionation during nutrient utilization in the North Pacific, Earth Planet. Sc. Lett., 244, 431–443, 2006. 6413, 6422, 6426, 6427
5
Reynolds, B. C., Aggarwal, J., Andr ´e, L., Baxter, D., Beucher, C., Brzezinski, M. A., En-gstr ¨om, E., Georg, R. B., Land, M., Leng, M. J., Opfergelt, S., Rodushkin, I., Sloane, H. J., van den Boorn, S. H. J. M., Vroon, P. Z., and Cardinal, D.: An inter-laboratory comparison of Si isotope reference materials, J. Anal. Atom. Spectrom., 22, 561–568, 2007. 6413, 6443 Sall ´ee, J.-B., Speer, K., Rintoul, S., and Wijffels, S.: Southern Ocean thermocline ventilation, J. 10
Phys. Oceanogr., 40, 509–529, 2010. 6411, 6419
Sarmiento, J. L., Gruber, N., Brzezinski, M. A., and Dunne, J. P.: High-latitude controls of ther-mocline nutrients and low latitude biological productivity, Nature, 427, 56–60, 2004. 6411, 6417, 6420, 6422, 6423, 6428
Schlitzer, R.: Electronic atlas of WOCE hydrographic and tracer data now available, EOS T. Am. 15
Geophys. Un., 81, 45, doi:10.1029/00EO00028, 2000. 6442
Schlitzer, R.: Ocean Data View, available at: http://odv.awi.de, 2009. 6442
Schmitz, W. J.: The Pacific and Indian Oceans/A Global Update, Technical report, Woods Hole Oceanographic Institution, Woods Hole, Massachusetts 02543, USA, 1996. 6414
Sloyan, B. M. and Rintoul, S. R.: Circulation, renewal, and modification of Antarctic mode and 20
intermediate water, J. Phys. Oceanogr., 31, 1005–1030, 2001. 6411
Sloyan, B. M., Talley, L. D., Chereskin, T. K., Fine, R., and Holte, J.: Antarctic intermediate water and subantarctic mode water formation in the Southeast Pacific: the role of turbulent mixing, J. Phys. Oceanogr., 40, 1558–1574, 2010. 6415
Stommel, H.: Determination of water mass properties of water pumped down from the Ekman 25
layer to the geostrophic flow below, P. Natl. Acad. Sci. USA, 76, 3051–3055, 1979. 6420 Talley, L. D. and Joyce, T. M.: The double silica maximum in the North Pacific, J. Geophys.
Res.-Oceans, 97, 5465–5480, 1992. 6426
Toggweiler, J. R. and Carson, S.: What are upwelling systems contributing to the ocean’s carbon and nutrient budgets?, in: Upwelling in the Ocean: Modern Processes and Ancient Records, 30
BGD
9, 6409–6443, 2012Silicon isotopes in the eastern South
Pacific
G. F. de Souza et al.
Title Page
Abstract Introduction
Conclusions References
Tables Figures
◭ ◮
◭ ◮
Back Close
Full Screen / Esc
Printer-friendly Version Interactive Discussion
Discussion
P
a
per
|
Dis
cussion
P
a
per
|
Discussion
P
a
per
|
Discussio
n
P
a
per
|
Toggweiler, J. R., Dixon, K., and Broecker, W. S.: The Peru upwelling and the ventilation of the South Pacific thermocline, J. Geophys. Res.-Oceans, 96, 20467–20497, 1991. 6411, 6422 Tsuchiya, M.: Flow path of Antarctic Intermediate Water in the western equatorial South Pacific
Ocean, Deep-Sea Res., 38, S273–S279, 1991. 6415, 6421
Tsuchiya, M. and Talley, L.: Water-property distributions along an Eastern Pacific hydrographic 5
section at 135 W, J. Mar. Res., 54, 541–564, 1996. 6415, 6421
Tsuchiya, M. and Talley, L. D.: A Pacific hydrographic section at 88◦W: water-property distribu-tion, J. Geophys. Res.-Oceans, 103, 12899–12918, 1998. 6414, 6415, 6417
Tsuchiya, M., Lukas, R., Fine, R. A., Firing, E., and Lindstrom, E.: Source waters of the Pacific Equatorial Undercurrent, Prog. Oceanogr., 23, 101–147, 1989. 6411, 6422
10
Varela, D. E., Pride, C. J., and Brzezinski, M. A.: Biological fractionation of silicon isotopes in Southern Ocean surface waters, Global Biogeochem. Cy., 18, GB1047, doi:10.1029/2003GB002140, 2004. 6411, 6418
Warren, B. A.: Transpacific hydrographic sections at Lats. 43◦
S and 28◦
S: the SCORPIO ex-pedition – II. Deep water, Deep Sea Res. Ocean., 20, 9–38, 1973. 6414, 6443
15

![Fig. 2. South Pacific (a) salinity, (b) oxygen and (c) [Si] distributions along line P18 from expe- expe-dition 33RO20071215](https://thumb-eu.123doks.com/thumbv2/123dok_br/18249471.342120/29.918.182.526.64.494/fig-south-pacific-salinity-oxygen-distributions-line-dition.webp)
![Fig. 3. Depth profiles of δ 30 Si overlain on color maps of (a) salinity and (b) Si ∗ = [Si] − [NO 3 ].](https://thumb-eu.123doks.com/thumbv2/123dok_br/18249471.342120/30.918.96.620.57.494/fig-depth-profiles-si-overlain-color-maps-salinity.webp)
![Fig. 5. Profiles of δ 30 Si values (a and c) and [Si] (b and d) versus neutral density (γ n ) over the entire sampled water column (upper panels) and below γ n = 27.7 kg m −3](https://thumb-eu.123doks.com/thumbv2/123dok_br/18249471.342120/32.918.147.564.33.512/profiles-values-versus-neutral-density-sampled-column-panels.webp)
![Fig. 6. A mixing diagram of δ 30 Si versus 1/[Si] for samples in the near-surface polar ocean.](https://thumb-eu.123doks.com/thumbv2/123dok_br/18249471.342120/33.918.99.606.77.440/fig-mixing-diagram-versus-samples-surface-polar-ocean.webp)
![Fig. 8. A mixing diagram of δ 30 Si versus 1/[Si] showing deep waters from the Pacific sector of the Southern Ocean to the Cascadia Basin in the North Pacific (47 ◦ N)](https://thumb-eu.123doks.com/thumbv2/123dok_br/18249471.342120/35.918.100.607.56.435/diagram-showing-pacific-southern-ocean-cascadia-north-pacific.webp)
