Estimation of Flow Resistance Due to Embankments and Spur
Dikes during Floods
SHAHID ALI*, USMAN GHANI**, AND SABAHAT ARIF***
RECEIVED ON 24.11.2012 ACCEPTED ON 20.03.2013
ABSTRACT
Flow resistance is a key factor in predicting the river conveyance capacity and associated water levels. In addition to bed resistance, the obstacles (embankments, spur dikes etc.) in the flood plain of a river contribute to the flow resistance. In particular the elevated parts are expected to play an important role. The objective of this study is to develop and parameterize an analytical model for the form drag due to such obstacles. An experimental study was carried out for validation purposes of the developed analytical model. The prototype weir-like structure (in the form of an embankment) was modeled as a weir with various leeside slopes. Measurements for energy head losses were carried out for a range of discharges and downstream water levels covering submerged flow conditions. The energy head loss due to submerged dikes was modeled as an expansion loss form drag. The analytical form drag model was estimated using a one-dimensional momentum conservation equation which accounts for the energy loss associated with a deceleration of the flow in the leeside region of the sudden expansion. The predicted losses from the analytical model agreed well with the experimental results. The minor deviations observed could be attributed to downstream slope effects and non- uniform velocity distribution in expansion zone (recirculation region) of an embankment.
Key Words: Embankment, Error Analysis, Expansion Losses, Analytical Approach, Subcritical Flow.
* Senior Engineer, Atomic Energy Commission, Islamabad Pakistan.
* * Assistant Professor, Department of Civil Engineering, University of Engineering & Technology, Taxila.
*** Associate Professor, Department of Architecture Engineering & Design, University of Engineering & Technology, Lahore.
1.
INTRODUCTION
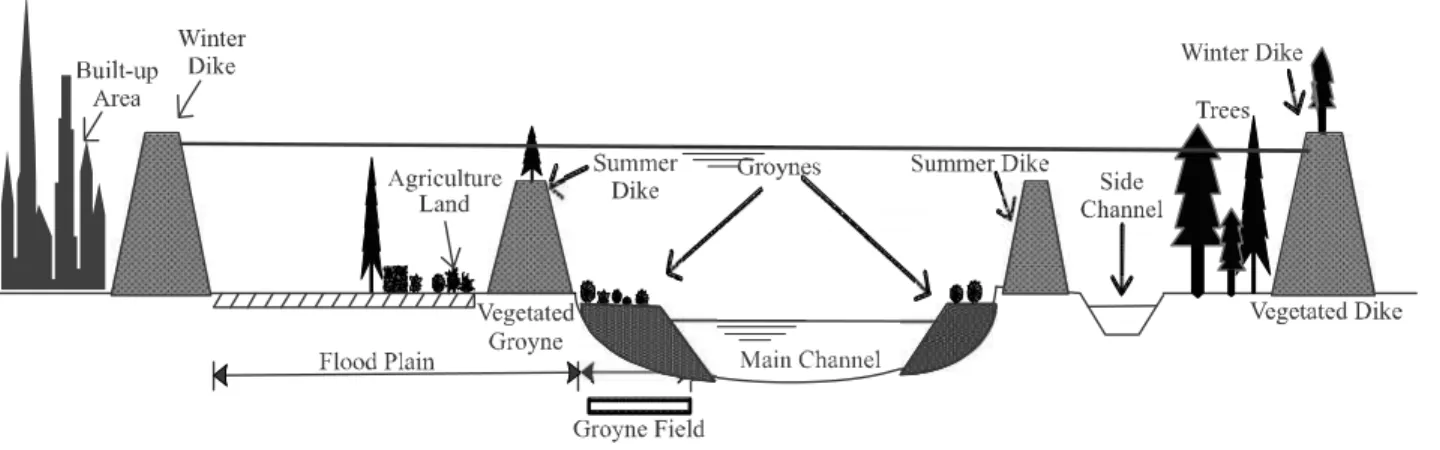
flow resistance in the groyne field is caused by a combination of bed roughness and the groynes. In the flood plain there are many features such as the dikes, approach roads, ditches (Fig. 1). These elevations are responsible for increased flood levels. Hydraulic resistance of these features is difficult to estimate. Computer models (1D and 2D flow models) often don't include such detailed
F
or a standard low land river reach at high waterfeatures and should therefore, be improved with respect to representation of dike resistance. These flood plain features (summer dike, access road and spur dikes) could be schematized as a weir or as a drag generating obstacle in the flow. Many researchers investigated the flow characteristics over the weir; Bazin [1] investigated embankment weirs with a side slope of 1V:2H. Horton [2] mainly compiled the discharge coefficients for all the available embankment geometries. Yarnell and Nagler [3] studied flow over railway and highway embankments. Fritz and Hager [4] investigated the flow characteristics of embankment-shaped dams with upstream and down stream slopes 1V:2H. The discharge coefficient is determined in terms of relative crest length for broad, short and thin crested weirs. Sargison and Percy [5] investigated the embankment broad crested weirs with varying upstream and downstream slopes (2H: 1V, 1H: 1V and vertical in various combinations). Azinfar and Kells [6] developed a relationship for the drag coefficient of rectangular type spur dikes. Yossef [7] considered a spur dike as a drag generating obstacle.
For a perfect weir, the discharge equation can be obtained from the energy conservation equation. However, to obtain the actual flow rate for imperfect flow conditions, a correction factor must be introduced to account for the
non-ideal conditions. This correction factor is an empirical factor and is determined on the basis of the experiments. The specific discharge of a weir for perfect flow conditions is governed by upstream energy head H0(m) while the specific discharge for an imperfect submerged weir depends upon downstream water level H2(m) which is downstream energy head. As the downstream water level is increased the submergence increases which affect the discharge coefficient of the weir. The discharge for an imperfect submerged condition is given by the following relations:
q = Cdqo (1)
or
0 3 2 0 3
2
H H df C d C
q= (2)
where Cd is a function of submergence (S)=H2/H0, q is the specific discharge for imperfect flow conditions (m3/sec) and q0 is specific discharge for perfect submerged flow conditions (m3/sec). C
d is submerged discharge coefficient
and Cdf is free flow discharge coefficient.
The discharge reduction coefficient (Cd) due to submergence for sharp crested weirs (as is the case of this
Estimation of Flow Resistance Due to Embankments and Spur Dikes during Floods
( ) (
⎣
research work) has been given through the empirical relationship by a number of researchers. For example, Villemonte [8] took it as Cd=1-S1.5)0.385. The more general
form for this relationship which is used in practice is:
( )
P S dC = 1−
where P is an empirically fit parameter which is influenced by the weir geometry.
Abou-Seida and Quarashi [9] defined the discharge reduction coefficient as:
(
S)
Sd
C = +
⎟
−⎠
⎞
⎜
⎝
⎛
12 1
1 .
Hager [10-11] defined the discharge reduction coefficient for the embankment weir as a function of submergence S.
The objective of this study is to estimate the form drag due to weir-like obstacles. For this purposes an analytical method has been developed and compared with the experimental data. This paper has been divided into the following sub-sections; Section 2 explains the procedure for calculation of energy head loss due to form drag using experimental data. The Section 3 explains the development of the analytical model. This analytical model which is an expansion loss form drag model has been derived based on a 1D momentum conservation equation to account for the energy loss caused by the decelerating flow downstream of a sudden expansion. The Section 4 covers the experimental work. The Section 5 is comprised of results and discussion. It contains experimental results (5.1 and 5.2) and comparison of experimental data with results predicted by the analytical model (5.3). A % age error analysis has also been performed between the analytical and experimental results (5.4).
2.
CALCULATION OF BED AND
WALL RESISTANCE FROM
EXPERIMENTAL DATA
The total energy head loss (∆H) over a distance L is given by the following formula:
∆H = SeL (3)
Where ∆H is total energy head loss (m), Se is the energy slope and L is the distance in meters. The measured total energy head loss in a flume can be due to the following three sources [12].
1. Head loss due to the weir-like obstacles (∆HF)
2. Head loss due to grain friction (∆HB)
3. Head loss due to side wall friction (∆HW)
Thus total energy head loss can be written as follows:
∆H = ∆HF + ∆HB + ∆HW (4)
where relationships for ∆HB and ∆HF are as follows [13]:
gd
Lu
c
H
B f2
=
Δ
(5)gW
Lu
c
H
W f2
2
=
Δ
(6)In the Equations (5-6), cf is the bed friction coefficient (for finished surface it is 0.002), g is the gravitational acceleration (9.8m/sec2), d is the water depth (m), u is the average velocity (m/sec), L is the length (m) between the flume sections 0 and 2 as shown in Fig. 2, and W is the flume width (m).
⎟
⎟
⎠
⎞
⎜
⎜
⎝
⎛
+ = f e R H D s k f 51 . 2 71 . 3 10 log 0 . 2 1 (7)Where f is the friction factor (dimensionless), Re is the Reynolds number, ks is the roughness height (m) and DH is the hydraulic diameter (m). The total energy head loss can be calculated by applying the energy balance between sections measured upstream and down stream of the vegetated weir. With a known total head loss, the energy head loss caused by the vegetated weir can thus be calculated as:
∆HF = ∆H - ∆HB - ∆HW
3.
DEVELOPMENT OF ANALYTICAL
APPROACH
The effect of a groyne on the flow can be considered as an additional energy loss or a drag force on the flow. The energy loss is determined by applying the one-dimensional momentum and energy conservation equations over the expansion region downstream of the obstacle. On the upstream side of the weir-like obstacles such as a spur dike, energy is assumed to be conserved however on the downstream side due to sudden expansion, energy conservation is not possible and energy loss due to a
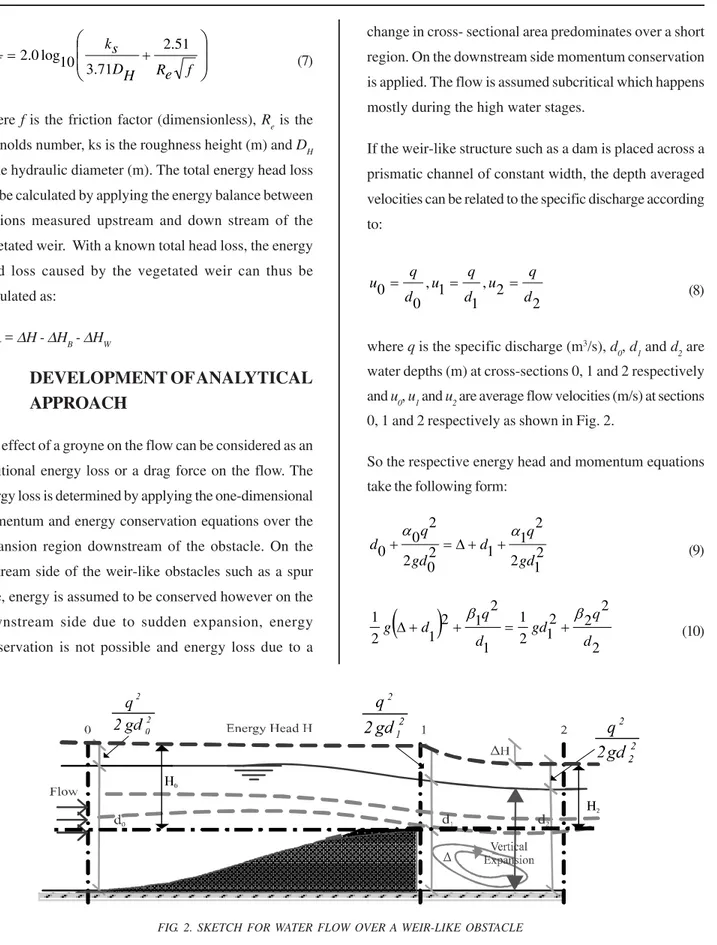
change in cross- sectional area predominates over a short region. On the downstream side momentum conservation is applied. The flow is assumed subcritical which happens mostly during the high water stages.
If the weir-like structure such as a dam is placed across a prismatic channel of constant width, the depth averaged velocities can be related to the specific discharge according to: 2 2 , 1 1 , 0 0 d q u d q u d q
u = = = (8)
where q is the specific discharge (m3/s), d
0, d1 and d2 are
water depths (m) at cross-sections 0, 1 and 2 respectively and u0, u1 and u2 are average flow velocities (m/s) at sections 0, 1 and 2 respectively as shown in Fig. 2.
So the respective energy head and momentum equations take the following form:
2 1 2 2 1 1 2 0 2 2 0 0 gd q d gd q d α α + + Δ = + (9)
( )
2 2 2 2 1 2 1 1 2 1 2 1 2 1 d q gd d q dg Δ+ + β = + β (10)
Estimation of Flow Resistance Due to Embankments and Spur Dikes during Floods
where ∆ is the height of the groyne crest (m), g is the gravitational acceleration and α's and β's are energy and momentum coefficients (dimensionless parameters at respective sections 0, 1 and 2) which correct for the fact
that the vertical profile of stream-wise velocity is not uniform over the respective cross sections [15-16]. For natural channels, the values of these parameters vary between 1.15-1.50 and 1.05-1.17 respectively and for regular
channels these vary from 1.10-1.20 and 1.03-1.04 respectively [17].
The upstream energy head can be predicted using the above formula (8 and 9), if the downstream water depth and specific discharge is known.
It is proposed here to write all lengths in dimensionless form using dcr1 (it is the critical water height above the weir crest as given by Equation (12) below). Defining the
Froude number as [18]:
1 1 1 1 1 gd d q gd u
Fr = = (11)
It gives the critical depth above the weir as:
3 2
1 g
q cr
d = (12)
The dimensionless energy conservation between sections 0 and 1 can now be written as:
2 * 1 2 1 * 1 * 2 * 0 2 0 * 0 d d d d α α + + Δ = + (13)
where * represents the dimensionless quantity.
This approach simplifies the equations and reveals that the dimensionless weir height ∆* is the only parameter in the problem.
The dimensionless momentum conservation between sections 1 and 2 can be written as:
(
)
* 2 2 2 2 * 2 * 1 1 2 2 * 1 * d d dd + β = + β
+
Δ (14)
In the above Equations (13-14), ∆*, d0*, d 1
* and d 2
* are
dimensionless weir height and flow depths at sections 0, 1 and 2 respectively.
The Carnot losses between section 1 and 2 can be written as:
⎟
⎟
⎠
⎞
⎜
⎜
⎝
⎛
− + + = + Δ + 2 1 2 1 2 2 2 2 2 2 1 2 2 * 1 d q d q g gd q d gd q d (15)and in dimensionless form as:
2 * 2 1 * 2 * 2 * 1 1 * * 1 d d d d
d +Δ + = +
(16)
Equation (16) shows that the standard Carnot loss formulation differs from the momentum conservation approach presented here as Carnot losses were derived for a closed pipe flow not accounting for the free surface.
has no effect anymore on the upstream part of the flow. In that case the energy loss is governed by bed friction and the possible occurrence of the hydraulic jump. The mean velocities can be retrieved from the specific discharges using the mass conservation and the local depth.
For an imperfect weir, the discharge coefficient depends on the downstream water head, it decreases as the downstream water depth increases and there is no explicit relation between discharge and water head in the case of the submerged flow and flow in the transition state. As described in Section 2, an empirical discharge reduction coefficient Cd is used for this purpose. The discharge reduction coefficient tends to a value of 1 as the energy head loss (for small values of H2/H0) disappears as shown in Fig. 3(a). The discharge coefficient also varies as the weir height changes; it increases with decreasing the weir height because the flow resistance decreases. Fig. 3(b) shows the energy head loss against Froude number on the weir crest. Obviously the energy head loss disappears when the Froude number goes to zero. For
Fr1=1 the head loss is not defined as the upstream water level has become independent from the downstream water level. The Carnot energy loss differs only slightly
from the new formulation. Though the Carnot losses are derived for a sudden expansion in a pipe flow and are not fully applicable to a free-surface flow, for small changes in water level it is a good approximation.
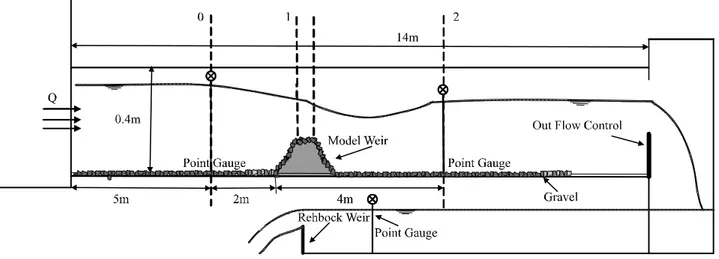
4. EXPERIMENTAL SETUP
An experimental study was carried out in the Environmental Fluid Mechanics Laboratory of Delft University of Technology, Netherlands. In order to perform the experiments that are representative for the processes on a prototype scale, requirements regarding Froude number and Reynolds number have to be fulfilled. To this end the prototype conditions were schematized and down scaled to approximately 1:50. Doing so, a Froude number scaling was achieved. The low Reynolds number is not considered a problem as long as the flow is fully turbulent. The Reynolds number is of the order of 104. Selected discharges for different setups ranged from 0.02 to 0.06 m3/sec, thus allowing for a wide range of flow conditions. A 14m long glass flume was used for the tests. The flume had a rectangular cross-section 0.4m wide and 0.4m deep and was kept horizontal (the bed slope was zero). In this flume a flow rate up to 80 liter/sec could be applied. To
0.86 0.88 0.9 0.92 0.94 0.96 0.98 1 0
0.2 0.4 0.6 0.8 1
H /H2 0
Cd
Δ*= 0.5
Δ*= 1
Δ*= 2
Villemonte p= 40, *= 2Δ
0 0.2 0.4 0.6 0.8 1 1.2 1.4
0.86 0.88 0.9 0.92 0.94 0.96 0.98 1
Fr1
H/
H
20
Δ*= 0.5
Δ*= 1
Δ*= 2
Δ*= 0.5 (Carnot)
FIG. 3(a). VARIATION OF DISCHARGE COEFFICIENT AGAINST THE ENERGY HEAD LOSS
Estimation of Flow Resistance Due to Embankments and Spur Dikes during Floods
control the downstream water level a vertical gate was
placed at the downstream end of the flume. Water is
pumped to the constant head tank which was situated
upstream of the flume. Discharge to the flume was
regulated by means of a valve, and measured using a
calibrated Rehbock weir [19] in the return section.
Rehbock weir is a sharp crested full width rectangular
weir. It is used to measure the discharge accurately in an
experimental flume. The empirical equation for discharge
coefficient is given as:
1 001 . 0 0 08 . 0 64 .
0 H
H d
C +
Δ + =
Rehbock's formula has been found to be accurate within
0.5% for values of Δ from 0.1-1.0 m and for values of H0
from 0.025-0.60m with the ratio of H
0/Δ not greater than 1.0 (Franzini &Finnemore [20]). The flume bed and the weir
were made rough by gluing 5-8mm diameter gravel to
represent the actual hydraulically rough field conditions
as shown in Fig. 4.
For this study a trapezoidal embankment dike is
selected. It has a height of 6m, crest width of 3m and
side slopes of 1V:4H on the upstream and 1V:4H, 1V:7H,
1V:15H for three different cases on the downstream side
as shown in Fig. 5.
The model was made of wood on a scale of 1:50. So the
model weir had a height of 12 cm and a crest width of 6cm.
The model was constructed from three parts: the upstream
face, downstream face and the rectangular crest. The side
slopes of the model weir were the same as with the
prototype. The surface was made hydraulically rough by
gluing gravel to it.
Point gages were installed to measure the water level at
section 0 which is 2m upstream of the weir, Section 1 i.e.
at the crest of the weir and over Section 2 which is 4m
FIG. 4. LABORATORY FLUME FOR THE EXPERIMENTAL SET UP
downstream of the weir. These gauges can move in the vertical as well as in the horizontal directions, so that the bottom and water level can be measured at the above mentioned locations. To measure the water levels at different locations first the elevation of the surface of the flow was measured and then the elevation of the bottom at that point was measured. The later was subtracted from the first one to get the value of the flow depth. In order to simplify the reading of the last significant number behind the decimal, a direct vernier attached to the scale is used and this scale enables an accuracy of ± 0.1mm.
All these experiments were performed for the turbulent flow regime. Effects of surface tension were ignored. The subcritical flow conditions were considered on the weir. In the return flume an ISO standard Rehbock weir was used to measure the discharge. The discharge was also measured by an electromagnetic flow meter mounted on the feeding pipe.
Experiments were conducted with fifteen different set-ups and with eight different discharges for each. The selected discharges ranged from 25-60 litre/sec with successive increments of 5 litre/sec. The downstream water level was adjusted to give different flow states, from completely submerged to the free flow regime. First the discharge is carefully adjusted to the desired value. The downstream water level was gradually varied from one experiment to the other to get different flow regimes and states. Water levels were measured for different discharges and these measurements were used to calculate the energy head loss due to the weir. The energy head was calculated by taking into account the average flow velocity values
upstream, over the weir's crest and at the downstream positions. The average flow velocity was obtained by
dividing the total discharge by the cross-sectional area of the flow.
5. RESULTS AND DISCUSSION
5.1
The Discharge Reduction Coefficient
(C
d) for Submerged Conditions
In Fig. 6, the discharge reduction coefficient is plotted against the submergence. Here it is clear that the predictions by the formulae of Villemonte [6] and Abou-Seida and Quarashi [7] are deviating a lot from the measured values and predicting lower values because these formulations were derived for the vertical downstream face and are empirically depending on the weir geometry. In the graph the solid lines are showing the general widely used formulation like the Villemonte [6] relation with different values of the fitting parameter P. The values of P are increasing as the downstream slope of the weir decreases. With the decreasing slope the head loss caused by the weir also decreased due to a gradual decrease in the recirculation zone behind the weir crest.
5.2
Effect of Downstream Slope
Estimation of Flow Resistance Due to Embankments and Spur Dikes during Floods
The energy head loss caused by the embankment weir is mainly due to flow separation with an associated recirculation zone behind the weir, in case of a steep slope (1:4) the recirculation is present during high water stages and so the effect of the slope is diminished and the energy head loss can be considered due to a sudden single expansion but in case of gentle slopes (1:7 and 1:15) the recirculation zone is small or
absent so the energy head loss decreased. To accommodate the downstream slope effect we apply the momentum balance in steps. This implies that we use a single step for steep slopes and two or more steps for milder slopes.
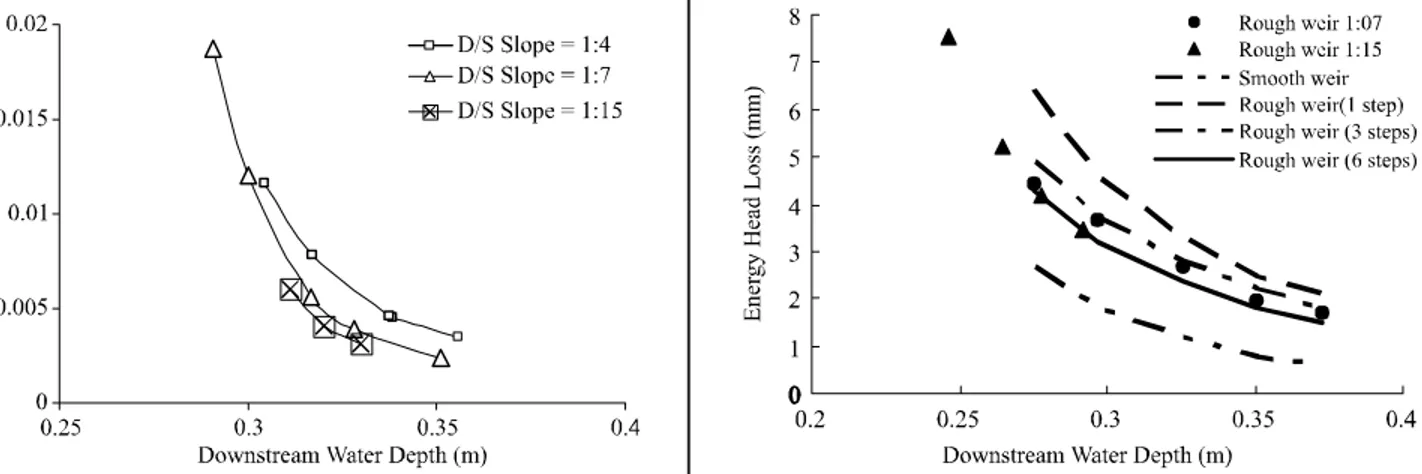
Fig. 8 shows that for the downstream slope 1:7, 4 steps are sufficient to get the correct results and for the downstream slope 1:15, 6 steps are required. For the down stream slope 1:4 we apply the momentum balance in single step to get correct results.
5.3
Analysis of Energy Head Loss Using
Expansion Loss form Drag Model
Fig. 9 is providing the comparison of energy head loss for the different weir configurations with predicted results obtained through the analytical expansion loss form drag model. The expansion loss form drag model was applied to analyze the form drag of the weir. Due to the contraction in the flow, velocity is increased, after the contraction there is the sudden expansion resulting in a decelerating region. So the energy head loss is established in this expansion region. Because of this reason the expansion
FIG. 8. ENERGY HEAD LOSS VARIATION AGAINST DOWNSTREAM WATER DEPTH (APPLYING THE MOMENTUM
EQUATION IN STEPS ON DOWNSTREAM SIDE OF A WEIR) FIG. 7. ENERGY HEAD LOSS VERSUS DOWNSTREAM WATER
DEPTH FOR DIFFERENT DOWNSTREAM SLOPE OF A WEIR (Q=20 L/SEC)
FIG. 6. DISCHARGE COEFFICIENT VERSUS SUBMERGENCE (COMPARISON OF DIFFERENT FORMULAE AND
loss form drag model is applied in single step (the momentum balance on downstream side of the weir is applied in one step for downstream slope 1:4).
To calculate the head loss due to a gentle down stream slope (1:7 and 1:15) we apply the momentum balance on
the downstream side of weir in steps. Doing so, the energy head loss predicted by the model is comparable to the
measured head loss. The results are provided for the
comparison between the energy head loss predicted by the expansion loss form drag model using slope correction
(applying the momentum balance in 4 and 6 steps for 1:7 and 1:15 slopes respectively) and the measured results.
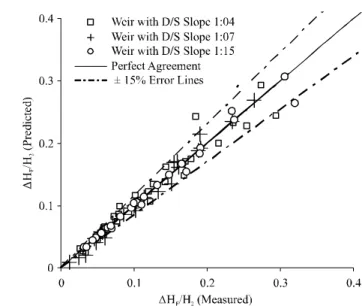
The expansion loss form drag model can predict the energy head loss within 15%. Some points are deviating more;
these are typically for Froude numbers higher than 0.6 defined at the weir crest.
5.4
Error Analysis
Fig. 9 shows the predicted energy head loss against the measured one for the laboratory experiments. It is clear
from this graph that the predicted energy head loss by the expansion loss form drag model is within 15 % error margin.
We determine the mean relative error for the expansion loss form drag model as follow:
% 100 2
1
mod 1
× ∑
= Δ Δ − Δ
=
⎥ ⎥ ⎥
⎦ ⎤
⎢ ⎢ ⎢
⎣ ⎡
⎟ ⎟ ⎠ ⎞ ⎜
⎜ ⎝ ⎛
i n
i Hmeas
meas H el H
n E
(17)
Here the 'model' refers to the predicted energy head loss and 'meas' refer to the measured energy head loss and n is the total number of data points. Table 1 presents the mean relative error for different case. It shows that the error in the predicted results is within 15% range.
6.
CONCLUSIONS
The embankments and the spur dikes are the standard civil engineering structure; their hydraulics has been explored during floods. This work presents a physical based analysis of submerged flow over embankment weirs. Here the expansion loss form drag model is presented to predict the energy head loss caused by the weir-like structures. Based on the experimental observations and physical analysis, the most important conclusions are presented here.
FIG. 9. COMPARISON OF ENERGY HEAD LOSS CAUSED BY THE EMBANKMENT WEIRS (PREDICTED BY EXPANSION
LOSS FORM DRAG MODEL)
TABLE 1. MEAN RELATIVE ERROR E, FOLLOWING FROM EQUATION (17)
Downstream Discharge Relative
No. Slope of Q Error
Rough Weir (L/sec) (%)
1. 1:4 3 0 7
2. 1:4 4 0 1 0
3. 1:7 2 5 1 2
4. 1:7 3 0 1 0
Estimation of Flow Resistance Due to Embankments and Spur Dikes during Floods
(i) It is obvious from the experimental results that the flow resistance due to the embankment structure with the gentle downstream slope is less than the steep slope.
(ii) The energy head loss predicted by the expansion loss form drag model has been compared with the experiments for the submerged weirs. The expansion loss form drag model appears to provide a good basis for the prediction of the energy head loss for submerged and subcritical flow conditions.
(iii) This model is applicable for submerged and subcritical flow (Fr< 0.6) conditions only.
(iv) When the Froude number is 0.6 or more above the crest of the weir, the flow starts undulating on the downstream slope of the weir. In this case predictions by the expansion loss form drag model deviate from measured values due to the non- hydrostatic pressure distribution.
ACKNOWLEDGEMENTS
The first author is highly acknowledged for the funding provided by the Higher Education Commission, Pakistan to carryout this research work in Delft University of Technology, Netherland. Authors are also thankful to authorties of University of Engineering & Technology,
Texila, and Lahore, Pakistan, respectively, for providing all necessary facilities for this research.
REFERENCES
[1] Bazin, H., ''Expériences Nouvelles Sur l' Ecoulement en Deversoir 96e Article (Recent Experiments on Flow of Water Over Weirs)'', Annales des Ponts et Chaussées, (French Language), pp. 645-771, France, 1898.
[2] Horton, R.E., ''Weir Experiments, Coefficients, and Formulas'', Government Printing Office, Washington, DC, Chapter-4, USA, 1907.
[3] Yarnell, D.L., and Nagler, F.A., ''Flow of Flood Water
Over Railway and Highway Embankments'', Journal of
Public Roads, Volume 11, No. 2, pp. 30-34. USA,
April, 1930.
[4] Fritz, H.M., and Hager, W.H., ''Hydraulics of
Embankment Weirs'', ASCE Journal of Hydraulic
Engineering, Volume 124, No. 9, pp. 963-971, USA,
September, 1998.
[5] Sargison, J.E., and Percy, A., ''Hydraulics of Board-Crested
Weirs with Varying Side Slopes',' Journal of Irrigation
and Drainage Engineering, pp. 115-118, USA,
January, 2009.
[6] Azinfar, H., and Kells, J.A., ''Flow Resistance Due to a
Single Spur Dike in an Open Channel'', ASCE Journal of
Hydraulic Research, Volume 135, No. 6, pp. 755-763,
USA, June, 2009.
[7] Yossef, M.F.M., ''Morphodynamics of Rivers with
Groynes'', Delft University Press, Delft, Chapter-2,
Netherland, 2005.
[8] Villemonte, J.R., ''Submerged Weir Discharge Studies','
Engineering News Record, Volume 193, pp. 866-869,
UK, 1947.
[9] Abou-Seida, M.M., and Quraishi, A.A., ''A Flow Equation
for Submerged Rectangular Weirs'', Proceedings of
Institute of Civil Engineering, Volume 61, No. 2,
pp. 685-696, UK, March, 1976.
[10] Hager, W.H., ''Beitkroniger Überfall. Wasser, Energie'',
Luft Publishing Company (German Language),
Chapter-10, Germany, August, 1993.
[11] Hager, W.H., and Schwalt, M., ''Broad Crested Weir'',
ASCE Journal of Irrigation and Drainage Engineering,
[12] Mark, V.D., ''A Semi-Analytical Model for form Drag of
River Bed Forms'', Ph.D. Thesis, University of Twente,
Netherlands, July, 2009.
[13] Hendersen, F.M., "Open Channel Flow", McMillan
International, New York, USA, 1966.
[14] Colebrook, C.F., ''Turbulent Flow in Pipes, with Particular
Reference to the Transition Region between the Smooth
and Rough Pipe Laws'', Journal of Institute of Civil
Engineering, Volume 11, pp. 133-156, London, UK,
1939.
[15] Chow, V.T. ''Open Channel Hydraulics'', McGraw-Hill
Publishing Company, Chapter-6, Tokyo, Japan, 1959.
[16] Chaudhary, M.H. ''Open Channel Flow'', Springer Publishing Company, New York, USA, 2008.
[17] Jain, S.C., ''Open Channel Flow'', John Wiley & Sons Publishers, New York, 2001.
[18] Chanson, H., ''The Hydraulics of Open Channel Flow'', John Willey & Sons Publishers, 1999.
[19] Rehbock, T., ''Discussion of Precise Weir Measurements',' Transactions of ASCE, Volume 93, pp. 143-1162, USA, 1929.