vol. 45, n. 1, jan./mar., 2009
Ar
*Correspondence: P. B. Reis. Departamento de Tecnologia e Inspeção de Produtos de Origem Animal, Escola de Veterinária, Universidade Federal de Minas Gerais, Av. Antônio Carlos, 6627, Caixa Postal n° 567 - 30123-970 - Belo Horizonte - MG, Brasil. E-mail: [email protected]; [email protected].
Validation of spectrophotometric method to detect and
quantify nitrite in ham pate
Patrícia Barros Reis
1*, Rodrigo Mauro Ramos
2, Leonardo Francisco de Souza
2, Silvana de
Vasconcelos Cançado
31Departament of Technology and Inspection of Products from Animal Origin, School of Veterinary Medicine, Federal University of Minas Gerais, 2Agriculture, Livestock and Supplying Ministry, National Agricultural Laboratory, 3Departament of Technology
and Inspection of Products from Animal Origin, School of Veterinary Medicine, Federal University of Minas Gerais
The objective of this work was to validate the spectrophotometric method to detect and quantify nitrite using ham pate as a source. The validated analytical conditions were 540 nm wavelength and the samples reading between 40 to 70 minutes after addition of coloring agents. The tested performance
criteria were: linearity, matrix effect, selectivity, detection and quantiication limit, accuracy, precision
and robustness. As the results have obtained linearity in the studied zone (0.125 to 3 g/mL) and matrix effect was not observed, there was not any interference from ascorbic acid, but interference occurred
from sodium eritorbate, in concentrations above 2.5 mg/100g. The detection limit was deined as 12.5 mg of nitrite/kg for pate and the quantiication limit as 25 mg of nitrite/kg of pate. The method presented
repeatability and reproducibility. The accuracy was assessed through recovery values varying from 84 to 110%. Respecting robustness, it was observed that the variations applied to the extraction procedure depended on the concentration of nitrite in the pate sample. In conclusion, the methodology was validated under the tested conditions.
Uniterms: Validation. Nitrite. Spectrophotometric method. Ham pate.
O objetivo deste trabalho foi validar o método espectrofotométrico para determinação de nitrito usando como matriz patê de presunto. As condições analíticas usadas foram comprimento de onda de 540 nm e leitura das amostras entre 40 e 70 minutos após a adição dos reagentes complexantes. As características de desempenho testadas foram linearidade, efeito de matriz, seletividade, limite de detecção do equipamento
e do método, limite de quantiicação, exatidão, precisão e robustez. A linearidade foi obtida na faixa
de trabalho estudada (0,125 a 3 µg de nitrito/mL) e não foi observado efeito de matriz. A concentração de ácido ascórbico na amostra não interferiu na análise e o eritorbato de sódio possuiu interferência
negativa para concentrações acima de 2,5 mg/100g de amostra. O limite de detecção foi deinido em 12,5 mg de nitrito/kg de patê e o limite de quantiicação em 25 mg de nitrito/kg de amostra. O método
apresentou repetitividade e reprodutibilidade intra-laboratorial. A exatidão foi avaliada através dos valores de recuperação que variaram entre 84 e 110%. Na avaliação da robustez, as variações realizadas no procedimento de extração foram dependentes do nível de concentração existente na amostra. Concluiu-se que a metodologia pôde Concluiu-ser validada nas condições testadas.
Unitermos: Validação. Nitrito. Espectrofotometria. Patê de presunto.
INTRODUCTION
The Ministry of Agriculture, Livestock and
nitrite (NaNO2), potassium nitrite (KNO2), sodium nitrate (NaNO3), potassium nitrate (KNO3), and its combinations. When nitrate is used, it is required the use of some reducer bacteria to transform it into nitrite, however this change is
slow and dificult to control. Therefore, the direct addition
of a well-known amount of nitrite makes the cure process easier and diminishes the color and taste variation in cured products (Chichester, Tanner Jr., 1972).
Nitrates and nitrites are additives largely used in meat industry, and they prevent the growth of Clostridium botulinum, provide the products with a pinkish color, cured
meat typical lavor, and possess antioxidant effects (Kilic,
2000). However, these additives can cause serious damages to health; the nitrite combines with the secondary and ter-tiary amines present in the meat, creating nitrosamines, that are highly carcinogenic substances. They can also combine with hemoglobin creating methemoglobin, which damages the blood oxygen transport. The long term nitrite intake can causemethemoglobinemia, mainly in children, and the nitrite intoxication causes vasodilatation, smooth muscle relaxation, face redness, gastrointestinal discomfort, hea-dache, cyanosis and vomiting. The n-nitrate compounds formed from the nitrite reactions with the amines are mu-tagenic and teratogenic (Harada, Silva, 2002).
Several techniques are used to detect and quantify nitrites in meat products. Between them, liquid chromato-graphy, gas chromatography and UV/visible spectropho-tometry. Between the advantages of the chromatographic methods, are not only the simultaneous detection of nitrites and nitrates, but also their fast analysis; however, it is an analytical process with high cost equipments and reagents (Schuster, Lee, 1987). The spectrophotometric analyses
have been largely used for the detection and quantiication
of nitrate and nitrite in meat products, vegetables, legumes and water. Their advantages are the low cost method, and the fact that they meet the analyte accomplishment cha-racteristics (Pringues et al., 1995).
The validation of an analytical method is made by the assessment of its performance criteria. The most common performance criteria are: selectiveness, which
is the method capacity to identify the speciic investi -gated compound between many others; linearity, which is the method capacity to obtain results that are directly proportional to the analyte amount that is present in the sample; precision, which is the the proximity obtained in the result, respecting to many measurements developed with the same sample; accuracy, which is the proximity of obtained results to the real analyte amount into the sample; detection limit, which is the minimum amount of analyte that is possible to detect; quantifying limit, which is the minimal amount of analyte present in the
sample that can be quantiied; and robustness, which is
the rehearsal method capacity in resisting from certain variations in the analytical parameters (Leite, 1996; Eu-charem, 1998; Brasil, 2003).
The purpose of this study was to validate spectro-photometry, as nitrite detection and quantifying method in ham pate.
MATERIAL AND METHODS
This experiment took place in the Physical/Chemical Sector of Animal Source Products of the National Agricul-tural Laboratory (LANAGRO), in Pedro Leopoldo – MG, according Brazil methodology (1990). A Genesys 10UV sample reader spectrophotometer was used. The analytical conditions used were as follows: 540 nm wavelength and optical time to read the samples after the complexating reactors addition, varying from 40 to 70 minutes.
The evaluated performance criteria were linearity,
matrix effect, selectiveness, detection and quantiication
limits, precision, accuracy and robustness. For the per-formance criteria, the following concentrations of the evaluation standard-solution of sodium nitrite were used:
0.125; 0.250; 0.5; 1.2; and 3 μg/mL, and ham pate blank
matrixes were added at 12.5; 25; 50; 100; 200 and 300 concentrations of nitrite/product kg. The concentration of 200 mg of nitrite/product kg, the maximum value allowed
by law, corresponds to the 2 μg/mL standard-curve. The
standard-curve was repeated in all days of analysis.
RESULTS AND DISCUSSION
Linearity
The determination coeficients (r²) evaluated in the
linearity vary from 0.9943 to 0.9976, being all of them superior than the usually required ones, proposed by Chasin et al. (1998), who has recommended coeficients
above 0.98.
Selectiveness
Ascorbic acid test
The results about the selectiveness test using ascor-bic acid as an interfering are shown at Table II.
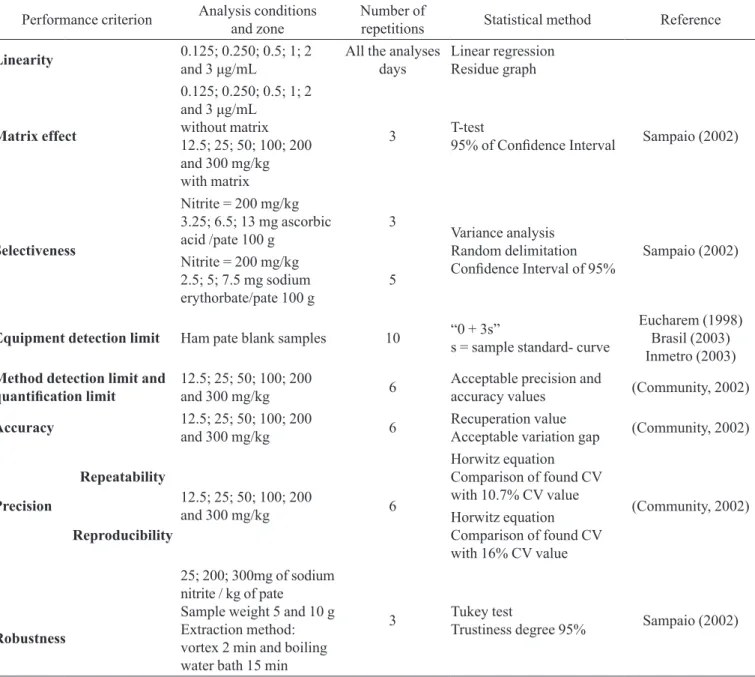
TABLE I – Material and methods used at each performance criterion tested
Performance criterion Analysis conditions and zone
Number of
repetitions Statistical method Reference
Linearity 0.125; 0.250; 0.5; 1; 2
and 3 μg/mL All the analyses days
Linear regression Residue graph
Matrix effect
0.125; 0.250; 0.5; 1; 2
and 3 μg/mL
without matrix 12.5; 25; 50; 100; 200 and 300 mg/kg with matrix
3 T-test95% of Conidence Interval Sampaio (2002)
Selectiveness
Nitrite = 200 mg/kg 3.25; 6.5; 13 mg ascorbic acid /pate 100 g
3
Variance analysis Random delimitation
Conidence Interval of 95% Sampaio (2002)
Nitrite = 200 mg/kg 2.5; 5; 7.5 mg sodium erythorbate/pate 100 g
5
Equipment detection limit Ham pate blank samples 10 “0 + 3s”
s = sample standard- curve
Eucharem (1998) Brasil (2003) Inmetro (2003) Method detection limit and
quantiication limit 12.5; 25; 50; 100; 200 and 300 mg/kg 6
Acceptable precision and
accuracy values (Community, 2002)
Accuracy 12.5; 25; 50; 100; 200
and 300 mg/kg 6
Recuperation value
Acceptable variation gap (Community, 2002)
Precision
Repeatability
12.5; 25; 50; 100; 200
and 300 mg/kg 6
Horwitz equation
Comparison of found CV with 10.7% CV value
(Community, 2002)
Reproducibility
Horwitz equation
Comparison of found CV with 16% CV value
Robustness
25; 200; 300mg of sodium nitrite / kg of pate
Sample weight 5 and 10 g Extraction method: vortex 2 min and boiling water bath 15 min
3 Tukey test
Trustiness degree 95% Sampaio (2002)
Sodium erythorbate test
The results about the selectiveness test using sodium erythorbate as an interfering are shown at Table III.
As observed, the sodium erythorbate has interfered in the nitrite spectrophotometric analyses over a sodium erythorbate concentration of 2.5 mg/100 g of pate. The ni trite concentration average obtained in the samples con-taining nitrite plus 2.5 mg of sodium erythorbate /100 g of pate had the same statistical value as the control group (con-taining only nitrite). However, the nitrite sample averages containing nitrite plus 5 mg of sodium erythorbate/100 g and nitrite plus 7.5 mg of sodium erythorbate/100 g were statistically different from the control group.
TABLE II – Ascorbic acid addition effect in nitrite quantiication.
All pate samples have the concentration of 200mg/kg of ascorbic acid
Ascorbic acid addition (mg/100 g) nitrite (mg/kg)
0 204.53a ± 13.05
3.25 173.07a ± 28.03
6.5 197.32a ± 13.91
13 193.58a ± 13.89
Matrix Effect
The matrix effect was evaluated through the angle
coeficient (a) value comparison obtained in samples with
and without matrix. The angle coefficient values were 0.9136; 0.9525 and 0.9535 for the standard curves with matrix standard addition, and 0.9118; 0.9543 and 0.9648 for the pattern curves without matrix standard addition.
The angle coeficient average values were compared by
the t-test, in which the t calculated (0.0982) was inferior
than the tabulated t (4.032) being the conidence interval of 95%, so the matrix effect was not identiied (Sampaio,
2002).
Detection and quantification limit
For the definition of equipment detection limit , some tests using the “0+3s” formula have been made (Inmetro, 2003). The blank matrix obtained average va-lues of 7.225mg of n itrite/kg of product and the standard deviation “s” was 0.78, therefore the value obtained by the utilization formula was 9.56mg of nitrite/kg of pate.
For the determination method of detection limit, a recovery average of twelve nitrite samples added at the concentration of 12.5mg/kg was observed, and the detection
limit method was deined as 12.5mg of nitrite/kg of pate.
This result was based on acceptable precision and reco-very values according to Community (2002), in which the acceptable recovery values vary from 80 to 110%, and the
acceptable variation coeficient is of 10.7% for repeatability
and 16% intra-laboratory reproducibility conditions (Com-munity, 2002). The recovery values obtained in this concen-tration varied from 35 to 84%, but only one recovery value, in twelve samples, above 80% was found. For the precision values, in both analyzed levels, the nitrite concentration of 12.5mg/kg of pate was the only one that obtained variation
coeficient values higher than the values accepted by the
Directiva 2002/657/CE (Community, 2002).
The quantiication limit was of 25 mg of nitrite/pro -duct kg and this was the second minor concentration used in the standard curve. Twelve blank matrix nitrite analyses added were done at this concentration, and the recovery average of these samples was of 81% and the variation
coeficient was of 10.3%, reaching the acceptable preci -sion and accuracy criteria according Directiva 2002/657/ CE (Community, 2002).
Precision
Repeatability
According to Directiva 2002/657/CE from Com-munity (2002), the acceptable variation gap for the pre-cision in repeatability conditions is of 10.7%. This value was calculated starting from the Horwitz equation (CV = 2 (1-0,5 log c)) used for intra-laboratory reproducibility. In
the repeatability case the CV value should correspond to 2/3 of the calculated value for intra-laboratory repro-ducibility.
The results found in the analyses repeatability are
demonstrated at Table IV. The variation coeficient among
six independent repetitions at the same level of nitrite concentration was within the established standards of the Directiva 2002/657/CE from Community (2002).
TABLE III – Sodium erythorbate addition effect in nitrite
quantification. All pate samples have the concentration of 200mg/kg of sodium erythorbate
Sodium erythorbate addition (mg/100g) nitrite (mg/kg)
0 209.32a ± 1.9
2.5 189.08ab ± 5.3
5 173.05b ± 22.1
7.5 134.05c ± 20.2
Non-capitalized letters in the column indicates different statistical averages by Tukey test (P<0.05).
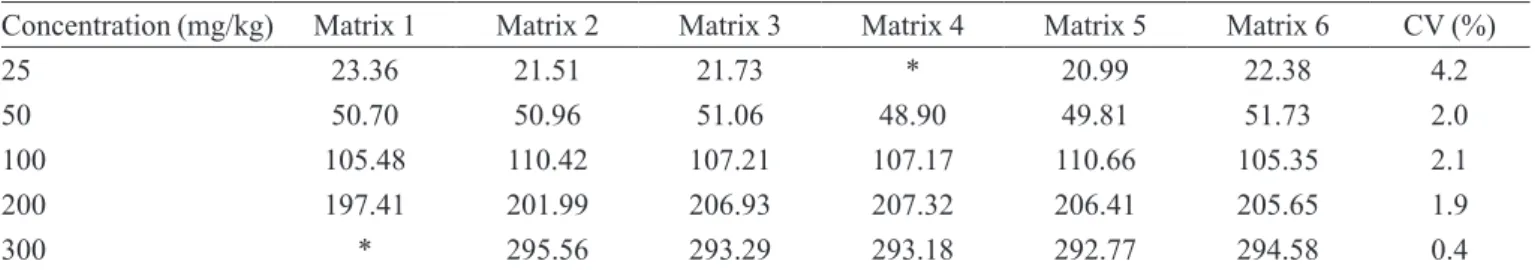
TABLE IV – Concentration values obtained in repeatability from six repetitions of six analyzed nitrite concentrations, and respective
variation coeficient values
Concentration (mg/kg) Matrix 1 Matrix 2 Matrix 3 Matrix 4 Matrix 5 Matrix 6 CV (%)
25 23.36 21.51 21.73 * 20.99 22.38 4.2
50 50.70 50.96 51.06 48.90 49.81 51.73 2.0
100 105.48 110.42 107.21 107.17 110.66 105.35 2.1
200 197.41 201.99 206.93 207.32 206.41 205.65 1.9
300 * 295.56 293.29 293.18 292.77 294.58 0.4
Reproducibility
At Table V it is possible to observe the obtained re-sults from the analyses done by other analyst, but using the same laboratory and equipment. The concentration levels studied (25, 50, 100, 200 and 300 mg/kg), in six totally
independent repetitions, obtained the variation coeficient
within the standards established by Directiva 2002/657/CE from the Community (2002), which is 16% as demonstra-ted in the Horwitz equation. In the equation CV = 2 (1-0,5 log c),
c is the used mass fraction and, in this case, c = 10-6 ,
be-cause the used mass fraction was mg/kg. Table V shows
the obtained variation coeficient from the analyses done
by the analyst in the intra-laboratory reproducibility.
To calculate the variation coeficient values obtained
for the reproducibility, Tables IV and V were considered, representing the obtained values in the analyses made by the two participant analysts of this performance characteristic. The obtained variation coefficient values for the intra-laboratory reproducibility were as following (Table VI).
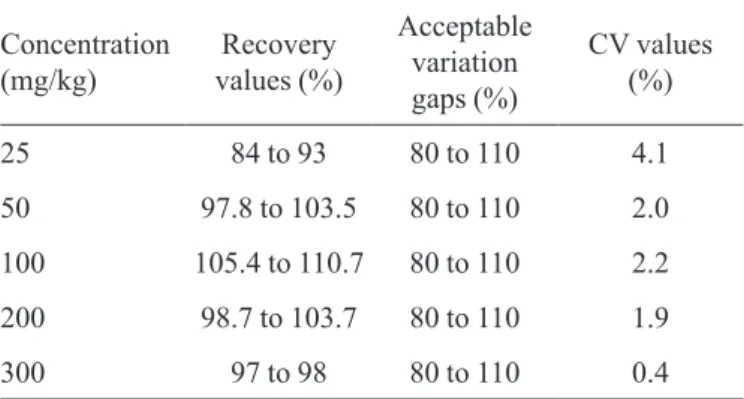
Accuracy
At Table VII, the obtained recovery values in the accuracy test are presented.
In the nitrite concentrations of 25; 50; 100; 200 and 300 mg /kg of pate, the found recovery values were within the acceptable variation gap. It was observed that as higher the analyzed concentrations, as higher the recovery values;
and as lower the observed variation coeficient(thanks
to higher amount of analyte), as lower the interference caused by losses. It is possible to observe that the recu-peration values are within the acceptable gap, according to Directiva 2002/6.57/CE, in all studied concentrations (Community, 2002).
Robustness
The amount of weighed sample for the spectrophoto-metric nitrite analyze is dependent on the nitrite concentra-tion present in the sample, according the analyzed results obtained (Table VIII). However, for the sample containing 25 mg of nitrite/kg of pate, it is recommended to weigh 10 g of pate, according to the traditional methodology (Brasil, 1999). For the samples containing 200 or 300 mg of nitrite/kg of pate, 5 g of sample should be weighed for the nitrite spectrophotometric analyze, which facilitates the analyte extraction process, thanks to the easier proce-dure of weighing 5 g instead of 10 g, when a large amount of analyzes are made in a single day, considering that for
TABLE V – Obtained concentration values from intra-laboratory reproducibility, after six repetitions, from six analyzed nitrite
concentrations and respective variation coeficient values
Concentration (mg/kg) Matrix 1 Matrix 2 Matrix 3 Matrix 4 Matrix 5 Matrix 6 CV (%)
25 18.77 18.67 16.88 17.40 21.09 19.93 8.3
50 51.42 51.10 50.36 49.63 51.84 51.63 1.7
100 106.39 103.02 106.28 107.33 105.54 106.07 1.4
200 210.64 206.85 202.32 208.01 207.80 208.22 1.3
300 291.20 293.2 290.89 295.52 290.15 293.73 0.7
TABLE VI – Standard deviation method and obtained variation
coeficient values for the intra-laboratory reproducibility
Concentration (mg/kg)
Pattern deviation
Variation
coeficient (%)
25 2.087 10.3
50 0.921 1.8
100 2.116 2.0
200 3.571 1.7
300 1.785 0.6
In all studied concentration, the obtained variation coeficient
values for the intra-laboratory reproducibility were inferior to 16%, according to the Horwitz Equation (Community, 2002).
TABLE VII - Obtained recovery values in the accuracy, respective acceptable variation gaps in the studied concentration zone, and
variation coeficients
Concentration (mg/kg)
Recovery values (%)
Acceptable variation gaps (%)
CV values (%)
25 84 to 93 80 to 110 4.1
50 97.8 to 103.5 80 to 110 2.0
100 105.4 to 110.7 80 to 110 2.2
200 98.7 to 103.7 80 to 110 1.9
the nitrite analysis, the analyte extraction should be made in the same day.
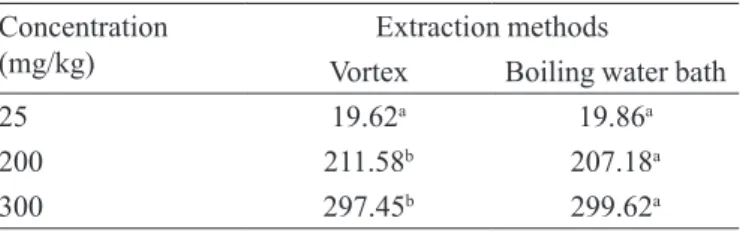
As it could be observed at (Table IX), the extraction method used in the analytical procedure was dependant on the nitrite concentration contained in the sample. In the sample containing 25 mg of nitrite/kg of pate, both extraction analyte methods were efficient. However, for the concentrations of 200 and 300 mg of nitrite/kg of pate, the recommended analyte extraction is of 15 minutes in a boiling water bath, because it was statistically superior, when compared to results obtained in the analyte extraction for two minutes in vortex. To create a pattern, it is recommended the analyte extraction by bath of boiling water for 15 minutes, because this method
covers eficiently all studied concentrations.
CONCLUSION
According to all tested conditions in this study, the spectrophotometric analytical methodology for nitrite
detection and quantiication in ham pate was validated.
ACKNOWLEDGMENTS
Special thanks to Agriculture, Livestock and Sup-plying Ministry, especially to the director and workers
of LANAGRO – Pedro Leopoldo/MG, by allowing us to develop this work.
REFERENCES
BRASIL. Agência Nacional de Vigilância Sanitária. Resolução RE, n° 899 de 29 de maio de 2003. Determina a publicação do guia de validação de métodos analíticos e bioanalíticos.
Diário Oicial da União, Brasília, 02 de jun. 2003. Available at: <www.anvisa.gov.br>. Access on: Jan. 31th 2006.
BRASIL. Decreto Federal n° 30.691 de 29 de mar. 1952 e alterações. Aprova o Regulamento de Inspeção Industrial e Sanitária de Produtos de Origem Animal. Aprovado pelo Diário Oicial da União. Brasília, 07 de jul. de 1952. Available at: <www.agricultura.gov.br>. Access on: Aug. 23th. 2005.
BRASIL. Ministério da Agricultura, Pecuária e Abastecimento. Instrução Normativa, n° 20 de 9 de set. 1999. Métodos
Analíticos Oiciais Físico-Químicos para Controle de Carnes,
Produtos Cárneos e seus Ingredientes, Sal e Salmoura. Diário
Oicial da União. Brasília, 27 de jul. de 1999. Available in: <www.agricultura.gov.br>. Access on: Aug. 31th. 2005.
CHASIN, A. A. M.; NASCIMENTO, E. S.; RIBEIRO NETO,
L. M.; SIQUEIRA, M. E. P. B.; ANDRAUS, M. H.;
SALVADORI, M. C.; FERNÍCOLA, N. A. G.; GORNI, R.; SALCEDO, S. Validação de métodos em análises toxicológicas: uma abordagem geral. Rev. Bras. Toxicol., v. 11, n. 1, p. 1-6, 1998.
CHICHESTER, D. F.; TANNER JR, F. W. Antimicrobial Food Additives. In: FURIA, T. E. Handbook of Food Additives. Palo Alto: CRC, 1972. v.1, p. 137-207.
EUROPEAN ECONOMIC COMMUNITY. August/12/2002. Commission decision executes the disposed in Directiva 2002/657/CE from council related to analytical methods performance and to results interpretation. Europ. Commun.
Ofic. J., v.657, 2002, p.L 221/8 – L 221/36.
EURACHEM. The itness for purpose of analytical methods: A laboratory guide to method validation and related topics. Teddington: LGC, 1998. 61p.
HARADA, M. M.; SILVA, M.L. Nitrito e nitrato x segurança alimentar. Rev. Nac. Carne, São Paulo, v.26, n.308, p.105-106, 2002.
TABLE VIII – Nitrite concentration analyzed in robustness
weighing 5 and 10g of sample, and obtained results in statistical analysis
Concentration (mg/kg)
Sample mass
5g 10g
25 16.51a 22.96a
200 213.86a 204.90b
300 310.03a 287.05b
Non-capitalized letters in the column indicate different statistical averages by Tukey test (P<0.05).
TABLE IX – Nitrite concentrations analyzed for robustness,
using both proposed methods, and obtaining results in statistical analyses
Concentration (mg/kg)
Extraction methods
Vortex Boiling water bath
25 19.62a 19.86a
200 211.58b 207.18a
300 297.45b 299.62a
INMETRO. DOQ-CGCRE-008: Chemical essay orientations about validation methods. Revision 01. [S.I.], 2003. Available in: <http://www.inmetro.gov.br/kits/doqcgcre008r01.pdf>. Access on: Jan. 15th. 2006.
KILIC, B. Residual nitrite: a concern in cured meat products. Meat process., Mt. Morris, v.39, n.2, p.40-41, 2000.
LEITE, F. Validação em análise química. Campinas-SP: Átomo, 1996. 124p.
PRINGUEZ, E.; SAUDE, I.; HULEN, C. Improvement of Standard Method IDF 95A:1984 for Determination of the
Nitrate Contents of Dried Milk. J. Food Compos. Anal., Blacksburg, v.8, n.1, p. 344-350, 1995.
SAMPAIO, I. B. M. Estatística aplicada à experimentação animal. 2 ed. Belo Horizonte: FEPMVZ, 2002. 265p.
SCHUSTER, B. E.; LEE, K. Nitrate and Nitrite Methods Analysis and Levels in Raw Carrots, Processed Carrots and in Selected Vegetables and Grain Products. J. Food Sci., Chicago, v. 52, n.6, p. 1632-1636, 1987.