http://dx.doi.org/10.1590/s2175-97902017000317185
A
r
*Correspondence: B. S. R. Costa. Universidade Federal do Rio Grande do Norte. Avenida General Gustavo Cordeiro de Farias, S/N, 59014-520, Natal, Rio Grande do Norte, Brasil,. E-mail: brunnasr9@gmail.com
Association between kidney function and Framingham risk score in
an admixed population of Brazil
Brunna Soares Rodrigues Costa
1*, Erika Paula Silva Freitas
2,
Marina Sampaio
Cruz
1, Victor Hugo Rezende Duarte
1,
Ananília Medeiros Gomes da Silva
1, Isabelle
Cristina Clemente dos Santos
1, Jéssica Cavalcante dos Santos
1, Adriana Augusto Rezende
1,
Karine Cavalcanti Maurício Sena‑Evangelista
2,
Vivian Nogueira Silbiger
11 Department of Clinical and Toxicological Analysis, Federal University of Rio Grande do Norte, Natal, Brazil, 2 Department of Nutrition, Federal University of Rio Grande do Norte, Brazil
Chronic kidney disease (CKD) increases cardiovascular disease (CVD) risk development. However, the mechanisms of reduced kidney function with CVD risk are unclear. This study aimed to investigate the association between kidney function and Framingham risk score (FRS) in participants with traditional cardiovascular risk factors and normal estimated glomerular iltration rate (eGFR) > 60 mL/min/1.73 m² in an admixed population of Brazil. The participants were divided into three groups according to FRS: low risk group with 0% to <10%, moderate risk group with ≥10% to 20% and high risk group with >20%. The eGFR was calculated using Chronic Kidney Disease Epidemiology Collaboration (CKD-EPI). Data from participants were collected by questionnaire, and blood and urine samples were collected to analyze biochemical markers. A total of 214 subjects aged 53±10 years old was collected. There were 77 individuals in low risk group, 59 in moderate risk group and 78 in high-risk group. Mean eGFRCKD-EPI was 89.39±15.05 mL/min/1.73 m² and 90.74±16.17 mL/min/1.73 m2 when race adjustment. The results indicated that there is an increasing the cardiovascular risk with a decreased of eGFR, conforming to a signiicant inverse correlation observed between eGFR and FRS with Spearman correlation (R²=-0.256, p<0.001; R²=-0.224, p=0.001, when adjusted for race). There was a statistically signiicant diference in eGFRCKD-EPI (p<0.001) and eGFRCKD-EPI with race adjustment (p=0.002) among risk groups. The data suggests that the reduction eGFR is associated with elevated FRS among Brazilian adults without CKD. Furthermore, the results suggest that race adjustment it’s not necessary in Brazilian population. Keywords: Chronic kidney disease. Cardiovascular diseases/risk factors. Glomerular iltration rate. Framingham risk score (FRS).
INTRODUCTION
Chronic kidney disease (CKD), defined as renal
damage or glomerular iltration rate <60 mL/min/1.73 m2
for at least 3 months (Andrew et al., 2005), is generally
considered an independent risk factor for CVD (Sarnack
et al., 2003; Olechnowicz-Tietz et al., 2013), increasing
cardiovascular morbidity and mortality (Ito et al., 2015).
However, kidney function mechanisms with cardiovascular
risk in participants with estimated glomerular iltration rate
(eGFR) >60 mL/min/1.73 m2 are unclear.
Early diagnosis of CVD along with proper assessment of cardiovascular risk is crucial for further reduction of health care costs and mortality rates (Pereira, Barreto, Passos, 2009). Several cardiovascular risk prediction models have been developed to estimate risk, with the Framingham risk score (FRS) being among them. The FRS allows physicians to estimate the individual 10-year cardiovascular risk by using traditional cardiac risk factors including gender, age, systolic blood pressure, hypertension treatment, diabetes mellitus history, total cholesterol,
high-density lipoprotein cholesterol (HDL-cholesterol) and
cigarette smoking (D’Agostino et al., 2008). In addition
Microalbuminuria is an established biomarker that relects glomerular damage and is closely associated with
the risk of all causes and cardiovascular mortality and
CVD events (Wang, Yan, Yu, 2013). However, this method
requires urine samples and could show altered results
due to collection errors. In clinical practice, measuring
of plasma creatinine has been most-used the method to assess kidney function, however it alone is not a sensitive method to assess asymptomatic patients with chronic kidney disease (CKD) (Fontela et al., 2014). Instead,
eGFR is the most feasible clinical measure of kidney function(KDIGO, 2013). Some studies have demonstrated that reduced eGFR is a predictor of major cardiovascular events (Jin et al., 2014; Wang et al., 2014; Ito et al., 2015;
Lu et al., 2016).
Jin and contributors (2014) suggested that kidney function was also independently associated with CVD
in a Chinese population without CKD (deined as eGFR
<60 mL/min/1.73 m²), however their population was
approximately 99% Han Yellow race, and conflicting conclusions may be obtained in different populations comprising subjects from other races. Therefore, the aim of the study was to investigate the association between kidney function and cardiovascular risk in participants
with normal eGFR >60 mL/min/1.73 m² in an admixed
population of Brazil.
MATERIAL AND METHODS
Study population
Originally, two-hundred and forty-eight participants
were recruited for our study. However, two-hundred and fourteen male and female adults residents in the state of Rio Grande do Norte, Northeastern Brazil, were
selected from the Hospital Universitário Onofre Lopes, at the Hemodynamics unit (n=138) who were undergoing
cinecoronariography to investigate the presence and extent of coronary lesion and individuals from the
Endocrinology unit (n=76) with metabolic syndrome
criteria without endocrine disorders (except for diabetes mellitus). Exclusion criteria included diagnosis of chronic
kidney disease (eGFR <60 mL/min/1.73 m²), elderly >70
years old, cardiomyopathy, heart valve disease, congenital diseases, pericarditis, coronary revascularization, liver failure, endocrine disorder (except for diabetes mellitus),
chronic inlammatory diseases, malignant diseases, blood
disorders, autoimmune diseases and family history of hypercholesterolemia. The study population was considered admixed due to the miscegenation of the Brazilian population, which is composed of several races. This study
was approved by the hospital’s Research Ethics Committee which complies with the Declaration of Helsinki under protocol number CAAE 0001.0.051.294-11 and a written informed consent was obtained from each individual.
Data collection
A questionnaire was designed to collect information on lifestyle risk factors, current medication and smoking habits (current or non-smoker). Weight and height were
measured and body mass index (BMI) was calculated as the
weight in kilograms divided by the square of the height in meters. Blood pressure was measured using a standardized mercury sphygmomanometer in the sitting position after
at least 10 min of rest. Race was based on self-deinition the Brazilian Institute of Geography and Statistics (IBGE) classiication and deined into three principal race or color
groups: white, brown and black subjects. Blood samples of all participants from the antecubital vein after a 12-hour
overnight fast and 24-hour urine collection (76 participants)
were collected. Biochemical markers, including fasting blood glucose (FBG), triglycerides (TG), total cholesterol
(TC), HDL-cholesterol, serum creatinine, aspartate aminotransferase (AST), alanine aminotransferase (ALT)
and microalbuminuria were measured using colorimetric, colorimetric-enzymatic and immune-turbidimetric methods
in BIO-2000 IL, a semi-automatic biochemical analyzer (Bioplus, São Paulo, Brazil). Values of LDL-cholesterol
were calculated according to the Friedewald formula
(Friedewald, Levy, Fredrickson, 1972).
FRS and definition of cardiovascular risk factors
The Framingham risk score equation (D’Agostino
et al., 2008) was used to calculate 10-year risk for developing CVD, according to cardiovascular risk factors: age, systolic blood pressure (treated or not treated), TC,
HDL-cholesterol, smoking and diabetes mellitus (DM).
They were divided into three groups according to FRS: low risk group with 0% to <10% risk, moderate risk group
with ≥10% to <20% risk and high risk group with ≥20% risk. Hypertension was deined as using antihypertensive medication or having systolic blood pressure ≥140 mmHg or diastolic blood pressure ≥90 mmHg. DM was deined as fasting serum glucose of at least 7.0 mmol/L or current use of blood glucose-lowering agents. Obesity was considered as BMI ≥30 kg/m². Dyslipidemia was deined according
to V Brazilian Guidelines on Dyslipidemia and Prevention of Atherosclerosis(Xavier et al., 2013) as: isolated
mixed, LDL-c ≥ 4.13 mmol/L and TG ≥ 1.69 mmol/L; and low HDL-c, isolated reduction HDL-c, man < 1.03 mmol/L and woman < 1.29 mmol/L, or association with increased of LDL-c or/and TG.
Estimated glomerular filtration rate
Several equations have been proposed to estimate GFR based on serum creatinine and the most employed
and analyzed equations are Modiication of Diet in Renal
Disease (MDRD)(Levey et al., 1999) and Chronic Kidney
Disease Epidemiology Collaboration (CKD-EPI)(Levey
et al., 2009). When compared to MDRD equation, the
CKD-EPI equation has shown greater accuracy, with better
performance and risk prediction, using the same variables,
especially when eGFR >60 mL/min/1.73 m² (Levey et al.,
2009; Matsushita et al., 2012), including healthy Brazilian
adults (Soares et al., 2010).
The eGFR was calculated using the Chronic Kidney
Disease Epidemiology Collaboration (CKD-EPI) equation
as follows:
eGFR = 141 × min(Scr/κ, 1)α×max(Scr/κ, 1)-1.209
× 0.993Age×1.018 [if female]
× 1.159 [if black whenrace adjustment]
where Scris serum creatinine in mg/dL, κ is 0.7 for females
and 0.9 for males, α is -0.329 for females and -0.411 for males, min indicates the minimum of Scr/κ or 1, and max
indicates the maximum of Scr/κ or 1(Levey et al., 2009).
Statistical analyses
Statistical analysis was performed using SPSS® 20.0 software (SPSS, Chicago, IL, USA). Normal distribution
was evaluated using the Kolmogorov-Smirnov test. Continuous variables are presented as mean and standard
deviation and were compared using ANOVA followed by
Tukey post-hoc test. Continuous variables with skewed distributions were analyzed using the Kruskal-Wallis
test followed by the Mann-Whitney’s test. Categorical
variables were presented as number and percentage and were compared by chi-square test or Fisher test. Pearson and Spearman correlations were performed between all
continuous variables. The level of statistical signiicance
was accepted as p < 0.05.
RESULTS
Originally, two hundred forty-eight participants were
recruited for our study, however, thirty-four participants
with eGFR < 60 mL/min/1.73 m² were excluded. Thus, a total of 214 subjects aged 24-70 (53±10) years old
remained. They were divided into three groups according
to their FRS: low risk group – 77 individuals (36.0%), moderate risk group – 59 individuals (27.6%), high-risk group – 78 individuals (36.4%). No microalbuminuria was observed in 24-hour urine collection analyzed, conirming
the preserved kidney function of these participants.
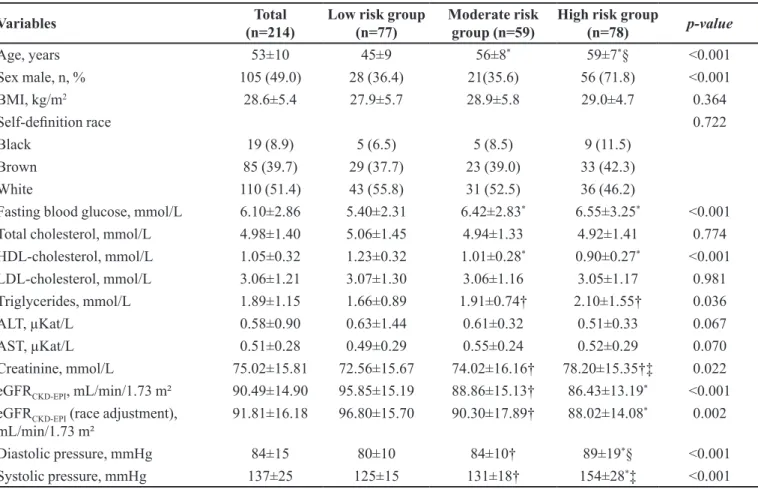
Table I outlines the demographic and clinical data for all participants stratiied by FRS. The majority of participants
were white (51.4%). Compared with the low risk group, individuals with high cardiovascular risk were much older, had higher levels of fasting blood glucose and blood
pressure and lower levels of HDL-cholesterol, as would be
expected, since these variables were used for calculating FRS. Cardiovascular risk was much higher in men than in women.
Mean eGFRCKD-EPI was 89.39±15.05 mL/min/1.73
m² with a range of 60.05mL/min/1.73 m² to 133.97 mL/
min/1.73 m², and mean eGFRCKD-EPI was 90.74±16.17
mL/min/1.73 m2 with a range of 60.05mL/min/1.73 m²
to 149.18 mL/min/1.73 m² when adjusted by the black race. A signiicant inverse correlation between eGFR and
FRS was observed with Spearman correlation (p<0.001,
r²=-0.256; p=0.001, r²=-0.224, when race adjustment),
indicating that with increased cardiovascular risk, there is
a decreased of eGFR. There were statistically signiicant
differences in eGFRCKD-EPI (p<0.001) and eGFRCKD-EPI
with race adjustment (p=0.002) among risk groups. Both equations are highly correlated (p<0.001, r²=0.976).
The prevalence of traditional cardiovascular risk
factors is displayed in Table II. Compared with individuals
of low risk group, those of high risk group had higher prevalence of diabetes mellitus (p<0.001), hypertension
(p<0.001) and dyslipidemia (p=0.004). In addition, the
high risk group had a higher proportion of smokers.
Table III shows the distributions of race and kidney variables. It can be seen that no significant difference
was found in serum creatinine between black, brown and white people, showing that in the Brazilian population
it’s not necessary race adjustment. In addition, it is worth
mentioning that only the moderate risk group presented a significant difference between eGFRCKD-EPI (without adjustment race) and race.
DISCUSSION
TABLE I - Demographic and clinic data of the diferent groups of patients, classiied according to FRS
Variables Total
(n=214)
Low risk group (n=77)
Moderate risk group (n=59)
High risk group
(n=78) p-value
Age, years 53±10 45±9 56±8* 59±7*§ <0.001
Sex male, n, % 105 (49.0) 28 (36.4) 21(35.6) 56 (71.8) <0.001
BMI, kg/m2 28.6±5.4 27.9±5.7 28.9±5.8 29.0±4.7 0.364
Self-deinition race 0.722
Black 19 (8.9) 5 (6.5) 5 (8.5) 9 (11.5)
Brown 85 (39.7) 29 (37.7) 23 (39.0) 33 (42.3)
White 110 (51.4) 43 (55.8) 31 (52.5) 36 (46.2)
Fasting blood glucose, mmol/L 6.10±2.86 5.40±2.31 6.42±2.83* 6.55±3.25* <0.001
Total cholesterol, mmol/L 4.98±1.40 5.06±1.45 4.94±1.33 4.92±1.41 0.774
HDL-cholesterol, mmol/L 1.05±0.32 1.23±0.32 1.01±0.28* 0.90±0.27* <0.001
LDL-cholesterol, mmol/L 3.06±1.21 3.07±1.30 3.06±1.16 3.05±1.17 0.981
Triglycerides, mmol/L 1.89±1.15 1.66±0.89 1.91±0.74† 2.10±1.55† 0.036
ALT, µKat/L 0.58±0.90 0.63±1.44 0.61±0.32 0.51±0.33 0.067
AST, µKat/L 0.51±0.28 0.49±0.29 0.55±0.24 0.52±0.29 0.070
Creatinine, mmol/L 75.02±15.81 72.56±15.67 74.02±16.16† 78.20±15.35†‡ 0.022
eGFRCKD-EPI, mL/min/1.73 m² 90.49±14.90 95.85±15.19 88.86±15.13† 86.43±13.19* <0.001
eGFRCKD-EPI (race adjustment),
mL/min/1.73 m² 91.81±16.18 96.80±15.70 90.30±17.89† 88.02±14.08
* 0.002
Diastolic pressure, mmHg 84±15 80±10 84±10† 89±19*§ <0.001
Systolic pressure, mmHg 137±25 125±15 131±18† 154±28*‡ <0.001
(*) compared with low risk group, p<0.001; (†) compared with low risk group, p<0.05; (‡) compared with moderate risk group, p<0.001; (§) compared with moderate risk group, p<0.05;BMI - Body Mass Index; HDL-cholesterol - High density lipoprotein; LDL-cholesterol - Low density lipoprotein; AST - aspartate aminotransferase; ALT - Alanine transaminase. Data are presented as mean ± standard deviation for parametric samples and percentage for non-parametric samples. Categorical variables were compared by Chi-square test. Parametric analysis was performed by one-way ANOVA followed by Tukey post hoc test. Non-parametric samples were performed by Kruskal-Wallis test followed by Mann Whitney test. P-values< 0.05 were considered statistically signiicant.
TABLE II ‑ Prevalence of traditional cardiovascular risk factors among the groups (FRS)
Variables Total
(n=214)
Low risk group (n=77)
Moderate risk group (n=59)
High risk group
(n=78) p-value
Obesity, n, % 76 (35.5) 23 (29.9) 25 (42.4) 28 (35.9) 0.236
Sedentary lifestyle, n, % 107 (50.0) 29 (37.7) 34 (57.6) 44 (56.4) 0.032
Smoking, n, % 30 (14.0) 3 (3.9) 9 (15.3) 18 (23.1) 0.003
Dyslipidemia, n, % 194 (90.6) 63 (81.8) 56 (94.9) 75 (96.2) 0.004
Diabetes mellitus, n, % 60 (28.0) 9 (11.7) 16 (27.1) 35 (44.8) <0.001
Hypertension, n, % 152 (71.0) 28 (36.4) 50 (84.7) 74 (94.9) <0.001
Antihypertensive, n, % 148 (69.2) 28 (36.4) 48 (81.4) 72 (92.3) <0.001
Categorical variables were compared by Chi-square test. P-values< 0.05 were considered statistically signiicant.
for increased cardiovascular risk. First, many of the traditional and nontraditional CVD risk factors that could
afect endothelial function, such as older age, smoking,
ventricular remodeling and cardiac dysfunction, because
it may alter sodium and luid transport and, therefore, alter
cardiac function (Jin et al., 2014). Elevated asymmetric dimethyl arginine, reduced nitric oxide bioavailability and endothelial dysfunction from renal disease, which are associated with atherosclerosis, are recognized as kidney-damaging factors and contribute to increasing CVD risk (Kielstein et al., 2002; Schifrin, Lipman, Mann, 2007).
Some studies have airmed that CKD is an independent
risk factor for developing CVD, therefore, subjects with CKD have higher cardiovascular risk (Chang, Kramer, 2011; Rule et al., 2013; Chia, Lim, Ching, 2015). Thus, it’s
suggested that with the decrease eGFR, these biological
efects should be occurring minimally, however enough
to increase cardiovascular risk.
This study demonstrated an inverse association between eGFR and cardiovascular risk in subjects without CKD, since individuals with higher cardiovascular risk had reduced eGFR, compared to other risk groups. This result is similar to recent studies which reported that subjects without renal dysfunction had a significantly higher cardiovascular risk (Jin et al., 2014; Wang et al.,
2014; Ito et al., 2015; Lu et al., 2016). In a cohort study,
an inverse correlation (R2 = -0.291, p<0.01) was found in
Japanese patients with obesity and type 2 diabetes without
severe renal dysfunction (Ito et al., 2015). In a Chinese
population, a longitudinal study conirmed a signiicant inverse association between eGFR and FRS (R² = -0.669
in 2008, R² = -0.698 in 2011, pall<0.01)(Jin et al., 2014).
Moreover, a signiicantly higher FRS was observed among
Chinese age 40 years or old with mildly decreased eGFR
(60-89 mL/min/1.73 m²) (Lu et al., 2016). However, there
are conlicting indings from community-based studies on
the association between mildly reduced eGFR and CVD, showing that eGFR is not independently associated with cardiovascular outcome in the general population(Smink
et al., 2012). The conlicting results can be explained by
diferences in study populations and the use of diferent formulas for the eGFR calculation, such as the MDRD
equation. The results from our study provide additional support for the hypothesis that eGFR could be an independent risk factor for CVD.
However, it is difficult confirm the association between decreased renal function and increased cardiovascular risk in the current study, once the participants were generally accompanied by several comorbidities, considered as cardiovascular risk factors
(Olechnowicz-Tietz et al., 2013). Hypertension and
TABLE III ‑ Distributions of races and kidney function among the groups (FRS)
Variables Black Brown White p-value
Total
Creatinine, mmol/L 73.05±18.60 73.84±14.09 76.27±16.59 0.478
eGFRCKD-EPI, mL/min/1.73 m² 96.03±16.00 91.50±15.91 88.75±13.68 0.104 eGFRCKD-EPI (adjustment race), mL/min/1.73 m² 110.89±18.46 *‡ 91.50±15.91 88.75±13.68 <0.001 Low risk group
Creatinine, mmol/L 77.79±17.00 70.72±16.54 73.19±15.11 0.731
eGFRCKD-EPI, mL/min/1.73 m² 94.92±15.94 99.22±16.92 93.68±13.77 0.316 eGFRCKD-EPI (adjustment race), mL/min/1.73 m² 109.60±18.39 99.22±16.92 93.68±13.77 0.056 Moderate risk group
Creatinine, mmol/L 60.11±17.00 74.18±14.54 76.14±16.57 0.128
eGFRCKD-EPI, mL/min/1.73 m² 110.42±13.85 *‡ 87.86±14.60 86.12±13.22 0.002 eGFRCKD-EPI (adjustment race), mL/min/1.73 m² 127.50±15.98 †§ 87.86±14.60 86.12±13.22 <0.001 High risk group
Creatinine, mmol/L 77.60±18.64 76.35±11.01 80.05±17.92 0.521
diabetes can afect renal iltration power and may enhance
urinary albumin leakage, and together are major risk factors for the development of endothelial dysfunction
and progression of atherosclerosis (Schiffrin, Lipman, Mann, 2007). In addition, in individuals with diabetes, the CKD-EPI equation presents poor performance
with pronounced underestimation, especially for high-normal eGFR, because it seems to be associated with
speciic characteristics of patients with diabetes, such as hyperglycemia, glomerular hyperiltration and obesity
(Silveiro et al., 2011).
Furthermore, age is the major confounding factor
contributing to increased FRS and decreased eGFR. In the CKD-EPI equation, age is used as a central component
to integrate muscle mass decrease with age, since the
GFR begins to decrease between 30 and 40 years old and
accelerate after 65-70 years old(Glassock, Rule, 2012).
The average decline in GFR has been estimated at 1 mL/ min/year (Bitzer, Wiggins, 2016). In addition, age is one
of major risk factors for CVD in healthy populations(Jin
et al., 2014).
Our results showed that there is no diference when
there is race adjustment. Barcellos et al. (2015) suggest that the inclusion of race adjustment in the eGFR is not necessary in the Brazilian population, because it did not contribute to more accurate results(Zanocco et al., 2012). Survival studies evidence that the populations of
diferent regions of Brazil are ancestrally more similar
than previously realized, and the results showed that the predominant ancestry was European (white color) with a
proportion around 60.1% in the Northeast Brazilian (Pena
et al., 2011; Zanocco et al., 2012). Therefore, the intense biological miscegenation could attenuate the possible
diference in the mean serum creatinine levels among races
(Barcellos et al., 2015). It’s important to realize that race
is equivalent of color in Brazil (in Portuguese, cor) and is based on a complex subjective phenotypic evaluation that includes skin pigmentation, hair pigmentation and type, eye melanization and facial features(Pena et al., 2011).
To the best of our knowledge, this is the irst study
to report the association between eGFR and Framingham risk score in Brazilian population without CKD. However, our study has several limitations that merit comment. First, our population was small and had few black participants which limits the generalizability of this study. Second, the eGFR alone is relatively insensitive to clinically relevant gradients of risk(Freire-Aradas et al., 2014). In
addition, our deinition of eGFR was limited to a single
measurement of serum creatinine on one occasion, not
measured during period ≥ 3 months(Andrew et al., 2005).
Finally, we did not have information on proteinuria and
albuminuria, which may be independent risk factors for CVD outcomes(Wang et al., 2014).
Although a single marker, our results indicate that the eGFR can identify CVD risk at an early stage. Also, the results confirm that it’s not necessary to use
race adjustment in the Brazilian population. More
investigations should be made in other populations.
REFERENCES
Andrew S, Levey KU, Tsukamoto Y, Levin A, Coresh J, Rossert J, et al. Deinition and classiication of chronic kidney disease: a position statement from kidney disease: improving global outcomes (KDIGO). Kidney Int. 2005;67(6):2089-100.
Barcellos RCB, Matos JPS, Kang HC, Rosa MLG, Lugon
JR. Comparison of serum creatinine levels in diferent color/
race categories in a Brazilian population. Cad Saúde Públ. 2015;31(7):1565-9.
Bitzer M, Wiggins J. Aging biology in the kidney. Adv Chronic Kidney Dis. 2016;23(1):12-8.
Chang A, Kramer H. Should Egfr and albuminuria be added to the Framingham risk score? Chronic kidney disease and cardiovascular disease risk prediction. Nephron Clin Pract. 2011;119(2):c171-8.
Chia YC, Lim HM, Ching SM. Use of Chronic kidney disease to enhance prediction of cardiovascular risk in those at medium risk. PLoS One. 2015;10(10):e0141344.
Culleton BF, Larson MG, Wilson PWF, Evans JC, Parfrey PS, Levy D. Cardiovascular disease and mortality in a community-based cohort with mild renal insufficiency. Kidney Int. 1999;56(6):2214-9.
D’Agostino RB, Vasan RS, Pencina MJ, Wolf PA, Cobain M, Massaro JM, et al. General cardiovascular risk proile for use in primary care: the Framingham heart study. Circulation. 2008;17(1):143-753.
Fontela PC, Winkelmann ER, Ott JN, Uggeri DP. Estimated glomerular filtration rate in patients with type 2 diabetes mellitus. Rev Assoc Med Br. 2014;60(6):531-7.
Friedewald WT, Levy RI, Fredrickson DS. Estimation of the concentration of low-density lipoprotein cholesterol in plasma, without use of the preparative ultracentrifuge. Clin Chem. 1972;18(6):499-502.
Glassock RJ, Rule AD. The implications of anatomical and functional changes of the aging kidney: with an emphasis on the glomeruli. Kidney Int. 2012; 82(3):270-7.
Ito R, Yamakage H, Kotani K, Wada H, Otani S, Yonezawa K.Comparison of cystatin-C and creatinine-based estimated glomerular filtration rate to predict coronary heart disease risk in Japanese patients with obesity and diabetes. Endoc J. 2015;62(2):201-7.
Jin B, Bai X, Han L, Liu J, Zhang W, Chen X. Association between kidney function and Framingham global cardiovascular disease risk score: a Chinese Longitudinal Study. PLoS One. 2014;9(1):e86082.
Kidney Disease: Improving Global Outcomes (KDIGO) CKD Work Group. KDIGO 2012 Clinical practice guideline for the evaluation and management of chronic kidney disease. Kidney Int. 2013;3(Suppl):1-150.
Kielstein JT, Boger RH, Bode-Boger SM, et al. Marked increase of asymmetric dimethylarginine in patients with incipient primary chronic renal disease. J Am Soc Nephrol. 2002;13(1):170-6.
Levey AS, Bosh JP, Lewis JB, Greene T, Rogers N, Roth D. A more accurate method to estimate glomerular iltration rate from serum creatinine: a new prediction equation. Ann Intern Med. 1999;130(6):461-70.
Levey AS, Stevens LA, Schimid CH, Zhang YL, Castro AF, Feldman HI, et al. A new equation to estimate glomerular iltration rate. Ann Intern Med. 2009;150(9):604-12.
Lu J, Mu Y, Su Q, Shi L, Liu C, Zhao J et al. Reduced kidney function is associated with cardiometabolic factors, prevalent and predicted risk of cardiovascular disease in Chinese adults: results from the REACTION Study. J Am Heart Assoc. 2016;5(7):e003328.
Matsushita K, Mahmoodi BK, Woodward M, Emberson JR, Jafar TH, Jee SH, et al. Comparison of risk prediction using the CKD-EPI equation and the MDRD Study equation for estimated glomerular iltration rate. JAMA. 2012;307(18):1941-51.
Olechnowicz-Tietz S, Gluba A, Paradowska A, Banach M, Rysz J. The risk of atherosclerosis in patients with chronic kidney disease. Int Urol Nephrol. 2013;45(6):1605-12.
Pena SD, Pietro G, Fuchshuber-Moraes M, Genro JP, Hutz MH, Kehdy S, et al. The genomic ancestry of individuals from diferent geographical regions of Brazil is more uniform than
expected. PLoS One. 2011;6(2):e17063.
Pereira JC, Barreto SM, Passos VMA. Perfil de risco cardiovascular e autoavaliação da saúde no Brasil: estudo de
base populacional. Rev Panam Salud Publ. 2009;25(6):491-8.
Rule AD, Bailey KR, Lieske JC, PeyserPA, Turner ST. Estimating the glomerular iltration rate from serum creatinine is better than from cystatin C for evaluating risk factors associated with chronic kidney disease. Kidney Int. 2013;83(6):1169-1176.
Sarnack MJ, Levey AS, Schoolwerth AC, Coresh J, Culleton V, Hamm LL, et al. Kidney disease as a risk factor for development of cardiovascular disease. Circulation. 2003;108:2154-69.
Schiffrin EL, Lipman ML, Mann JFE. Chronic kidney disease - effects on the cardiovascular system. Circulation. 2007;116(1):85-97.
Silveiro SP, Araújo GN, Ferreira MN, Souza FDS, Yamaguchi
HM, Camargo EG. Chronic kidney disease epidemiology
collaboration (CKD-EPI) equation pronouncedly underestimates glomerular iltration reate in type 2 diabetes. Diabetes Care. 2011;34(11):2353-5.
Smink PA, Heerspink HJL, Gansevoort RT, Jong PE, Hillege HL, Bakker SJL, et al. Albuminuria, estimated GFR, traditional risk factors, and incident cardiovascular disease: the PREVEND (Prevention of renal and vascular end stage disease) Study. Am J Kidney Dis. 2012;60(5):804-11.
Soares A, Eyf T, Campani R, Ritter L, Weinert L. Perfomance of the CKD epidemiology collaboration (CKD-EPI) and the modiication of diet in renal disease (MDRD) study equations in healthy south Brazilians. Am J Kidney Dis. 2010;55(6):1162-5.
Wang Y, Katzmarzyk PT, Horswell R, Zhao W, Johnson J, Hu G. Kidney function and the risk of cardiovascular disease in patients with type 2 diabetes. Kidney Int. 2014;85(5):1992-9.
Wang Y, Yan A, Yu C. Correlation between microalbuminuria
and cardiovascular events. Int J Clin Exp Med.
Xavier HT, Izar MC, Farias Neto JR, Assad MH, Rocha VZ, Sposito C et al. V Diretriz Brasileira de dislipidemias e prevenção de aterosclerose. Arq. Bras. Cardiol. 2013;101(4, Suppl 1):1-20.
Zanocco JA, Nishida SK, Passos MT, Pereira AR, Silva MS, Pereira AB, et al. Race adjustment for estimating glomerular filtration rate is not always necessary. Nephron Extra. 2012;2(1):293-302.
Received for publication on 30th March 2017