Betatrophin Levels were Increased in Pregnant
Women with or without Gestational Diabetes
Mellitus and Associated with Beta Cell Function
Níveis de betatro
fi
na aumentados em grávidas com ou
sem diabetes mellitus gestacional e associados à função
das células beta
Yun Huang
1Chen Fang
1Zhimin Ma
1Heming Guo
1Ruihua Wang
2Ji Hu
11Department of Endocrinology, The Second Affiliated Hospital of Soochow University, Suzhou, Jiangsu, China
2Department of Gynecology and Obstetrics, The Second Affiliated Hospital of Soochow University, Suzhou, Jiangsu, China
Rev Bras Ginecol Obstet 2016;38:287–292.
Address for correspondence Ji Hu, MD, PhD, Department of Endocrinology, The Second Affiliated Hospital of Soochow University, 1055 Sanxiang Road, Suzhou, Jiangsu, China (e-mail: [email protected]).
Keywords
►
gestational diabetes
mellitus
►
pregnancy
►
betatrophin
►
β
cell function
Abstract
Purpose
betatrophin has been reported to boost
β
cell expansion in insulin resistant
states. Pregnancy is a well-recognized physiological state of insulin resistance.
Betatrophin levels in pregnant women and their relationships with metabolic variables
remain to be elucidated.
Methods
A total of 49 pregnant women and 31 age-matched unpregnant women
with normal glucose regulation (UP-NGR) were included. Among these subjects,
according to results from 75 g oral glucose tolerance test (OGTT), 22 women were
diagnosed as having gestational diabetes mellitus (GDM).
Results
Our study found that pregnant women, regardless of their glucose regulation
status, had remarkably higher triglycerides (TG), total cholesterol (TC), fasting insulin
(FINS), homeostasis model assessment of insulin resistance (HOMA-IR) and
homeosta-sis model assessment of
β
-cell function (HOMA-
β
). However, GDM patients had much
lower HOMA-
β
compared with those of pregnant women with normal glucose
regulation (P-NGR). Participants of the P-NGR group had almost 4 times higher levels
of betatrophin than those of the UP-NGR group. Although betatrophin levels were
lower in the GDM group than those of the P-NGR group, the difference did not reach
statistical signi
fi
cance. Spearman correlation analysis showed that betatrophin levels
were positively and signi
fi
cantly associated with total cholesterol, triglycerides,
high-density lipoprotein cholesterol (HDL-c), FINS and HOMA-
β
. However, adjustments of
TC, TG and HDL-c eliminated the association between HOMA-
β
and betatrophin.
Conclusions
Pregnant women have signi
fi
cantly higher betatrophin levels in
com-parison to unpregnant women. Betatrophin levels are positively and signi
fi
cantly
received
December 21, 2015
accepted
May 3, 2016
DOIhttp://dx.doi.org/ 10.1055/s-0036-1584566.
ISSN 0100-7203.
Copyright © 2016 by Thieme Publicações Ltda, Rio de Janeiro, Brazil
Introduction
Betatrophin, (also known as angiopoietin-like protein 8 [ANGPTL8], lipasin, refeeding-induced fat and liver, and hepatocellular carcinoma-associated protein TD 26), a hormone primarily expressed in the liver and/or the adi-pose tissue, has been reported to promote pancreaticβcell proliferation and expandβ cell mass in insulin resistant mice.1 Most studies conducted with type 2 diabetic pa-tients found that betatrophin levels were significantly higher than those in healthy controls.2–6However, results from clinical studies regarding betatrophin levels in insu-lin resistant populations were not consistent.4,7 Fenzl et al7demonstrated that betatrophin levels did not differ between lean and morbidly obese participants. In contrast to their work, another study found that betatrophin levels were doubled in overweight subjects when compared with lean subjects.4
It has long been recognized that pregnancy is a physio-logical state of insulin resistance.8Studies regarding beta-trophin levels in pregnant women are limited. The study performed by Ebert et al9indicated that betatrophin levels were increased in women with gestational diabetes mellitus (GDM) when compared with healthy pregnant controls, but they failed to detect any relationships between insulin
resistance,βcell function, and betatrophin levels. Therefore, the purpose of the present study is to investigate the betatrophin levels in pregnant women with normal glucose regulation (P-NGR), patients of GDM, unpregnant women with normal glucose regulation (UP-NGR), and explore their relationships with metabolic traits.
Methods
Population
A total of 49 pregnant women (age range: 22–43 years) were recruited consecutively from the outpatient clinic of the department of endocrinology and obstetrics at the Second Affiliated Hospital to Soochow University in 2014. Thirty-one age-matched women (age range: 21–56 years) were re-cruited from the population that underwent a routine physi-cal examination. Subjects with prior history of diabetes were not included in the present study. The study protocol was approved by the Institutional Review Board of the Second Affiliated Hospital to Soochow University. Informed consent was obtained from each participant. The diagnosis of GDM was defined according to the American Diabetes Association (ADA) criteria.10Among these pregnant women, according to results from 75 g oral glucose tolerance test (OGTT), 22 were diagnosed as having GDM.
associated with
β
cell function and lipid levels. Furthermore, lipids may contribute to
the association between betatrophin and
β
cell function.
Resumo
Introdução
Betatro
fi
na tem sido relacionada à expansão de células
β
em estado de
resistência à insulina. A gravidez é um conhecido estado
fi
siológico de resistência à
insulina. Níveis de betatro
fi
na em gestantes e sua relação com variáveis metabólicas
ainda precisam ser esclarecidas.
Métodos
Um total de 49 gestantes e 31 não gestantes de mesma idade com níveis
normais de glicose (UP-NGR) foram incluídas. Dentre elas, de acordo com os resultados
da curva glicêmica, base em 75 g, 22 mulheres foram diagnosticadas com diabetes
mellitus gestational (DMG).
Resultados
Nosso estudo identi
fi
cou que gestantes, independente de seus níveis de
glicose, tiveram notáveis níveis elevados de triglicerídeos (TG), colesterol (TC), insulina
em jejum (FINS), HOMA-IR e HOMA-
β
. Contudo, pacientes com DMG tiveram bem
menos HOMA-
β
se comparadas às gestantes com níveis normais de glicose (P-NGR).
Participantes do grupo P-NGR tiveram níveis de betatro
fi
na quase quarto vezes maiores
ao das participantes do grupo UP-NGR. Embora os níveis de betatro
fi
na sejam menores
no grupo DMG do que no P-NGR, a diferença não obteve signi
fi
cância estatística.
Análise da correlação de Spearman demonstrou que os níveis de betatro
fi
na foram
positiva e signi
fi
cativamente associados ao TC, TG, HDL-c (high-density lipoprotein
cholesterol), FINS e HOMA-
β
. Contudo, ajustes em TC, TG e HDL-c eliminaram a
associação entre HOMA-
β
e betatro
fi
na.
Conclusões
Gestantes têm níveis de betatro
fi
na signi
fi
cativamente maiores do que
não gestantes. Níveis de betatro
fi
na são positive e signi
fi
cativamente associados às
células
β
funcionais e níveis de lipídeos. Além disso, lipídeos podem contribuir na
associação entre betatro
fi
na e células
β
funcionais.
Palavras-chave
►
diabetes mellitus
gestacional
►
gravidez
►
betatro
fi
na
Clinical and Biochemical Measurements
Three-point (0, 1 and 2 h) OGTT with a 75 g glucose load was performed in the pregnant women. Plasma glucose was measured using the glucose oxidase method on an autoan-alyser (Cobas 8000, Roche, Basel, Switzerland). Serum total cholesterol (TC), triglycerides (TG), high-density lipoprotein cholesterol (HDL-c), and low-density lipoprotein cholesterol (LDL-c) were measured on an automated biochemical analyzer (Cobas 8000, Roche, Basel, Switzerland). Fasting serum insulin (FINS) levels were measured using an immunoradiometric assay (Roche Diagnostics GmbH, Germany). Serum betatro-phin levels were measured using a commercially available enzyme-linked immunosorbent assay (ELISA) kit (Wuhan EIAab Science, Wuhan, China; catalogue No. E11644h).
Definitions
GDM was defined as meeting at least one of the following criteria: 1) fasting plasma glucose (FPG)5.1 mmol/L; 2) 1 hour post-load plasma glucose (1 h-PPG)10.0 mmol/L; and 3) 2 hour post-load plasma glucose (2 h-PPG)8.5 mmol/L. Normal glucose regulation was defined as without a history of diabetes, FPG <6.1 mmol/L and glycosylated hemoglobin
(HbA1c)<6.0% or FPG<6.1 mmol/L and 2h-PPG <7.8
mmol/L. The indices of homeostasis model assessment of insulin resistance (HOMA-IR) and of homeostasis model assessment of β-cell function (HOMA-β) were calculated using the following formulas: HOMA-IR¼FINS (mIU/L) FPG (mmol/L)/22.5 and HOMA-β ¼20FINS (mIU/L)/FPG (mmol/L) 3.5.
Body weight and height were measured in light clothes and without shoes to the nearest 0.1 kg and 0.5 cm, in the
NGR group respectively. Body mass index (BMI) was calcu-lated using the formula of weight/height2(kg/m2).
Statistical Analysis
Statistical analysis was performed using SAS 9.1 (SAS Insti-tute, Cary, NC, USA). Variables were presented as mean standard deviation (SD) or medians (interquartile ranges). Fasting serum triglyceride, FINS, HOMA-IR and HOMA-β were transformed logarithmically due to non-normal dis-tributions. Means of continuous variables were compared using the one-way analysis of variance (ANOVA).Spearman correlation and multivariable linear analyses were per-formed to evaluate the relationships between betatrophin levels and metabolic variables. The two-tailed test was used, and ap <0.05 was regarded as statistically significant.
Results
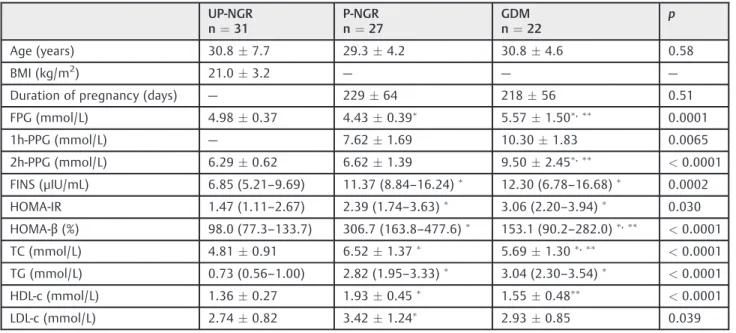
The present study population included three groups: UP-NGR, P-NGR and women with GDM. As shown in►Table 1, age and LDL-c levels did not differ among the three groups; whereas pregnant women, regardless of their glucose regu-lation status, had remarkably higher TG, TC, FINS, HOMA-IR and HOMA-βlevels when compared with those in the UP-NGR group (all p<0.05). HOMA-IR was not significantly
different between the P-NGR and GDM groups; however, GDM patients had much lower HOMA-β when compared with those of the P-NGR group (p<0.05). As for betatrophin
concentrations, subjects of the P-NGR group had almost 4 times more betatrophin than those of the UP-NGR group (1,513.6 [696.4–2,178.8] versus 283.3 [182.8–303.4] pg/mL,
Table 1 Clinical and metabolic characteristics of the study population
UP-NGR
n¼31
P-NGR
n¼27
GDM
n¼22
p
Age (years) 30.87.7 29.34.2 30.84.6 0.58
BMI (kg/m2) 21.0
3.2 — — —
Duration of pregnancy (days) — 22964 21856 0.51
FPG (mmol/L) 4.980.37 4.430.39
5.571.50,
0.0001
1h-PPG (mmol/L) — 7.621.69 10.301.83 0.0065
2h-PPG (mmol/L) 6.290.62 6.621.39 9.502.45, <0.0001
FINS (μIU/mL) 6.85 (5.21–9.69) 11.37 (8.84–16.24) 12.30 (6.78–16.68) 0.0002
HOMA-IR 1.47 (1.11–2.67) 2.39 (1.74–3.63) 3.06 (2.20–3.94) 0.030
HOMA-β(%) 98.0 (77.3–133.7) 306.7 (163.8–477.6)
153.1 (90.2–282.0) ,
<0.0001
TC (mmol/L) 4.810.91 6.521.37
5.691.30,
<0.0001
TG (mmol/L) 0.73 (0.56–1.00) 2.82 (1.95–3.33) 3.04 (2.30–3.54) <0.0001
HDL-c (mmol/L) 1.360.27 1.930.45 1.55
0.48 <0.0001
LDL-c (mmol/L) 2.740.82 3.421.24
2.930.85 0.039
Abbreviations: UP-NGR, unpregnant women with normal glucose regulation; P-NGR, pregnant women with normal glucose regulation; GDM, gestational diabetes mellitus; n, number; BMI, body mass index; FPG, fasting plasma glucose; PPG, post-load plasma glucose; FINS, fasting insulin; HOMA-IR, homeostasis model assessment of insulin resistance; HOMA-β, homeostasis model assessment ofβ-cell function; TC, total cholesterol; TG, triglycerides; HDL-c, high-density lipoprotein cholesterol; LDL-c, low-density lipoprotein cholesterol.
Notes: Data are meansstandard deviation (SD) or medians (interquartile ranges). Specific notes:p
p<0.0001, ►Fig. 1.). Although betatrophin levels were
much lower in the GDM group than in the P-NGR group, the difference did not reach statistical significance (1,024.3 [350.4–1,276.7] versus 1,513.6 [696.4–2,178.8] pg/mL,
p¼0.093).
We then investigated the relationships between betatro-phin and metabolic variables. Spearman correlation analysis revealed that betatrophin levels were positively and signifi -cantly associated with TC, TG, HDL-c, FINS, HOMA-IR and HOMA-β, but not with FPG and LDL-c (►Table 2). Further analysis regarding the effects of lipids on the relationships between betatrophin, FINS, HOMA-IR and HOMA-βshowed that the adjustment of TG, TC or HDL-c eliminated the association between betatrophin, FINS levels and HOMA-IR. In contrast, although the magnitude of the association
between betatrophin and HOMA-β decreased, it still per-sisted. Multiple linear regression revealed that betatrophin levels associated to HOMA-βin the model included age and duration of gestation as independent variables (βSEM: 0.450.14,p¼0.0021). Nevertheless, after introducing TC, TG and HDL-c into the model, the association disappeared (βSEM: 0.190.16, p¼0.24), whereas TG remained significant (βSEM: 0.390.18,p¼0.03).
Discussion
Our study showed that betatrophin levels were remarkably increased in pregnant women when compared with those of unpregnant women, and that they were positively associated withβcell function and lipid levels.
Betatrophin was found to be involved in the compensato-ry β cell proliferation in response to insulin resistance.1 Accumulating clinical studies investigated betatrophin levels in diabetic patients. Most studies conducted in type 2 diabetic patients found that betatrophin levels were in-creased and positively correlated with fasting glucose or FINS levels.2–6In contrast, circulating levels of betatrophin were significantly decreased or increased in obese partic-ipants.4,7Another study found that betatrophin levels did not differ between lean and morbidly obese participants.11 Pregnancy is a well-recognized physiological state of insulin resistance, during whichβcell mass increases to adapt to the progressive insulin resistance that develops. Betatrophin messenger RNA (mRNA) in the liver increased by 20-fold over the course of gestation in mice.1 However, results regarding betatrophin levels in pregnant women are limited.9,12 Our study demonstrated that the mean betatrophin levels in unpregnant women were 283.3 pg/
Table 2 Correlations between betatrophin, clinical and metabolic variables
r1 p1 r2 p2 r3 p3 r4 p4
Age (years) 0.0062 0.96
BMI (kg/m2) 0.049 0.80
Duration of pregnancy (days) 0.099 0.51
FPG (mmol/L) 0.20 0.072 0.098 0.41 0.11 0.34 0.083 0.48
2h-PPG (mmol/L) 0.19 0.15 0.13 0.36 0.18 0.18 0.20 0.14
FINS (μIU/mL) 0.30 0.0061 0.22 0.058 0.26 0.023 0.27 0.018
HOMA-IR 0.24 0.034 0.17 0.15 0.21 0.069 0.23 0.053
HOMA-β(%) 0.40 0.0003 0.25 0.035 0.29 0.013 0.28 0.016
TC (mmol/L) 0.32 0.0047 — —
TG (mmol/L) 0.39 0.0004 — —
HDL-c (mmol/L) 0.36 0.0012 — —
LDL-c (mmol/L) 0.15 0.20 — —
Abbreviations: BMI, body mass index; FPG, fasting plasma glucose; PPG, post-load plasma glucose; FINS, fasting insulin; HOMA-IR, homeostasis model assessment of insulin resistance; HOMA-β, homeostasis model assessment ofβ-cell function; TC, total cholesterol; TG, triglycerides; HDL-c, high-density lipoprotein cholesterol; LDL-c, low-density lipoprotein cholesterol.
Notes: r1: unadjusted correlation coefficients;p1: unadjustedpvalues; r2: correlation coefficients adjusted for triglycerides;p2:pvalues adjusted for triglycerides; r3: correlation coefficients adjusted for total cholesterol;p3:pvalues adjusted for total cholesterol; r4: correlation coefficients adjusted for HDL cholesterol;p4:pvalues adjusted for HDL cholesterol.
mL, which was comparable to those measured by EIAab kits (Wuhan EIAab Science, Wuhan, China) from other stud-ies.5,13Compared with unpregnant women, pregnant wom-en had 3–4 fold higher betatrophin levels; although the GDM group had lower levels of betatrophin, the difference did not reach statistical difference. In contrast, a recent study showed that betatrophin levels (measured by Phoenix kits
— Phoenix Pharmaceuticals, Burlingame, CA, USA) were increased in women with GDM when compared with those of healthy pregnant controls.9When interpreting the dis-crepancies in results measured by ELISA method, betatro-phin proteolytic regulation should be taken into consideration.14 EIAab and Phoenix kits recognize the N-terminus and C-terminus of betatrophin respectively. N-terminal kit measures the full length protein, while C-terminal kit measures total betatrophin species, including both full-length protein and C-terminal fragment. Fu et al14 compared betatrophin levels in lean and obese participants with these two kits; however, results turned out to be contrary. Whether full-length or C-terminal fragment are functional in certain physiological or pathological conditions is unknown, as we noticed that most discrepancies were detected in insulin resistant populations, including obese and pregnant popula-tions. Further studies focusing on the functions of full-length protein and C-terminal fragments are needed.
As expected, FINS, HOMA-IR and HOMA-β were much higher in pregnant women in comparison to unpregnant women. In addition, in pregnant women, compared with normoglycemic pregnant women, GDM patients had signifi -cantly lower HOMA-β, which was consistent with the notion that GDM occurs whenβcell proliferation cannot compen-sate the increased demand of insulin. Yi et al1indicated that increased expression of betatrophin could expandβcell mass and improve glucose tolerance.1Hence, a positive association between betatrophin andβcell function can be speculated. In accordance with the speculation, correlation analysis also revealed that betatrophin levels were positively related to βcell function.
Absence of ANGPTL8 (betatrophin) was found to pro-foundly disrupt TG metabolism and inhibit lipoprotein lipase.15,16However, results from clinical studies were not consistent. Significant associations between TG, TC, HDL-c and betatrophin levels are found in the present study, which were in line with previous studies.7,15,16 In contrast, two recent studies failed to detect the association between betatrophin and lipid levels.9,12Interestingly, we also ob-served that adjustments for TG, HDL and TC could eliminate the association between betatrophin and β cell function, while TG remained independently related to betatrophin, which implied that lipids might contribute to the association. Thefinding is in line with the notion that betatrophin can affect TG metabolism but not glucose homeostasis.15,16
Some limitations of the present study are also note-worthy. The main one is cross-sectional and with a relatively small number of participants. A prospective study that includes pregnant women with normal glucose regulation in their second trimester is in progress. Sec-ondly, the HbA1c level was not measured in every
partic-ipant, so data regarding it were not presented. Thirdly, although HOMA-βis a well-established surrogate index of βcell function, more precise measurements, including the hyperinsulinemic euglycemic clamp technique, should be used in future studies.
In conclusion, we indicated that betatrophin levels were remarkably higher in pregnant women when compared with those in unpregnant women. Betatrophin levels were posi-tively and significantly associated withβ cell function and lipid levels. Furthermore, the association between betatro-phin andβcell function might be largely dependent on lipid levels.
Author Disclosure Statement
None.
Note
Yun Huang and Chen Fang contributed equally to this work.
Acknowledgments
We are grateful to all the patients and volunteers who participated in this study. The work is supported by the grants from the National Natural Science Foundation of China (No. 81502865), the Natural Science Foundation of Jiangsu Province (No. SBK201340560), and the Natural Science Foundation for Colleges and Universities in Jiangsu Province (No. 13KJB320017).
References
1 Yi P, Park JS, Melton DA. Betatrophin: a hormone that controls pancreaticβcell proliferation. Cell 2013;153(4):747–758 2 Chen X, Lu P, He W, et al. Circulating betatrophin levels are
increased in patients with type 2 diabetes and associated with insulin resistance. J Clin Endocrinol Metab 2015;100(1): E96–E100
3 Espes D, Martinell M, Carlsson PO. Increased circulating betatro-phin concentrations in patients with type 2 diabetes. Int J Endocrinol 2014;2014:323407
4 Fu Z, Berhane F, Fite A, Seyoum B, Abou-Samra AB, Zhang R. Elevated circulating lipasin/betatrophin in human type 2 diabetes and obesity. Sci Rep 2014;4:5013
5 Hu H, Sun W, Yu S, et al. Increased circulating levels of betatrophin in newly diagnosed type 2 diabetic patients. Diabetes Care 2014; 37(10):2718–2722
6 Xie X, Gao T, Yang M, et al. Associations of betatrophin levels with irisin in Chinese women with normal glucose tolerance. Diabetol Metab Syndr 2015;7:26
7 Fenzl A, Itariu BK, Kosi L, et al. Circulating betatrophin correlates with atherogenic lipid profiles but not with glucose and insulin levels in insulin-resistant individuals. Diabetologia 2014;57(6): 1204–1208
9 Ebert T, Kralisch S, Wurst U, et al. Betatrophin levels are increased in women with gestational diabetes mellitus compared to healthy pregnant controls. Eur J Endocrinol 2015;173(1):1–7
10 American Diabetes Association. Diagnosis and classification of diabetes mellitus. Diabetes Care 2013;36(Suppl 1):S67–S74 11 Gómez-Ambrosi J, Pascual E, Catalán V, et al. Circulating
betatrophin concentrations are decreased in human obesity and type 2 diabetes. J Clin Endocrinol Metab 2014;99(10): E2004–E2009
12 Yilmaz H, Cakmak M, Darcin T, et al. Retraction: Elevated plasma levels of betatrophin in women with gestational diabetes melli-tus. Exp Clin Endocrinol Diabetes 2015;123(6):376–381
13 Espes D, Lau J, Carlsson PO. Increased circulating levels of beta-trophin in individuals with long-standing type 1 diabetes. Dia-betologia 2014;57(1):50–53
14 Fu Z, Abou-Samra AB, Zhang R. An explanation for recent dis-crepancies in levels of human circulating betatrophin. Diabeto-logia 2014;57(10):2232–2234