www.jped.com.br
ORIGINAL
ARTICLE
Reference
curves
of
the
body
fat
index
in
adolescents
and
their
association
with
anthropometric
variables
夽
Renata
Rago
Frignani
a,
Maria
Aparecida
Zanetti
Passos
a,
Gerson
Luis
de
Moraes
Ferrari
a,b,∗,
Sheila
Rejane
Niskier
a,
Mauro
Fisberg
a,
Isa
de
Pádua
Cintra
aaDivisionofAdolescentMedicine,CentrodeAtendimentoeApoioaoAdolescente(CAAA),DepartmentofPediatrics,
UniversidadeFederaldeSãoPaulo(UNIFESP),SãoPaulo,SP,Brazil
bCentrodeEstudosdoLaboratóriodeAptidãoFísicadeSãoCaetanodoSul(CELAFISCS),SãoPaulo,SP,Brazil
Received26March2014;accepted15July2014 Availableonline2December2014
KEYWORDS
Adolescents; Sexualmaturation; Fat;
Skinfolds
Abstract
Objectives: Todevelopreferencecurvesforthebodyfatindex(BFI)inthepediatricpopulation, inadolescentsfromthecityofSãoPaulo,Brazil,andverifytheirassociationwithbodymass indexandbodyfatpercentage.
Methods: Thestudyispartoftheresearchproject‘‘NutritionalProfile ofAdolescentsfrom PublicandPrivateSchoolsofSãoPaulo’’thatwas performedin2004-2005.Atotalof4,686 adolescents(2,130boysand2,556girls)aged10-15yearsweredividedintotwogroups: 10-12and13-15yearsofage.Bodymass,height,bodymassindex,hipcircumference,bodyfat percentage,bodyfatindex,andsexualmaturationperformedbytheself-assessmentmethod (prepubertal,pubertal,andpostpubertal)wereanalyzed.ANOVAwas performed,aswellas percentiledistribution,Pearson’scorrelation,andBland-Altmanplot.
Results: Inboys,therewasanincreaseinbodymass,height,bodymassindex,andhip circum-ferencewithadvancingageandTannerstage.Ingirls,therewasanincreaseinbodyfatindex andbodyfatpercentagewithadvancingageandstageofsexualmaturation.Anassociationwas foundbetweenbodyfatindexandbodymassindex(r=0.67inboysand0.80ingirls,p<0.001) andbodyfatpercentage(r=0.71inboysand0.68ingirls,p<0.001).
Conclusion: Thebodyfatindexseemstoreflectwellthephenomenaofsexualdimorphismin adolescence,iseasytoperform,andrepresentsamethodthatshouldbeusedinpopulation samples.
©2014SociedadeBrasileiradePediatria.PublishedbyElsevierEditoraLtda.Allrightsreserved.
夽
Pleasecitethisarticleas:FrignaniRR,PassosMA,FerrariGL,NiskierSR,FisbergM,dePáduaCintraI.Referencecurvesofthebodyfat indexinadolescentsandtheirassociationwithanthropometricvariables.JPediatr(RioJ).2015;91:248---55.
∗Correspondingauthor.
E-mail:[email protected](G.L.d.M.Ferrari).
http://dx.doi.org/10.1016/j.jped.2014.07.009
PALAVRAS-CHAVE
Adolescentes; Maturac¸ãosexual; Adiposidade; Pregascutâneas
Curvasdereferênciadoíndicedeadiposidadecorporaldeadolescentesesuarelac¸ão comvariáveisantropométricas
Resumo
Objetivos: Desenvolvercurvasdereferênciadoíndicedeadiposidadecorporalparapopulac¸ão pediátrica,em adolescentesdacidadedeSãoPaulo,Brasil,everificarasuarelac¸ãocomo índicedemassacorporalepercentualdegorduracorporal.
Métodos: Oestudo fazpartedoprojeto depesquisa‘‘PerfilNutricionaldeAdolescentesde escolasPúblicasePrivadasdeSãoPaulo’’realizadoem2004/2005.4.686adolescentes(2.130 meninos e 2.556 meninas) de 10-15 anos foram divididos em dois grupos: 10-12 e 13-15 anos.Massacorporal,estatura,índicedemassacorporal,circunferênciadequadril, porcent-agemdegorduracorporal,índicedeadiposidadecorporalematurac¸ãosexualrealizadapelo métododeautoavaliac¸ão(pré-púbere,púbereepós-púbere)foramanalisadas.FoifeitoANOVA, distribuic¸ãopercentilar,correlac¸ãodePearsoneográficodeBland-Altman.
Resultados: Nosmeninos,ocorreuaumentodamassacorporal,estatura,índicedemassa cor-poral ecircunferênciadoquadrilcomoavanc¸odaidade eestágiodeTanner.Nasmeninas, ocorreuaumentodoíndicedeadiposidadecorporaledopercentualdegorduracorporalcom oavanc¸odaidadeeestágiodematurac¸ão.Foiencontradaumaassociac¸ãoentreoíndicede adiposidadecorporalcomoíndicedemassacorporal(r=0,67nosmeninose0,80nasmeninas; p<0,001)ecomopercentualdegordura(r=0,71nosmeninose0,68nasmeninas;p<0,001). Conclusão: Oíndicedeadiposidadecorporalparecerefletirbemosfenômenosdodismorfismo sexualnaadolescência,sendoummétododefácilrealizac¸ãoquedeveriasermaisutilizadoem amostraspopulacionais.
©2014SociedadeBrasileiradePediatria.PublicadoporElsevierEditoraLtda.Todososdireitos reservados.
Introduction
Inrecentdecades,theprevalenceof overweightand obe-sityhasincreasedalarminglyworldwide,whichisconsidered apublichealth problem.1,2 The periodof greatestriskfor
theincidenceof obesity isthetransition between
adoles-cenceandtheearlystagesofadulthoodinbothgendersand
several ethnic groups,3 in additionto also representing a
majorriskfactor forcardiovasculardisease.4 Althoughthe
clinicalmanifestationsofthesediseasesoccurinadulthood,
studieshaveshownthatcomorbiditiessuchasdyslipidemia,
hypertension, and insulin resistance may be present as
earlyasinchildhoodandadolescence,4andareresponsible
for the increasedrisk of morbidity and mortalityin adult
life.5
In addition to increasing the chances of obesity in
adulthood,3,4 the strong association of excess weight in
childhood with metabolic alterations (lipid profile and
blood pressure) has resulted in the development of
sev-eraltechniques(hydrostaticweighinganddual-energyX-ray
absorptiometry)toaccuratelydeterminebodyfat;however,
mostmethodsarecomplex,timeconsuming,andexpensive
toberoutinelyapplied.6,7Thus,anthropometricassessment
constitutesanimportantdiagnosticmethod,asitiseasyto
perform,inexpensive,noninvasive, universallyapplicable,
hasgoodacceptancebythe population,andis universally
acceptedandproposedbytheWorldHealthOrganization.8,9
Inadditiontothemeasurementofbodyweightandbodyfat
percentage (BF%),the body mass index (BMI)is themost
commonlyusedapproachtocharacterizeobesityin
individ-ualsubjects.7---9
AlthoughtheBMIisusedtocharacterizebodygrowthof
children,thismeasureisroutinelyapplied,notonlyin
epi-demiologicalstudies,butalsoinclinicalpractice.1,9,10When
usedindiscriminately,itcanleadtofalseresults,asitisa
stillcontroversialmeasure,inadditiontothefactthatitis
particularlydifficulttodeterminebodyfatinchildren.10,11
Bergman et al. proposed the Body Fat Index (BFI) for
adults,anewparametertoassessbodycompositionbased
ontwoanthropometricmeasures,botheasilyreproducible
-height,inmeters,andhipcircumference(HC),incm.7The
BFIhasbeen developedandappliedin adultsfrom
differ-entcountries,6,7 but this index is still scarcelyapplied in
Brazilianadolescents.
Thus,theaimofthisstudywastodevelopBFIreference
curvesforthepediatricpopulation,usingadolescentsliving
inthecityofSãoPaulo,Brazilasmodels,aswellasverify
theirassociationwithBMIandBF%.
Methods
Studypopulationandschoolsampling
The study evaluated adolescents who were enrolled between the fifth and eighth grades from 43 randomly selectedpublicandprivateschools.Randomization consid-eredthenumberofpublicandprivateschoolsineachregion, containing at least 200 students from the fifth to eighth gradeattendingthemorningand/orafternoonshifts,anda 2:1relationofproportionality wasverifiedbetweenthem. DuethedifficultyinagreeingtoapplytheTannerstagesby theprivateschoolsandasthisinformationwasimportantfor theresearch,thefinalproportionwas4:1publictoprivate schools,representing a lossof 28%. These wererandomly selectedin 31 schools (25 public and6 private) fromthe fourregions(north,south,east,andwest)ofthecityofSão Paulo,Brazil.
This study sample was constituted by analyzing a database consisting of more than 8,020 students of both genderswhohadtomeet the followinginclusion criteria: (a)havecompletedemographicandclinicaldataavailable forthestudy(b)agebetween10and15years;(c)be regu-larlyenrolledinapublicorprivateschoolinthecityofSão Paulo;(d)andhaveaninformedconsentsignedbyaparent orguardian.ThestudyprotocolwasapprovedbytheEthics CommitteeofUNIFESP,protocolNo.0977/03.Pregnant ado-lescentswereexcludedfromthestudy.
This study included 4,686 adolescents,of whom 45.5% (n=2,130)weremalesand54.5%(n=2,556)werefemales, agedfrom10yearsandonedayto15years,11monthsand29 days,representingasamplingfractionof1.3%ofthe360,000 studentsenrolledinpublicandprivateschoolsinSãoPaulo. Noformulawasusedtoestimatethesamplesize,asa prob-abilisticapproachwasused.Datawerecollectedbetween Septemberof2004andJuneof2005.
Theagedistributionamongthefemaleandmalestudents wasrespectively,asfollows:646and554agedbetween10 and11years;1,308and1,053agedbetween12and13years; and602and523agedbetween14and15years.
Anthropometricmeasurements
Ateamoffourtrainedresearcherscoordinatedthe perfor-manceofallmeasurements;theteamwastrainedregarding thetechniquesandthestandardizationofthemethodsused, inordertoachievegreateraccuracyofthecollecteddata.
Body mass was measured on a portable digital scale (Seca®,CA,USA)withcapacityof150kg.Adolescentswere
weighedonthecenteroftheplatform,inthestanding posi-tion,facingthefront,withlateralspacingbetweenthefeet andthebodyweightevenlydistributedbetweenthefeet, barefoot,wearinglightclothing,andsteadywiththearms alongsidethebody.12
Heightwasdeterminedusingadigital wallstadiometer
(Seca®,CA,USA),withtheadolescentbarefootorwearing
thinsocks and light clothes, so that the body positioning
couldbe seen by the examiner. The adolescent stood on
a flat surface withthe weightdistributed evenly on both
feet, withthe eyesperpendicular to the body. The arms
were positionedalongside the body, and the head, back,
andbuttockswereincontactwiththeverticalplate. The
measurementwasmadeduringadeepinspirationwiththe
bodyfullyerect.12
BMI wascalculated by dividing weight in kilograms by
height in square meters(kg/m2), according tothe curves
proposedbytheWorldHealthOrganization (WHO)for age
andgender.9Thisclassificationhasbeenusedtoidentifythe
riskortheactualconditionofobesityinpopulations.7---9
Aninelasticmeasuringtape(Seca®,CA,USA)wasused
to measure the HC,while the adolescent maintained the
feet together and with the weight distributed evenly on
bothfeet.Themeasurementwasperformedontheareaof
greatestglutealcircumference.13BothHCandheightwere
measured three times, consecutively, and the arithmetic
meanwasconsideredasthefinalvalue.Basedonthesetwo
measurementsmentioned above,theBFI wasobtained by
dividingtheHCbyheightmultipliedbythesquarerootof
height,minus18:7
BFI= HC
heightheight−18
TocalculateBF%,measurementsofthetriceps skinfold
thickness(TST),atthepointthatcompriseshalfthedistance
betweenthesuperolateralborderoftheacromionandthe
olecranon,andofthesubscapularskinfoldthickness(SST),
performedobliquelyinrelationtothelongitudinalaxisand
located2cmbelowtheinferiorangleofthescapula,were
obtained, using the equations of Slaughter et al.14 When
interpretingtheresults,bodyfatvaluesproposedbyLohman
etal.wereconsideredacceptable.15
Sexual maturation was determined based on Tanner
pubertal staging,16 using the previously validated17
self-ratingtechnique for breast development(B1, B2,B3,B4,
andB5)forgirlsandgenitalia(G1,G2,G3,G4,andG5)for
boys, withresults grouped intoprepubertal (M1and G1),
pubertal(M2toM4andG2toG4),andpostpubertal(M5and
G5).
Forcalculation purposes,the adolescentsweredivided
accordingtothebiologicalageas:earlyadolescence:10-12
years,middleadolescence13-15years.18
Statisticalanalysis
Mean descriptive analysis and standard deviation were used.Normalityofcontinuousdatawasevaluatedusingthe Kolmogorov-Smirnovtest.Tocomparethegenderswiththe dependentvariables(bodymass,height,BMI,HC,BFI,and BF%), analysis of variance with two factors (gender with chronologicalandbiologicalage)wasapplied,followedby theBonferronimultiplecomparisonmethod.19
TodevelopBFIreferencecurves,theageofthe
adoles-centswasusedincentesimalformandtheLMSmethodwas
usedtodefinethedistributionandcutoffsofBFIaccording
togender,withthefollowingpercentilevalues:3,5,10,15,
25,50,75,85,90,95,and97.20
The Bland-Altman scatter-plot was used to verify the
absolute agreementbetween BFI and BMIand BF%.21 This
procedureallowsvisualizingthemeandifferencesandthe
extremelimitsofagreement,incaseoftwostandard
devia-tionsofdifference.Thus,theBland-Altmanscatterplotcan
provideusefulinformationregardingtherangesofvaluesfor
whichthetwomethodsaremoreconcordant/discordant.21
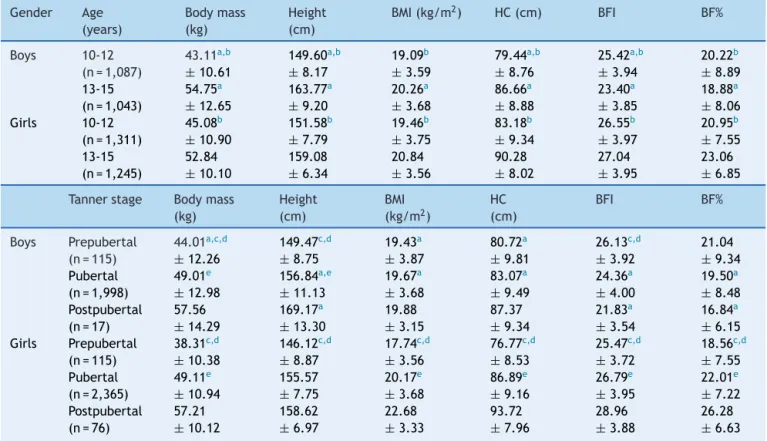
Table1 Samplesize,mean,andstandarddeviationforbodymass,height,BMI,HC,BFI,andBF%ofadolescentsinSãoPaulo accordingtoageandTannerstage.
Gender Age (years) Bodymass (kg) Height (cm)
BMI(kg/m2) HC(cm) BFI BF%
Boys 10-12 (n=1,087)
43.11a,b ±10.61 149.60a,b ±8.17 19.09b ±3.59 79.44a,b ±8.76 25.42a,b ±3.94 20.22b ±8.89 13-15
(n=1,043)
54.75a ±12.65 163.77a ±9.20 20.26a ±3.68 86.66a ±8.88 23.40a ±3.85 18.88a ±8.06 Girls 10-12
(n=1,311)
45.08b ±10.90 151.58b ±7.79 19.46b ±3.75 83.18b ±9.34 26.55b ±3.97 20.95b ±7.55 13-15
(n=1,245)
52.84 ±10.10 159.08 ±6.34 20.84 ±3.56 90.28 ±8.02 27.04 ±3.95 23.06 ±6.85
Tannerstage Bodymass (kg)
Height (cm)
BMI (kg/m2)
HC (cm)
BFI BF%
Boys Prepubertal (n=115)
44.01a,c,d ±12.26 149.47c,d ±8.75 19.43a ±3.87 80.72a ±9.81 26.13c,d ±3.92 21.04 ±9.34 Pubertal
(n=1,998)
49.01e ±12.98 156.84a,e ±11.13 19.67a ±3.68 83.07a ±9.49 24.36a ±4.00 19.50a ±8.48 Postpubertal
(n=17)
57.56 ±14.29 169.17a ±13.30 19.88 ±3.15 87.37 ±9.34 21.83a ±3.54 16.84a ±6.15 Girls Prepubertal
(n=115)
38.31c,d ±10.38 146.12c,d ±8.87 17.74c,d ±3.56 76.77c,d ±8.53 25.47c,d ±3.72 18.56c,d ±7.55 Pubertal
(n=2,365)
49.11e ±10.94 155.57 ±7.75 20.17e ±3.68 86.89e ±9.16 26.79e ±3.95 22.01e ±7.22 Postpubertal
(n=76)
57.21 ±10.12 158.62 ±6.97 22.68 ±3.33 93.72 ±7.96 28.96 ±3.88 26.28 ±6.63
BMI,bodymassindex;HC,hipcircumference;BFI,bodyfatindex;BF%,bodyfatpercentage. a p<0.05differencesbetweenthegenders.
b p<0.05differencesbetweenage.
c p<0.05differencesbetweenprepubertalandpubertal. d p<0.05differencesbetweenprepubertalandpostpubertal. e p<0.05differencesbetweenpubertalandpostpubertal.
betweenBFIwithBMIandBF%.The calculationswere per-formed usingthe SPSS,release20.0 (IBM Corp,2011. IBM SPSSStatisticsforWindows,NY,USA)andthelevelof signif-icancewassetatp<0.01.19
Results
SamplecharacterizationisshowninTable1,accordingtothe
analyzedvariables.Itispossibletoverifythatboysshowed
anincreaseinbodymass,height,BMI,andHCwithadvancing
ageandTannerstage.Asforthegirls,thesameoccurredfor
allvariablesanalyzedinthepresentstudy.
Regardinggender(Table1),itcanbeobservedthatthe
younger boys (10-12 years) had significantly lower mean
bodymass,height,HC,andBFIthangirlsof thesameage
(p<0.001).Amongtheolderadolescents(13-15years),this
occured for all variables (p<0.001). In both genders, the
youngeradolescentshadsignificantlydifferentmeanvalues
whencomparedtoolder ones (p<0.001),for allanalyzed
variables.
Table 1 results showed that, in the comparative
anal-ysis between the genders, the prepubertal adolescents
showedasignificantdifferencein bodymass,BMI,andHC
(p<0.001).Inpubertaladolescents,onlybodymassdidnot
differbetweengenders(p=0.06).As forthepostpubertal,
onlyheight,BFI,andBF%valueswerestatisticallydifferent
(p<0.001).
WhencomparingTannerstages,prepubertalboyshad
sig-nificantlylowermeanvaluesthanpubertalandpostpubertal
boysforbodymass,height,andBFI.Whencomparing
puber-talwithpostpubertalboys,meanvaluesinboyswere
signi-ficantlylowerregardingbodymassandheight(p<0.001).
Prepubertalgirlshadsignificantlylowermeanvaluesthan
pubertalandpostpubertalgirlsforallvariables(p<0.001).
Whencomparingmeanvaluesofpubertalwithpostpubertal
girls,onlyheightshowednosignificantdifference(p=0.08).
Table 2establishes the percentiles ofBFI classification
accordingtoageandTannerstageoftheadolescents.Itwas
observedthatbetweengenders,thedifferenceinvaluesin
adolescentsaged10-12 years is lowerthan in those aged
13-15years.
Itcanbeobservedthat,inthecomparisonbetween
gen-ders,fromthe3rd percentiletothe75th percentile,there
wasan increase in the differenceof valuesas thesexual
developmentstageadvanced.Fromthe85thpercentile,
pre-pubescent boys had higher values than girls of the same
classification.
It can be demonstrated that BFI behavior is different
Table2 BFIaccordingtothepercentile,gender,age,andTannerstageofadolescentsinSãoPaulo,aged10-15years.
Gender Age (years)
3% 5% 10% 15% 25% 50% 75% 85% 90% 95% 97%
Boys 10-12 (n=1,087)
19.50 19.98 21.02 21.71 22.67 24.75 27.60 29.28 30.87 32.92 34.20
13-15 (n=1,043)
17.39 18.00 19.13 19.67 20.70 22.88 25.50 27.47 28.64 30.81 32.41
Girls 10-12 (n=1,311)
20.46 21.20 22.08 22.75 23.95 26.01 28.58 30.63 31.89 33.97 35.48
13-15 (n=1,245)
20.55 21.31 22.49 23.28 24.41 26.72 29.16 30.57 31.89 34.26 36.06
Gender Tanner stage
3% 5% 10% 15% 25% 50% 75% 85% 90% 95% 97%
Boys Pre (n=115)
19.62 20.28 21.85 22.34 23.22 25.73 29.09 30.31 32.01 33.48 34.76
Pubertal (n=1,998)
18.09 18.88 19.78 20.51 21.60 23.77 26.69 28.36 29.74 32.10 33.04
Post (n=17)
15.58 15.58 17.05 17.70 19.13 22.50 24.85 26.35 26.93 -
-Girls Pre (n=115)
20.56 20.94 21.51 22.10 22.94 25.09 27.26 28.87 29.84 32.23 33.36
Pubertal (n=2,365)
20.49 21.23 22.27 23.02 24.21 26.35 28.91 30.52 31.87 34.22 35.62
Post(n=76) 23.75 24.28 24.84 25.19 26.48 28.15 31.07 32.94 33.26 36.63 40.02
BFI,bodyfatindex;Pre,prepubertal;Post,postpubertal.
decreasewithadvancingage andthemeanvalues ingirls showedaslightincreasewithadvancingage(Fig.1).
Regardingtheassociationbetweenvariables,Fig.2shows
asignificantassociationofBFIwithBMIandBF%of
adoles-centsof bothgenders inthe city ofSãoPaulo (p<0.001).
Furthermore,Fig.2showstheBland-Altmanplotwithhigh
agreementofBFIwithBMIandBF%inbothgenders.Inmales,
themeandifference(BFI-BMI)wasequalto4.73±3.21,with
limitsofagreementrangingfrom11.03(+2SD)to-1.57
(-2 SD). As for BF%-BFI, the mean difference wasequal to
-4.83±6.37,withlimitsofagreementrangingfrom7.66(+
2SD)to-17.31(-2SD)(Fig.2:A,B).
For the female gender, the mean difference (BFI-BMI)
wasequalto6.65±2.43,withlimitsofagreementranging
from 11.40 (+ 2 SD) to 1.90 (-2 SD). As for BF%-BFI, the
mean differencewasequal to-4.81±5.43, withlimits of
agreement ranging from 5.84 (+ 2 SD) to -15.46 (-2 SD)
(Fig.2:C,D).
Discussion
ThisstudypresenteddataandpercentilecurvesfortheBFI ofadolescentsaged10-15years,withheightandhip circum-ference used for thisevaluation. Although this technique hasbeenvalidatedandfoundtobeextremelyusefulin epi-demiologicalstudiesofadultsduetoitseaseofuseandlow cost, Bergman etal. 7 highlight a prediction error of 3%.
BFIisadirectestimateofBF%,andunlikeBMI,BFIprovides
Boys
Age (years) Age (years)
BFI BFI
Girls 40
35
30
25
20
15
10
10 11 12 13 14 15
97 95 90 85 75 50 25 15 10 5 3
97 95 90 85 75 50 25 15 10 5 3
40
35
30
25
20
15
10 11 12 13 14 15
r=0.67 (p<.001) 20
15
10
20
15
+2DP=11.03
–2DP=1.57 Average=4.73
+2DP=7.66
–2DP=17.31 Average=4.83
+2DP=5.84
–2DP=15.46 Average=4.81 +2DP=11.40
+2DP=1.90 Average=6.65
10
5
–5
–10
–15
15
10
5
–5
–10
–15
–20
–25 0 –20
–25 0 5
–5
–10 12
15 10 15 20 25 30 35 40 45
15 20 25 30 35 40 45
10
20 25 30 35 40
17 22 27 32 37
0
20
15
10
5
–5
–10 0
r=0.80 (p<.001) r=0.68 (p<.001)
Boys
Girls
BF% + BFI
BFI - BMI
BFI - BMI
(BF% + BFI)/2 (BF% + BFI)/2
(BFI+ BMI)/2 (BFI + BMI)/2
BF% + BFI
r=0.71 (p<.001)
A
C
B
D
Figure2 Bland-AltmanplottoassessthedegreeofagreementofBAIwithBMIandBF%ofadolescents(Boys:A,B;Girls:C,D) fromSãoPaulo,aged10-15years.
BF%datawithoutstatisticalcorrectionanddoesnotrequire bodymassmeasurement.7
BFI valuescan beused in obesity prevention asa tool
forspecificevaluation,whereasBMIonlyrepresentsagross
valueforbodyfatwithoutgenderandpubertalstage
differ-entiation,whichcouldeasilyleadtomisclassification.22
The present study showed that in adolescence (10-12
yearsand13-15years),statisticaldifferenceswereobserved
betweengenderandagegroupconcerningBMI,BFI,andBF%.
However,inmid-adolescence (13-15years),although boys
aretallerandhavegreaterbodymass,theyhavelowerBMI,
HC,BFI,andBF%valuesthangirlsofthesameagegroup.
BFI has been previously used and validated in
differ-entagerangesandethnicgroups.7,23Duetotheincreasing
prevalence of childhood obesity and the fact that the
obesepediatricpopulationhashighoddsofbecomingobese
adults,24withhighriskofcardiovasculardisease,type2
dia-betes,andhypertension,25theauthorsconsiderBFIdataand
curvestobeveryrelevantfor pediatricpatientsaccording
toageandsexualmaturation.ForBergmanetal.,itis
crit-icaltoassessBFIbehaviorinprepubertalandpostpubertal
schoolchildren of both genders and different ethnicities.7
Thesameauthorsmakeitclearthatitisimportanttoassess
theassociationofBFIwithbodyfat,whichwasperformed
inthepresentstudy.
Oneofthesurprisingresultswasthestrongassociationof
BFIwithBF%,sotherewasnoneedtouseaspecificand/or
electronictoolforthemeasurementofBF%.Thus,evenin
environmentswhereonly thesimplestandleastexpensive
toolsareavailable (ameasuringtape),areliableestimate
ofadipositycanbeobtained.
Regardingthestagesofsexualmaturation,bothBFIand
BF% values showed similar behavior in both genders. In
boys,themeanofthesetwovariablesshowedasignificant
decrease,andingirls,themeanswerehigherwith
advanc-ingTannerstages.SimilarresultsrelatedtoBF%havebeen
demonstratedby other authors,11,26,27 and it is important
toemphasizethatduringpuberty,girlsgainmorebodyfat,
whileboysgainmoremusclemass.18
It should be emphasized that puberty is characterized
bytheappearanceofdrastichormonalchangesthatinduce
significantchangesingrowth,bonemass,andbody
composi-tion.Thesechangesareassociatedwithvariationsincertain
biochemicalparameters,whicharetrue markersthat
reg-ulateboneturnoverandleptinlevels,reflectingchangesin
bonegrowthandfatmass,respectively.28
Whenanalyzing thepercentiles ofBFIinschoolchildren
accordingtoagegroupandTannerstage,itisobservedthat
inboysthemeanvaluesdecreased withadvancing Tanner
stage,whilegirlsshowedtheoppositepattern.
TheassociationbetweenBF%andcardiovasculardisease
riskiswell-documented.3,4However,thereisconvincing
evi-dencethatvisceralfatcontent29maybeastrongerpredictor
ofcardiovascular riskthan general adiposity,eventhough
thisstudymeasuredonlyoverallBF%.Atthistime,itisnot
possibletodetermineifBFIcanbemoreharmfulinthe
vis-ceralfat orintheliverfat,butinthefuture,itwillbeof
interesttocompareBFIwithselectedfatdeposits.
Althoughthereisnoconsensusregardingthediagnosisof
obesitythroughBF%andBFI in adolescents,someauthors
havedefined the85th and95th percentiles asexcessbody
Whenthe85thand95thpercentilesoftheBFIwere
eval-uatedaccordingtosexualmaturation,itwasobservedthat
therewasanincreaseinprepubertalandpubertalboys,of
approximately10%and 17%,respectively. As for girls,the
greatestincrease wasobserved among those classified as
postpubertal.
Thesedatademonstratetheimportanceofassessing
sex-ual maturation and its influence on body composition of
adolescents.When thegroups aged10-12yearsand13-15
yearswerecompared,boyshadagreaterincreaseintheage
group10-12years;ingirls,thegreatestincreaseoccurredin
theagegroupof13-15years.Asboyshadhigherprevalence
of excess weightin the studied population and the same
trendhasbeenobservedintheauthors’clinicalexperience,
it is considered important to use these data to evaluate
adolescentsofSãoPaulo.
Manypopulationstudies havefocused onBFIin foreign
populations and other ethnicities.23 To date, no Brazilian
studyhadshownthevaluesofBFIaccordingtogender,age,
and sexual maturation, which is essential during
adoles-cence, as thereis a widevariation of pubertal events in
individualsofthesamegenderandofthesameage.
More-over, anincrease in BMIhas been shown at each stageof
sexualmaturation30and,consequently,thisstudyoffersan
additionalcontribution tobodycompositionassessmentin
adolescents,makingtheassessmentofthisparameterinthis
agegroupmorereliable.
A limitation of the study is that by separating
adoles-centsaged10-15yearsaccordingtosexualmaturation,most
wereclassifiedaspubertal andtherewere few
prepuber-tal(predominantlymales)andpostpubertal(predominantly
females)adolescents.
Samplesizemayalsoaffecttheresults.Infuturestudies,
it willbe necessary toinclude a largersample sizein all
stagesofsexualmaturation.
This is the first study to provide data on BFI for
ado-lescentsaccordingtogender, age,andsexualmaturation,
allowingamoreappropriateassessmentforpubertalstage,
asthechronologicalageatthisstageshowsgreat
variabil-ity,therebyprovidinganimportanttoolfortheassessment
ofadiposityinadolescence.
BFI appears to reflect well the phenomena of sexual
dimorphism in adolescence, representing an
easy-to-perform method that should be used more often in
population samples; further studies may, along with the
presentwork,resultinanormalitycurve,whichwouldbe
ofgreatuseinclinicalpractice.
Conflicts
of
interest
Theauthorsdeclarenoconflictsofinterest.
Acknowledgments
TheauthorsacknowledgethesupportoftheAdolescent Divi-sion, Pediatric Department, Universidade Federal de São Paulo (Federal University of São Paulo) and the Interna-tional Life Sciences Institute (ILSI). They also thank the participants,theirparentsandguardians,theteachersand coordinatorsateachschool,andtheMunicipalGovernment ofSãoPaulo,Brazil.
References
1.MoraesFerrariGL,BraccoMM,MatsudoVK,FisbergMM. Car-diorespiratoryfitnessandnutritionalstatusofschoolchildren: 30-yearevolution.JPediatr(RioJ).2013;89:366---73.
2.InstitutoBrasileirodeGeografiaeEstatística(IBGE).Indicadores sociaismunicipais:umaanálisedosresultadosdouniversodo censodemográfico.[cited2012Jun01].Availablefrom:http:// www.ibge.gov.br/home/estatistica/populacao/censo2010/ indicadoressociaismunicipais/defaultindicadoressociais municipais.shtm
3.JuonalaM,MagnussenCG,BerensonGS,VennA,BurnsTL,Sabin MA,etal.Childhoodadiposity,adultadiposity,and cardiovas-cularriskfactors.NEnglJMed.2011;365:1876---85.
4.PintoMC,OliveiraAC.Occurrenceofchildobesityinpreschool childreninaSãoPauloday-carecenter.Einstein.2009;7:170---5.
5.CanoyD.Coronaryheartdiseaseandbodyfatdistribution.Curr AtherosclerRep.2010;12:125---33.
6.AlvimRO,Mourao-JuniorCA,OliveiraCM,KriegerJE,MillJG, PereiraAC.Bodymassindex,waistcircumference,body adi-posityindex,andriskfortype2diabetesintwopopulationsin Brazil:GeneralandAmerindian.PlosOne.2014;9:e100223.
7.BergmanRN,StefanovskiD,BuchananTA,SumnerAE,Reynolds JC,SebringNG,etal.Abetterindexofbodyadiposity.Obesity. 2011;19:1083---9.
8.ColeTJ,FlegalKM,NichollsD,JacksonAA.Bodymassindexcut offstodefinethinnessinchildrenandadolescents:international survey.BMJ.2007;335:194.
9.deOnisM,OnyangoAW,BorghiE,SiyamA,NishidaC,Siekmann J.Development ofa WHO growthreference for school-aged childrenand adolescents.Bull WorldHealth Organ.2007;85: 660---7.
10.DugganMB.Anthropometryasatoolformeasuringmalnutrition: impactofthenewWHOgrowthstandardsandreference.Ann TropPaediatr.2010;30:1---17.
11.McCarthyHD.Bodyfatmeasurementsinchildrenaspredictors forthemetabolicsyndrome:focusonwaistcircumference.Proc NutrSoc.2006;65:385---92.
12.WorldHealthOrganization.In:WHOExpertCommitteeon Physi-calStatus:theuseandinterpretationofanthropometryphysical status.Geneva:WorldHealthOrganization;1995.
13.CallawayCW,ChumleaWC,BouchardC,HimesJH,LohmanTG, Martin AD,et al. Circumferences. In: Lohman TG, Martorell R,editors.Anthropometricstandardizationreferencemanual. Champaign,IllinoisRocheAF:HumanKineticsBooks;1988.p. 39---54.
14.SlaughterMH,LohmanTG,BaileauRA,HorswillCA,StillmanRJ, VanLoanMD,etal.Skinfoldequationsforestimationofbody fatnessinchildrenandyouth.HumBiol.1988;60:709---23.
15.Lohman T, Roche A, Martorell R, editors. Anthropometric standardizationreferencemanual.Champaign,Illinois:Human KineticsBooks;1988.
16.TannerJ.M.Growthatadolescence.2nded.Oxford:Blackwell Scientific.In:MalinaRM,BouchardC.Growth,Maturation,and PhysicalActivity.Champaign:HumanKineticsBooks; 1991:11-20.
17.MatsudoSM.Self-assessment,MatsudoV.K.physicalassessment ofsexualmaturationinBrazilianboysandgirls:concordance andreproducibility.AmJHumBiol.1994;6:451---5.
18.CintraIP,FerrariGL,SoaresAC,PassosMA,FisbergM,Vitalle MS.BodyfatpercentilesofBrazilianadolescentsaccordingto ageandsexualmaturation:across-sectionalstudy.BMCPediatr. 2013;13:96.
19.FieldA.DescobrindoaestatísticausandooSPSS.2nded.Porto
Alegre:Artmed;2009.
21.BlandJM,AltmandG.Statisticalmethodsforassessing agree-mentbetweentwomethodsofclinicalmeasurement.Lancet. 1986;1:307---10.
22.Ellis KJ, Abrams SA, Wong WW. Monitoring childhood obe-sity:assessmentoftheweight/heightindex.AmJEpidemiol. 1999;150:939---46.
23.UrdeaM,KolbergJ,WilberJ,GerwienR,MolerE,RoweM,etal. Validationof a multimarkermodel for assessing riskof type 2diabetesfrom afive-yearprospectivestudyof6784Danish people(Inter99).JDiabetesSciTechnol.2009;3:748---55.
24.MustA. Morbidity and mortality with elevated body weight in children and adolescents. Am J Clin Nutr. 1996;63: 445---7.
25.WilliamsCL,HaymanLL,DanielsSR,RobinsonTN,SteinbergerJ, ParidonS,etal.Cardiovascularhealthinchildhood:astatement forhealthprofessionalsfromthecommitteeonatherosclerosis, hipertension,andobesityintheyoung(AHOY)ofthecouncilon
cardiovasculardiseaseintheyoung.AmericanHeartAssociation Circulation.2002;106:143---60.
26.PapandreouD,MalindretosP,RoussoI.Firstbodyfatpercentiles for607childrenfromThessaloniki-NorthernGreece. Hippokra-tia.2010;14:208---11.
27.Kurtoglu S, Mazicioglu MM, Ozturk A, Hatipoglu N, Cicek B, UstunbasHB.BodyfatreferencecurvesforhealthyTurkish chil-drenandadolescents.EurJPediatr.2010;169:1329---35.
28.Federico G, Baroncelli GI, Vanacore T, Fiore L, Saggese G. Puberalchangesinbiochemicalmarkersofgrowth.HormRes. 2003;60:46---51.
29.Canoy D.Distributionofbodyfat and riskofcoronaryheart diseaseinmenandwomen.CurrOpinCardiol.2008;23:591---8.