AR
TICLE
1 Departamento de Epidemiologia, Instituto de Medicina Social, Universidade do Estado do Rio de Janeiro. R. São Francisco Xavier 524/7º, Maracanã. 20550-900 Rio de Janeiro RJ Brasil. [email protected] 2 Departamento de Medicina Preventiva, Faculdade de Medicina, Universidade São Paulo. São Paulo SP Brasil.
3 Coordenação de Prevenção e Vigilância, Instituto Nacional de Câncer, Ministério da Saúde. Brasília DF Brasil.
4 Instituto de Comunicação e Informação Científica e Tecnológica em Saúde, Fundação Oswaldo Cruz, Ministério da Saúde. Rio de Janeiro RJ Brasil.
Lifestyle among former cancer patients in Brazil in 2013
Abstract People who have been diagnosed with cancer tend to adopt healthier lifestyles. This study analyzes the prevalence of smoking, eating fruits and vegetables, exercise and the use of alcoholic beverages among individuals who reported to have been diagnosed with cancer in the PNS (Pesquisa Nacional de Saúde or National Health Survey). The prevalence and corresponding 95% confidence intervals were calculated for consuming fruits and vegetables, sedentary lifestyle (no exercise), use of alcoholic beverages, being overweight and tobac-co use. The associa-tion between having received a diagnosis of cancer and the risk and protection factors was analyzed using a Poisson regression, adjusted by sociodemographic variables and other chronic comorbidities. The analyses were stratified by time since the diagnosis and the type of cancer related to the factors analyzed. The types of can-cer most often reported were breast and can-cervix in women, and prostate and stomach in men. Among those who had cancer diagnoses, there was a higher consumption of fruits and vegetables, higher pro-portion of ex-smokers, however, increased use of alcohol. There was no difference in the frequency of exercise or incidence of being overweight between the two groups. Measures to promote health and prevent chronic diseases should be implemented in the follow-up of people who have had cancer, in an effort to ensure integrated healthcare.
Key words Population surveys, Malignant neo-plasms, Risk factors
Gulnar Azevedo e Silva 1
Leandro Fórnias Machado de Rezende 2
Fabio da Silva Gomes 3
Paulo Roberto Borges de Souza Júnior 4
Celia Landman Szwarcwald 4
S
il
v
Introduction
The diminished lethality of some types of cancer has allowed a growing number of individuals to survive a diagnosis of cancer.
In high-income countries, one observes that for the less lethal cancers, such as breast, pros-tate and colorectal, mortality has dropped sig-nificantly, despite the fact that for some types the incidence has remained flat or even increased. However, the more lethal forms of cancer such as lung, stomach and pancreas still have very low
survival rates1. The situation in Brazil as a whole
is unclear, although this trend is emerging among those living in state capitals in the South and Southeast with diagnoses of cancer of the breast
or prostate2.
A diagnosis of cancer can motivate people to adopt healthier lifestyles. Recommendations made to people who have survived cancer treat-ment focus primarily on weight control, regular
exercise and healthy eating habits3,4. There is
ev-idence that cancer survivors who are no longer undergoing active treatment also benefit from the disease prevention recommendations geared
towards the general population5, reducing their
risk of death6.
For the first time, the joint IBGE and
Min-istry of Health PNS (National Health Survey)7
conducted between 2013 and 2014 collected nationally representative data on people who re-ceived the medical diagnosis of cancer. The sur-vey also provided data on the sociodemographic characteristics and variables indicative of life-style that enable looking at distinctions between adults who at some point in life were diagnosed with cancer, and those who were not. The goal of this study was to analyze factors related to life-style (tobacco use, eating fruits and vegetables, regular exercise and the use of alcoholic beverag-es) among people who have been diagnosed with cancer.
Methods
Study population, sampling and data collection
Data collected by the PNS National Health Survey was used. This is a household survey con-ducted by the Ministry of Health and the IBGE to assess the health, lifestyles and attention to health
among adults in Brazil7.
The PNS sample plan used clusters in three stages. The primary units were the census sectors, the secondary units were the households, and the tertiary units household members 18 years or older. Census sectors were stratified according to four criteria: administrative (state capital, re-mainder of the metropolitan region or integrated economic development region (RIDE) and other cities in the State), geography (sub-divides state capitals and other large cities), status (rural or urban) and statistical.
69,954 households were selected, with one person in each chosen for a one-on-one inter-view. 60,202 individuals were willing to
partici-pate in the survey (final response rate of 86%)7,8.
PNS data was collected using trained inter-viewers carrying hand-held computers (PDAs). A questionnaire was applied to the adult selected in each household. The questionnaire included questions about sociodemographics, self-as-sessed health status, lifestyle, morbidity, acci-dents and violence, women’s health, the health of children under 2 oral health, elderly health and performance of the healthcare system. We also conducted anthropometric and blood pressure measurements, and collected biological materi-al. Additional information describing PNS sam-pling and data collection has been described by
Souza-Junior et al.8.
Sociodemographics and referred morbidities
The variables selected for analyses were gen-der, age (18-29, 30-39, 40-49, 50-59, 60-69, 70-79,
≥ 80), race/color (white, black, yellow, brown,
na-tive Indian), marital status (married, separated/ divorced, widowed, single), education (no edu-cation or incomplete primary school, complete primary school or incomplete secondary school, complete secondary school or incomplete uni-versity and uniuni-versity graduate).
aúd
e C
ole
tiv
a,
21(2):379-388,
2016
Cancer diagnosis
Participants were asked if they had even been diagnosed with cancer by a physician, its prima-ry location and age at first diagnosis. To classify individuals with a diagnosis of cancer, we used the following primary locations: lung, intestine, stomach, breast, cervix, prostate and other. In-dividuals who reported a history of cancer were grouped by years since the first cancer diagno-sis into less than ten years or ten years or more. As most skin cancers are non-melanocytic, and most of these tumors evolve satisfactorily,
re-ports of skin cancer were not considered9, which
excluded 182 subjects from this analysis. Finally, respondents were grouped by type of cancer based on the etiological relationship with the risk and protection factors analyzed in this study, and related to food (lung, intestines and
stomach)5,6,10-15, exercise (intestine, breast and
prostate)16-18, use of alcohol and excess weight
(intestine, stomach and breast)19,20 and tobacco
use (lung, stomach and cervix)21-23.
Risk and protection factors
Eating cooked or raw fruits and vegetables was analyzed based on the weekly frequency (0 to 7 days), and the number of portions a day (0 to 3 or more a day). Eating 12 or more portions a week, as recommended by the World Health Or-ganization (WHO) was considered a protection
factor24.
Activities were assessed based on time spent and weekly frequency for leisure, work, house-hold chores, going to and from work or regular activities reported in the past three months. We used two indicators for this: exercise as leisure (no/yes) and level of physical activity according
to WHO recommendations24 (less than or more
than 150 minutes a week).
The use of alcoholic beverages was assessed based on weekly frequency as follows: alcoholic beverages consumed in lifetime (does not drink or > once a week) and abusive use of ethanol (less than or more than 5 times a week).
Tobacco use was described as the use of any tobacco product as the share of daily smokers (smokes daily or does not smoke/smokes less than one cigarette a day) and former smokers (yes or no).
Nutritional status was assessed by calculat-ing Body Mass Index (BMI) uscalculat-ing self-referred
weight and height data. Individuals with BMI ≥
25 kg/m2 were considered overweight.
Treatment of missing data
Simply deleting observations with missing data is one of the most inefficient ways of treating
missing data25,26, and damages the structural
in-formation of the survey sample design, decreas-ing the precision of the estimates. This is why we decided to impute the relevant missing data.
Of the 60,202 respondents, 15.6% (n = 9,412) were missing weight, 27.3% were missing height (n = 16,408) and 10.9% were missing both weight and height (n = 6,559), either because the indi-vidual did not fill in this information or refused to answer. Imputation of these variables used a modeling of the sub-set of data available and auxiliary variables predictive of the missing data, specifically gender and age, added to the residuals
of the adjusted model27. There were no instances
of missing data for the two auxiliary variables. Data was inputted using the Box-Cox transfor-mation of the data available to achieve normalcy, followed by an estimate of the parameters of the normal multivariate model, adjusted to the data based on a robust version of the EM (Expecta-tion-Maximization) variable developed by Little
& Smith28. Finally, the missing data was imputed
using a regression with the available data used as predictors, and adding residuals from the
adjust-ed model27.
We also found instances of missing informa-tion regarding the diagnosis of hypertension (3%, n = 1,787) and diabetes (11.6%, n = 6,986. As these variables might also influence the outcome and therefore had to be included in the models to avoid confounding, they were both imputed. As these losses were distributed randomly, the missing data was imputed using decision trees, a multivariate, non-parametric classification tech-nique that enables identifying the variables to be imputed based on the predictive variables
avail-able for the entire set of individuals29,30. In this
case, in addition to gender and age we also used the date of the last blood glucose assay for diabe-tes, and the date of the most recent blood pres-sure meapres-surement for hypertension, as auxiliary variables to predict the missing diagnostic data.
Statistical Analysis
The relative frequency of outcomes related to food consumption (high consumption of fruits and vegetables), exercise (sedentary, failure to achieve 150 minutes/week of physical activity),
drinking (alcoholic beverages ≥ 5 days a week
smok-S
il
v
er and former smokers) were also calculated for adults with and without a diagnosis of cancer.
Poisson regressions were used to estimate prevalence ratios and their 95% confidence in-tervals for the association between a diagnosis of cancer and the risk and protection factors, using as a reference the population without a cancer di-agnosis. Model 1 was adjusted using sociodemo-graphic variables (age, gender, race/color and ed-ucation), while model 2 used sociodemographic variables and other morbidities (hypertension, diabetes, coronary disease, stroke, depression, chronic obstructive pulmonary disease). We then ran analyses stratified by time since the cancer
di-agnosis (< 10 years or ≥10 years), adjusted by
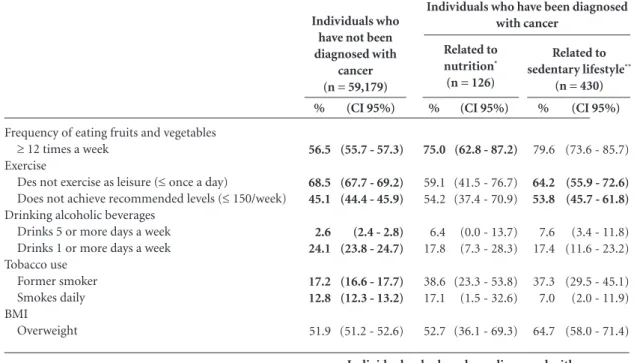
so-ciodemographic variables and other morbidities. We finally calculated the prevalence of the risk and protection factors for the types of cancer re-lated to nutrition (lung, intestine and stomach), physical activity (intestine, breast and prostate) and tobacco use (lung, stomach and cervix). As the PNS describes only the more frequent types of cancer and consigns al others to the “other cancer” category, the tumors related to obesity we were able to study were limited to the same tumors that are related to the use of alcoholic beverages (stomach, intestine and breast). All analyses used Stata 12.1 and considered the sam-ple design. Statistical significance was considered for p < 0.05.
Ethical Aspects
The PNS was approved by the Brazilian Na-tional Research Ethics (CONEP), and complies with National Health Board (CNS) Resolution n. 466 of December 12 2012.
Results
This study analyzed data from 59,179 individu-als who had not been diagnosed with cancer and 841 who had (1,023 less 182 with a diagnosis of non-melanoma skin cancer and thus excluded from the analysis). The population diagnosed with cancer included more women and elderly, whites (Caucasians) and people with a university degree than the population that had never been diagnosed with cancer (Table 1).
The relative frequency of individuals with a diagnosis of cancer in Brazil was 1.5%, with little difference between genders (1.3% among men
and 1.7% among women). The types of can-cer most often reported by women were breast (0.79%, cervix (0.23%), intestine (0.16%), stom-ach (0.03%) and lung (0.02%). Among men, the most frequent diagnoses were prostate (0.59%), intestine (0.16%), stomach (0.08%) and lung (0.02%). The largest percentage of the cancer di-agnoses (34%) had been received within the past 2 years.
Adults who had been diagnosed with cancer ate fruits and vegetables more often (PR = 1,37; CI 95% 1,11 a 1,67), and also exercised more fre-quently (PR = 0.90; CI 95% 0.83 - 0.98). When adjusted for other morbidities, exercise was not statistically significant. On the other hand, drink-ing an alcoholic beverage five or more days a week was almost twice as prevalent (PR = 2.03; IC 95% 1.23 - 3.35) among those who had been diagnosed with cancer than among those who had not. The number of former smokers was also higher in the population who had been di-agnosed with cancer (PR = 1.29; IC 95% 1.08 - 1.55) (Table 2).
The frequency of eating fruits and vegetables was higher among individuals who had been di-agnosed with cancer less than 10 years previously than in the population who had never been di-agnosed with cancer (PR = 1,45; CI 95% 1,12 - 1,89). The proportion of former smokers in the population who had received a cancer diagnosis was only larger than in the population without a cancer diagnosis in those who had been diag-nosed less than 10 years previously (RP = 1,41; IC 95% 1,16 - 1,72). On the other hand, drinking an alcoholic beverage five or more days a week was more than double (PR = 2.37; CI 95% 1.03 - 5.44), and smoking daily was almost half (PR = 0.52; CI95% 0.29 - 0.93) among those who had been diagnosed with cancer 10 years prior or more (Table 3).
aúd e C ole tiv a, 21(2):379-388, 2016 Discussion
The results of this study show that people who have had cancer seem to adopt, in part, health-ier lifestyles, tending to eat fruits and vegetables more frequently and stop smoking. However, we
found no difference in terms of exercise or obesi-ty, and the use of alcoholic beverages was almost twice as frequent among this population.
A number of studies have shown that follow-ing a diagnosis of cancer people eat more healthy foods such as fruits and vegetables, and more of
Variables Gender Male Female Age 18-29 30-39 40-49 50-59 60-69 70-79
≥ 80 Race/Color White (Caucasian) Black Yellow (Oriental) Brown Native Indian Marital Status Married Separated/Divorced Widow/Widower Single Education
None or incomplete primary
Complete primary or incomplete secondary Complete secondary or incomplete university University Graduate Other Morbidities Hypertension Diabetes Coronary diseases Stroke Depression Asthma Rheumatism Back ache
Chronic obstructive pulmonary disease Chronic renal failure
Other NTCD
Table 1. Sociodemographic characteristics of individuals who have and have not been diagnosed with cancer, National Health Survey (PNS) Brazil, 2013.
* Types of cancer included: lung, intestine, stomach, breast, prostate, cervix and other not specified. (CI 95%)
(47.1 - 47.3) (52.7 - 52.9)
(26.1 - 26.8) (21.5 - 22.2) (17.8 - 18.6) (15.6 - 16.5) (9.6 - 10.2) (5.0 - 5.5) (2.1 - 2.5)
(46.3 - 47.9) (8.8 - 9.7) (0.8 - 1.0) (41.5 - 43.0) (0.3 - 0.5)
(43.4 - 44.8) (6.1 - 6.8) (6.2 - 6.8) (42.3 - 43.6)
(20.9 - 22.1) (26.8 - 28.2) (37.7 - 39.0) (11.9 - 13.3)
(20.7 - 21.8) (6.1 - 6.8) (3.7 - 4.3) (1.3 - 1.6) (7.1 - 7.9) (4.1 - 4.6) (5.9 - 6.6) (17.6 - 18.8) (1.5 - 1.9) (1.2 - 1.5) (5.0 - 5.8)
% 47.2 52.8 26.5 21.9 18.2 16.1 9.9 5.2 2.3 47.1 9.2 0.9 42.3 0.4 44.0 6.5 6.5 43.0 21.5 27.5 38.4 12.6 21.3 6.5 4.0 1.5 7.5 4.4 6.3 18.1 1.7 1.4 5.4
Individuals who have not been diagnosed with cancer
(n = 59,179)
(CI 95%)
(34.6 – 45.6) (54.4 – 65.4)
(1.8 – 8.9) (3.5 – 7.9) (0.8 – 16.2) (16.8 – 25.2) (24.1 – 36.0) (12.5 – 20.2) (6.1 – 12.2)
(59.6 – 70.0) (4.9 – 10.1) (0.0 – 2.7) (21.9 – 30.9) (0.0 – 0.2)
(52.6 – 63.8) (6.7 - 12.0) (12.7 – 20.7) (11.4 – 19.9)
(32.8 – 44.5) (11.6 – 18.1) (20.0 – 28.9) (16.6 – 27.5)
(39.5 – 49.7) (9.9 – 17.9) (8.8 – 15.6) (1.8 – 5.3) (10.7 – 17.8) (3.9 – 9.4) (11.0 – 18.2) (27.6 – 38.3) (3.2 – 8.3) (1.5 – 5.5) (5.5 – 1.1)
% 40.0 60.0 5.4 5.7 12.3 21.0 30.1 16.3 9.2 64.8 7.5 1.2 26.4 0.1 58.2 9.3 16.7 15.7 38.7 14.8 24.5 22.0 44.6 13.9 12.1 3.5 14.2 6.6 14.6 33.0 5.7 3.5 8.5
Individuals who have been diagnosed with cancer*
S
il
v
them stop smoking31,32. Wang et al.31 looked at
over 16,000 cancer survivors and concluded that
they eat more fruits and vegetables and smoke less than the general population. At the same
Frequency of eating fruits and vegetables
≥ 12 times a week
Exercise
No exercise as leisure
Does not achieve recommended levels (≤ 150/week)
Drinking (alcohol)
Drinks 5 or more days a week Drinks 1 or more days a week Tobacco use
Former smoker Smokes daily Overweight/obese
BMI ≥ 25 kg/m2
Table 2. Behavioral risk factors in individuals with and without a diagnosis of cancer. National Health Survey. Brazil. 2013.
* Types of cancer included: lung, intestine, stomach, breast, prostate, cervix and other not specified. **Adjusted by gender, age, race/color and education. **Adjusted by gender, age, race/color, education, hypertension, diabetes, coronary disease, stroke, depression and chronic obstructive pulmonary disease.
(CI 95%)
(55.7 – 57.3)
(67.7 – 69.2) (44.4 – 45.9)
(2.4 – 2.8) (23.8 – 24.7)
(16.6 – 17.7) (12.3 – 13.2)
(51.2 – 52.6)
%
56.5
68.5 45.1
2.6 24.0
17.3 12.8
51.9
Individuals who have not been diagnosed with
cancer (n = 59,179)
Individuals who have been diagnosed with cancer* (n = 841)
(CI 95%)
(70.9 - 80.0)
(60.5 - 72.3) (49.2 - 59.9)
(3.6 - 10.4) (13.7 - 22.7)
(29.0 - 40.1) (5.4 - 13.8)
(57.0 - 66.8)
%
75.5
66.4 54.6
7.0 18.2
34.8 9.6
61.9
Model 1** PR
1.41
0.90
1.01
1.90
0.98
1.38
0.74
1.05
Model
2*** PR
1.37
0.91 1.01
2.03
1.00
1.32
0.74
1.02
CI 95%
1.16 - 1.69
0.83 - 0.98
0.91 - 1.11
1.19 - 3.05
0.77- 1.24
1.17 - 1.63
0.48 - 1.13
0.96 - 1.14
CI 95%
1.11 - 1.67
0.83 - 1.00 0.91 - 1.12
1.23 - 3.35
0.77 - 1.29
1.11 - 1.56
0.46 - 1.19
0.94 - 1.12
Frequency of eating fruits and vegetables
≥ 12 times a week
Exercise
No exercise as leisure
Does not achieve recommended levels ≤ 150/week)
Drinking (alcohol)
Drinks 5 or more days a week Drinks 1 or more days a week Tobacco use
Former smoker Smokes daily Overweight/obese
BMI ≥ 25 kg/m2
Table 3. Behavioral risk factors in the general population (reference) and individuals who have been diagnosed with cancer, by time since diagnosis. National Health Survey. Brazil. 2013.
* Types of cancer included: lung, intestine, stomach, breast, prostate, cervix and other not specified. ** Adjusted by gender, age, race/ color, education, hypertension, diabetes, coronary disease, stroke, depression and chronic obstructive pulmonary disease.
CI 95%
1.12 - 1.89
0.82 - 1.03 0.93 -1.21
1.00 - 3.56 0.76 - 1.42
1.16 - 1.72
0.47 - 1.54
0.89 - 1.12
PR**
1.45
0.92 1.06
1.89 1.04
1.41
0.85
0.99
Individuals diagnosed with cancer < 10 years before
survey* (n = 562)
CI 95%
0.84 - 1.69
0.78 - 1.03 0.75 - 1.08
1.03 - 5.44
0.55 - 1.44
0.83 - 1.51
0.29 - 0.93
0.95 - 1.23
PR**
1.19
0.90 0.90
2.37
0.89
1.12
0.52
1.08
Individuals diagnosed with cancer ≥ 10 years before
aúd
e C
ole
tiv
a,
21(2):379-388,
2016
Frequency of eating fruits and vegetables
≥ 12 times a week
Exercise
Des not exercise as leisure (≤ once a day)
Does not achieve recommended levels (≤ 150/week)
Drinking alcoholic beverages Drinks 5 or more days a week Drinks 1 or more days a week Tobacco use
Former smoker Smokes daily BMI
Overweight
Table 4. Behavioral risk factors in the general population (reference) and individuals who have been diagnosed with cancer by type of cancer. National Health Survey. Brazil. 2013.
* Types of cancer included: lung, intestine, stomach. ** Types of cancer included: intestine, breast and prostate. *** Types of cancer included: intestine, stomach and breast. **** Types of cancer included: lung, stomach and cervix.
(CI 95%)
(55.7 - 57.3)
(67.7 - 69.2) (44.4 - 45.9)
(2.4 - 2.8) (23.8 - 24.7)
(16.6 - 17.7) (12.3 - 13.2)
(51.2 - 52.6)
%
56.5
68.5 45.1
2.6 24.1
17.2 12.8
51.9
Individuals who have not been diagnosed with
cancer (n = 59,179)
(CI 95%)
(62.8 - 87.2)
(41.5 - 76.7) (37.4 - 70.9)
(0.0 - 13.7) (7.3 - 28.3)
(23.3 - 53.8) (1.5 - 32.6)
(36.1 - 69.3)
%
75.0
59.1 54.2
6.4 17.8
38.6 17.1
52.7
Related to nutrition*
(n = 126)
(CI 95%)
(73.6 - 85.7)
(55.9 - 72.6) (45.7 - 61.8)
(3.4 - 11.8) (11.6 - 23.2)
(29.5 - 45.1) (2.0 - 11.9)
(58.0 - 71.4)
%
79.6
64.2 53.8
7.6 17.4
37.3 7.0
64.7
Related to sedentary lifestyle**
(n = 430)
(CI 95%)
(73.4 - 87.6)
(47.2 - 67.6) (40.2 - 60.1)
(0.0 - 5.8) (7.1 - 18.1)
(19.5 - 35.5) (0.8 - 14.0)
(57.3 - 74.5)
%
80.5
57.4 50.1
2.8 12.6
27.5 7.4
65.9
Related to alcohol use and obesity***
(n = 332)
(CI 95%)
(68.5 - 86.8)
(51.4 - 79.6) (39.5 - 67.3)
(0.0 - 0.2) (4.6 - 27.0)
(24.9 - 52.9) (4.7 - 19.7)
(47.2 - 73.0)
%
77.6
65.5 53.4
0.1 15.8
38.9 12.2
60.1
Related to tobacco use****
(n = 142)
Frequency of eating fruits and vegetables
≥ 12 times a week
Exercise
Des not exercise as leisure (≤ once a day)
Does not achieve recommended levels (≤ 150/week)
Drinking alcoholic beverages Drinks 5 or more days a week Drinks 1 or more days a week Tobacco use
Former smoker Smokes daily BMI
Overweight
Individuals who have been diagnosed with cancer
Individuals who have been diagnosed with cancer
time, other studies show that for patients treated for colorectal cancer, exercise is inversely associ-ated with the risk of death, while watching TV as
leisure increases this risk6.
Changes in lifestyle following a diagnosis of cancer have been shown to be related to im-proved health, both physical as well as
psycho-logical (specifically regarding tobacco and alco-hol use), and to a decrease in the probability of
cancer recurrence and other comorbidities33,34.
S
il
v
as an important factor for preventing other chronic diseases such as diabetes and cardiovas-cular disease, but not so much for cancer preven-tion. We found no difference in the prevalence of obesity between those with and without a cancer diagnosis, a fact that caught our attention.
Although eating more fruits and vegetables is recognized as an important cancer preven-tion factor, weight control requires reducing the consumption of energy-dense foods and sugary
drinks5.
In Brazil, the rapid increase in the prevalence of excess weight and obesity is a nation-wide
phenomenon35. Exposure to advertising and
oth-er forms of marketing for these products is not well regulated, and their use is viewed as natu-ral, with the penetration of advertising for these
products facing off against the recommendations
of the health authorities36,37 making it difficult for
the population to follow health authority guide-lines. Furthermore, it takes more time to detect changes in excess weight due to the accumulation of body fat over our lifetimes, sometimes since early childhood.
Using the data collected in the PNS we were able to show difference in lifestyle among those who have had a cancer diagnosis. However, we must expand and adjust prevention strategies for risk factors of chronic diseases for those who have had cancer. Prospective studies to assess what happens to cancer survivors in Brazil, not only in terms of the effectiveness of the clinical treatment, but also including a broader assess-ment to promote health should be encouraged.
Collaborations
aúd
e C
ole
tiv
a,
21(2):379-388,
2016
References
Allemani C, Weir HK, Carreira H, Harewood R, Spika D, Wang XS, Bannon F, Ahn JV, Johnson CJ, Bonaven-ture A, Marcos-Gragera R, Stiller C, Azevedo e Silva G, Chen WQ, Ogunbiyi OJ, Rachet B, Soeberg MJ, You H, Matsuda T, Bielska-Lasota M, Storm H, Tucker TC, Coleman MP; CONCORD Working Group. Global surveillance of cancer survival 1995-2009: analysis of individual data for 25,676,887 patients from 279 popu-lation-based registries in 67 countries (CONCORD-2). Lancet 2015; 385(9972):977-1010.
Azevedo e Silva G, Gamarra CJ, Girianelli, Valente JG. Tendência da mortalidade por câncer nas capitais e in-terior do Brasil entre 1980 e 2006. Rev Saude Publica, 2011; 45(6):1009-1018.
Denlinger CS, Ligibel JA, Are M, Baker KS, Demark -Wahnefried W, Dizon D, Friedman DL, Goldman M, Jones L, King A, Ku GH, Kvale E, Langbaum TS, Le-onardi-Warren K, McCabe MS, Melisko M, Montoya JG, Mooney K, Morgan MA, Moslehi JJ, O’Connor T, Overholser L, Paskett ED, Peppercorn J, Raza M, Ro-driguez MA, Syrjala KL, Urba SG, Wakabayashi MT, Zee P, McMillian NR, Freedman-Cass DA; National comprehensive cancer network. Survivorship: healthy lifestyles, version 2.2014. J Natl Compr Canc Netw 2014; 12(9):1222-1237.
Balneaves LG, Van Patten C, Truant TL, Kelly MT, Neil SE, Campbell KL. Breast cancer survivors’ perspectives on a weight loss and physical activity lifestyle interven-tion. Support Care Cancer. 2014; 22(8):2057-2065. World Cancer Research Fund, American Institute for Cancer Research. Food, Nutrition, Physical Activity, and the Prevention of Cancer: A Global Perspective. Wash-ington: AICR; 2007.
Arem H, Pfeiffer RM, Engels EA, Alfano CM, Hollen-beck A, Park Y, Matthews CE. Pre- and postdiagnosis physical activity, television viewing, and mortality among patients with colorectal cancer in the Nation-al Institutes of HeNation-alth-AARP Diet and HeNation-alth Study. J Clin Oncol 2015; 33(2):180-188.
Instituto Brasileiro de Geografia e Estatística (IBGE). Pesquisa Nacional de Saúde 2013: percepção do estado de saúde, estilos de vida e doenças crônicas – Brasil, Gran-des Regiões e UnidaGran-des da Federação [Internet]. Rio de Janeiro: IBGE; 2014 [acessado 2015 jan 9]. Disponível em: ftp://ftp.ibge.gov.br/PNS/2013/ pns2013.pdf Souza-Júnior PRB, Freitas MPS, Antonaci GA, Anto-naci GA, Szwarcwald CL. Desenho da amostra da Pes-quisa Nacional de Saúde 2013. Epidemiol. Serv. Saúde 2015; 24(2):207-216.
Instituto Nacional de Câncer (INCA). Estatísticas de Câncer. Registros de Câncer de Base Populacional. Es-timativa 2014: Incidência de Câncer no Brasil. Rio de Janeiro: INCA; 2014.
Riboli E, Norat T. Epidemiologic evidence of the pro-tective effect of fruit and vegetables on cancer risk. Am J Clin Nutr 2003; 78(Supl. 3):559S-569S.
Larsson SC, Orsini N, Wolk A. Processed meat con-sumption and stomach cancer risk: a meta-analysis. J Natl Cancer Inst 2006; 98(15):1078-1087.
1.
2.
3.
4.
5.
6.
7.
8.
9.
10.
11.
Shikata K, Kiyohara Y, Kubo M, Yonemoto K, Nino-miya T, Shirota T, Tanizaki Y, Doi Y, Tanaka K, Oishi Y, Matsumoto T, Iida M. A prospective study of dietary salt intake and gastric cancer incidence in a defined Japanese population: the Hisayama study. Int J Can-cer 2006; 119(1):196-201.
D’Elia L, Rossi G, Ippolito R, Cappuccio FP, Strazzullo P. Habitual salt intake and risk of gastric cancer: a meta-analysis of prospective studies. Clin Nutr 2012; 31(4):489-498.
Aune D, Lau R, Chan DS, Vieira R, Greenwood DC, Kampman E, Norat T. Nonlinear reduction in risk for colorectal cancer by fruit and vegetable intake based on meta-analysis of prospective studies. Gastroentero-logy 2011; 141(1):106-118.
Chan DS, Lau R, Aune D, Vieira R, Greenwood DC, Kampman E, Norat T. Red and processed meat and colorectal cancer incidence: meta-analysis of prospec-tive studies. PLoS One 2011; 6:e20456.
Boyle T, Keegel T, Bull F, Heyworth J, Fritschi L. Phys-ical activity and risks of proximal and distal colon cancers: a systematic review and meta-analysis. J Natl Cancer Inst 2012; 104(20):1548-1561
Wu Y, Zhang D, Kang S. Physical activity and risk of breast cancer: a meta-analysis of prospective studies. Breast Cancer Res Treat 2013; 137(3):869-882. Liu Y, Hu F, Li D, Wang F, Zhu L, Chen W, Ge J, An R, Zhao Y. Does physical activity reduce the risk of pros-tate cancer? A systematic review and meta-analysis. Eur Urol 2011; 60(5):1029-1044.
Harriss DJ, Atkinson G, George K, Cable NT, Reil-ly T, Haboubi N, Zwahlen M, Egger M, Renehan AG; C-CLEAR group. Lifestyle factors and colorectal cancer risk (1):systematic review and meta-analysis of associations with body mass index. Colorectal Dis 2009; 11(6):547-563.
Renehan AG, Tyson M, Egger M, Heller RF, Zwahlen M. Body-mass index and incidence of cancer: a systematic review and meta-analysis of prospective observational studies. Lancet 2008; 371(9612):569-578.
Bonequi P, Meneses-González F, Correa P, Rabkin CS, Camargo MC. Risk factors for gastric cancer in Latin America: a meta-analysis. Cancer Causes Con-trol 2013; 24(2):217-231.
Thun MJ, Apicella LF, Henley SJ. Smoking vs other risk factors as the cause of smoking-attributable mor-tality: confounding in the courtroom. JAMA 2000; 284(6):706-712.
Cogliano VJ, Baan R, Straif K, Grosse Y, Lauby-Secretan B, El Ghissassi F, Bouvard V, Benbrahim-Tallaa L, Guha N, Freeman C, Galichet L, Wild CP. Preventable expo-sures associated with human cancers. J Natl Cancer Inst 2011; 103(24):1827-1839.
Rubin DB. Multiple imputation for nonresponse in sur-veys. New York: John Wiley & Sons Inc.; 1987. Schafer JL. Analysis of incomplete multivariate data. London: Chapman & Hall, CRC; 1997.
Silva PLN. Crítica e imputação de dados quantitativos utilizando o SAS [dissertação]. Rio de Janeiro: IMPA; 1989.
Little RJA, Smith PJ. Editing and imputing for quan-titative survey data. Journal of the American Statistical Association 1987; 82(397):58-68.
12.
13.
14.
15.
16.
17.
18.
19.
20.
21.
22.
23.
24. 25. 26.
S
il
v
Breiman L, Friedman JH, Olshen RA. Classification and regression trees. Belmont: Wadsworth International Group; 1984.
Nordbotten S. Neural Network Imputation Applied to the Norwegian 1990 Population Census Data. J Off Stat 1996; 12(4):385-401.
Wang Z, McLoone P, Morrison DS. Diet, exercise, obe-sity, smoking and alcohol consumption in cancer sur-vivors and the general population: a comparative study of 16 282 individuals. Br J Cancer 2015; 112(3):572-575. Hawkins NA, Smith T, Zhao L, Rodriguez J, Berkowitz Z, Stein KD. Health-related behavior change after can-cer: results of the American cancer society’s studies of cancer survivors (SCS). J Cancer Surviv 2010; 4(1):20-32.
Travis LB, Demark Wahnefried W, Allan JM, Wood ME, Ng AK. Aetiology, genetics and prevention of second-ary neoplasms in adult cancer survivors. Nat Rev Clin Oncol 2013; 10(5):289-301.
Low CA, Beckjord E, Bovbjerg DH, Dew MA, Posluszny DM, Schmidt JE, Lowery AE, Nutt SA, Arvey SR, Rechis R. Correlates of positive health behaviors in cancer sur-vivors: results from the 2010 LIVESTRONG survey. J Psychosoc Oncol 2014; 32(6):678-695.
Instituto Brasileiro de Geografia e Estatística (IBGE). Pesquisa de Orçamentos Familiares 2008-2009. Antro-pometria e estado nutricional de crianças, adolescentes e adultos no Brasil. Rio de Janeiro: IBGE; 2010.
Gomes FS, Castro IRR, Monteiro CA. Publicidade de alimentos no Brasil: avanços e desafios. Cienc. Cult. 2010; 62(4):48-51.
Henriques P, Dias PC, Burlandy L. A regulamentação da propaganda de alimentos no Brasil. Cad Saude Pu-blica 2014; 30(6):1219-1228.
Article submitted 25/09/2015 Approved 30/11/2015
Final version submitted 02/12/2015 28.
29.
30.
31.
32.
33.
34.
35.