*Corresponding author. Tel: +989121316312 E-mail addresses: [email protected] (A. Danaei) © 2013 Growing Science Ltd. All rights reserved. doi: 10.5267/j.msl.2012.11.013
Contents lists available at GrowingScience
Management Science Letters
homepage: www.GrowingScience.com/msl
Measuring the relative performance of stock market using TOPSIS
Abolfazl Danaeia* and Maryam Moradi Haghighib
aDepartment of Management, Semnan branch, Islamic Azad university, Semnan, Iran
bDepartment of Industrial Management, Semnan Branch, Islamic Azad University, Semnan, Iran
C H R O N I C L E A B S T R A C T
Article history: Received June 21, 2012 Received in revised format 30 October 2012
Accepted 8 November 2012 Available online
November 10 2012
For many years, investors used some basic financial ratios to measure the relative performance of various active industries based on two-digit ISIC classification. However, direct implementation of basic financial figures may not be practical in today's business environment since investors face with different criteria. The proposed model of this paper uses Technique for Order Preference by Similarity to Ideal Solution (TOPSIS) to compare 37 various industries based on different financial figures. We gather the necessary data over the period of 2009-2010 from Tehran Stock Exchange and investigate the data in two stages. In the first stage, we perform fundamental analysis to select the most appropriate firms and the in the second stage, we use TOPSIS to rank selected firms based on different criteria. The results of the study confirm that information and communication technology, which is one of the biggest firms in this exchange is considered as the best option (relative ranking 0.88 in two years) followed by some Cement industry (with relative ranking of 0.26 in 2009 and 0.19 in 2010) and oil refinery units (with relative ranking of 0.23 in 2009 and 0.19 in 2010). The figure also shows that other firms maintain low ratios varied from 0.23 to 0.01. The lowest industry ranking belongs to marine industry.
© 2013 Growing Science Ltd. All rights reserved.
Keywords:
TOPSIS Ranking
Internal rate of return
1. Introduction
(Saaty, 1992), Technique for Order Preference by Similarity to Ideal Solution (TOPSIS) Chen and Hwang, 1992; Yoon & Hwang, 1995, Data envelopment analysis (Charnes et al., 1978, 1994; Andersen et al., 1993), etc.
Some of these methods require decision maker (DM) to give his/her insights for ranking preference, for instance AHP, while the others do not, e.g. DEA. In the event we wish to prevent direct communication with DM, one can choose other techniques to rank different alternatives. In fact, there are growing interests among practitioners for adapting techniques for decision making processes, which depends on both financial and non-financial figures (Kaplan & Norton, 1992; Kaplan, & Norton, 1996).
TOPSIS, which was first developed by Hwang and Yoon in 1981, as ranking methodology used for many real-world applications of science and engineering (Chang et al., 2010). The standard TOPSIS method selects alternatives, which simultaneously maintain the shortest distance from the positive ideal solutions and the longest distance from the negative-ideal preferences. The positive ideal suggestion maximizes the desirable criteria and minimizes the undesirable criteria. On the other hand, the negative ideal solution maximizes the undesirable criteria and minimizes the desirable criteria. TOPSIS uses full implementation of attribute information, provides a cardinal ranking of alternatives, and does not need attribute preferences to be completely independent. To use this technique, attribute values must be numeric, monotonically decreasing or increasing, and have commensurable units (Chen and Hwang, 1992; Yoon & Hwang, 1995).
There are literally various applications of TOPSIS used in many areas of scientific societies and there are different extensions of TOPSIS such as fuzzy TOPSIS. In Fuzzy TOPSIS, one can look for uncertainty with input parameters. This extension makes the implementation more realistic since uncertainty is part of events and incidents. Aiello et al. (2009), for example, implemented fuzzy TOPSIS for clean agent selection. Athanasopoulos et al. (2009) presented a decision support system for coating selection based on fuzzy logic. Amiri (2010), in an assignment, considered project selection for oil-fields development by incorporating the AHP and fuzzy TOPSIS methods. Awasthi et al. (2011a) analyzed an application of fuzzy TOPSIS in evaluating sustainable transportation systems. Awasthi et al. (2011b) also proposed a hybrid approach based on SERVQUAL and fuzzy TOPSIS for making an assessment on transportation service quality. Performance measurement is another area of implementation of TOPSIS and its extentions such as fuzzy TOPSIS. Orougi et al. (2012) used TOPSIS for ranking different regions of a province for new energy distribution. Rostampour (2012) used TOPSIS technique to rank ten well known web browsers on the cyberspace. Nazari et al. (2012) proposed a multi-criteria decision making method to rank various national Iranian oil refining and distribution companies. They used six factors including per capita supply, energy cost, physical productivity of labor, staff participation, quality control inspection of stations and education per capita and used Entropy to detect the relative importance of each criterion and TOPSIS to rank 37 alternatives based on cities and three regions.
A. Danaei and M. Moradi Haghighi / Management Science Letters 3 (2013)
93 making. They explained that qualitative and quantitative factors such as quality, price, and flexibility should be concerned for determining a suitable product. They used recent advances in ranking methods for product selection.
The proposed model of this paper uses Technique for Order Preference by Similarity to Ideal Solution (TOPSIS) to compare 27 various industries based on different financial figures. We gather the necessary data over the period of 2009-2010 from Tehran Stock Exchange and investigate the data in two stages. In the first stage, we perform fundamental analysis to select the most appropriate firms and the in the second stage, we use TOPSIS to rank selected firms based on different criteria.
2. The proposed model
There are different financial figures for measuring the relative performance of a particular sector in industry such as risk of the market versus profit margin. For instance, technology firms normally present relatively high profit margin but they preserve a high ratio of risk as well. These two objectives are often in conflict since higher profit margin means higher profitability and higher chance of failure. In this paper, we consider profit per share (EPS), total equities, return of assets (ROA), growth profit, operating profit and net profit to measure the relative performance of different companies. International Standard Industrial Classification (ISIC) classification is also implemented to group all economic activities listed in Tehran Stock Exchange. According to our survey, there are 37 different classifications including communication, cement industry, steel, etc. For each group of ISIC classification, we have performed some fundamental analysis to select three best firms. Therefore, 108 firms are considered in our study covering various fields of economic activities.
3. TOPSIS method
Let xijbe the inputs for matrix of priorities where there exist i1,,malternatives and j1,,n
criteria. TOPSIS method has six steps as follows,
Step 1. Build normalized decision matrix
2
1 1
ij ij m n
ij i j x r x (1)
Step 2. Build the weight normalized matrix
, 1, , 1, ,
ij i ij
v w r i m j n (2)
Step 3. Detect the positive and negative ideal solutions
1
1
, , , where max( ) if ; min( ) if
, , , where min( ) if ; max( ) if
n j ij ij
n j ij ij
A v v v v j J v j J
A v v v v j J v j J
(3)
Step 4. Measure seperation (positive and negative) measures for each alternative
n n
2 2
j=1 j=1
( ) , ( ) , 1, ,
i j ij i j ij
S vv S vv i m (4)
Step 5. Measure the relative closness to the ideal solution
, 0 1, 1, ,
i
i i
i i
S
C C i m
S S (5)
The results of the implementation of AHP method
Attribute Operating profit Net profit ROA EPS Total equity Growth profit
Weight
0.358697 0.217779 0.1278 0.103907 0.101823 0.089995
Rank
1 2 3 4 5 6
The next step is to provide five ratios for 37 different economic sectors where three firms are chosen in each category. We have gathered for two consecutive fiscal years of 2009 and 2010.
The implementation of TOPSIS method has provided two similar results for the infomration of two consequtive years of 2009 and 2010 in terms of different financial perspectives and the results are summarized in Fig. 1 as follows,
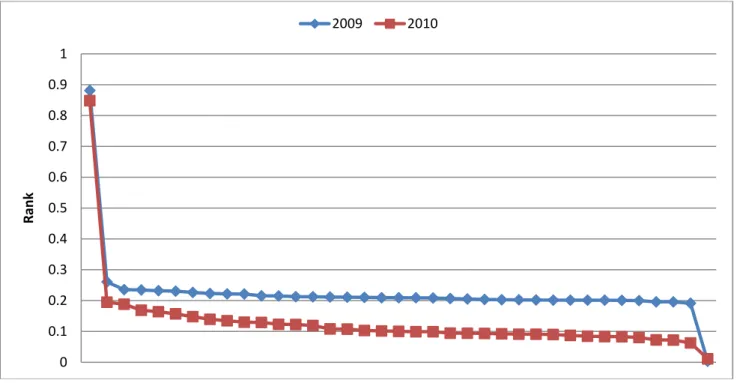
Fig. 1. The summary of ranking for 37 different industries in two fiscal years of 2009-2010
As we can observe from the results of Fig.1, information and communication technology, which is one of the biggest firms in this exchange is considered as the best option (reletive ranking 0.88 in two years) followed by some Cement industry (with relative ranking of 0.26 in 2009 and 0.19 in 2010) and oil refinery units (with relative ranking of 0.23 in 2009 and 0.19 in 2010).). The figure also shows that other firms maintain a low ratios varied from 0.23 to 0.01. The lowest industry ranking belongs to marine industry.
4. Conclusion
We have presented an empirical study to measure the relative importance of 37 different industries categorized in ISIC classifications. The proposed study of this paper uses six financial figures including profit per share (EPS), total equities, return of assets (ROA), growth profit, operating profit and net profit. The proposed model has implemented TOPSIS method to rank these firms based on financial figures and the results have indicated that the biggest firms in this exchange was considered as the best option for investment with reletive ranking 0.88 in two years followed by some Cement industry with relative ranking of 0.26 in 2009 and 0.19 in 2010 and oil refinery units with relative ranking of 0.23 in 2009 and 0.19 in 2010. The figure also shows that other firms maintain a low ratios varied from 0.23 to 0.01. The lowest industry ranking belongs to marine industry.
0 0.1 0.2 0.3 0.4 0.5 0.6 0.7 0.8 0.9 1
Rank
A. Danaei and M. Moradi Haghighi / Management Science Letters 3 (2013)
95
In summary, the results of the survey seems to be promissing but we need to consider other important factors such as embargo surronding Tehran Stock Exchange and we leave it as future research for interested researchers.
Acknowlegment
This paper was financially supported by Islamix Azad University, Semnan branch and the auhtors would like to thank them for their support.
References
Aiello, G., Enea, M., Galante, G., & La Scalia, G. (2009). Clean agent selection approached by fuzzy
TOPSIS decision-making method. Fire Technology, 45, 405–418.
Amiri, M. P. (2010). Project selection for oil-fields development by using the AHP and fuzzy
TOPSIS methods. Expert Systems with Applications, 37, 6218–6224.
Andersen, P., & Petersen, N. C. (1993). A procedure for ranking efficient units in data envelopment
analysis, Management Science, 39, 1261-1264.
Athanasopoulos, G., Riba, C. R., & Athanasopoulou, C. (2009). A decision support system for
coating selection based on fuzzy logic and multi-criteria decision making. Expert Systems with
Applications, 36, 10848–10853.
Awasthi, A., Chauhan, S. S., & Omrani, H. (2011a). Application of fuzzy TOPSIS in evaluating
sustainable transportation systems. Expert Systems with Applications, 38, 12270–12280.
Awasthi, A., Chauhan, S. S., Omrani, H., & Panahi, A. (2011b). A hybrid approach based on
SERVQUAL and fuzzy TOPSIS for evaluating transportation service quality. Computers &
Industrial Engineering, 61, 637–646.
Aydogan, E. K. (2011). Performance measurement model for Turkish aviation firms using the
rough-AHP and TOPSIS methods under fuzzy environment. Expert Systems with Applications, 38, 3992–
3998.
Charnes A, Cooper, W. W., Rhodes, E. (1978). Measuring the efficiency of decision making units.
European Journal of the OperationalResearch, 2, 429–44.
Charnes A, Cooper W. W., Lewin, A., Seiford, L. M. (1994). Data envelopment analysis: theory,
methodology and applications. Massachusetts: Kluwer Academic Publishers.
Chen, S. J., & Hwang, C. L. (1992). Fuzzy multiple attribute decision making: Methods and
applications. Berlin: Springer-Verlag.
Chang, C. H., Lin, J. J., Lin, J. H., & Chiang, M. C. (2010). Domestic open-end equity mutual fund performance evaluation using extended TOPSIS method with different distance approaches.
Expert Systems with Applications, 37, 4642–4649.
Chamodrakas, I., Alexopoulou, N., & Martakos, D. (2009). Customer evaluation for order acceptance
using a novel class of fuzzy methods based on TOPSIS. Expert Systems with Applications, 36,
7409–7415.
Kaplan, R. S. & Norton, D. P. (1992). The balanced scorecard – measures that drive performance,
Harvard Business Review, 70(1), 71-79.
Kaplan, R.S. & Norton, D.P. (1996). The balanced scorecard: translating strategy into action,
Harvard Business School Press, Boston, MA.
Kelemenis, A., Ergazakis, K., & Askounis, D. (2011). Support managers’ selection using an
extension of fuzzy TOPSIS. Expert Systems with Applications, 38, 2774–2782.
Krohling, R. A., & Campanharo, V. C. (2011). Fuzzy TOPSIS for group decision making: A case
making techniques for ranking different national Iranian oil refining and distribution companies.
Management Science Letters, 2(7), 2341-2346.
Orougi, S., Esmailzade Maghari, A., Mohammadi, H., Gol Mohammadi, A.M., & Irani, M. (2012). An empirical investigation to use solar–geothermal hybrid energy system for small towns.
Management Science Letters, 2(7), 2287-2292.
Rostampour, S. (2012). An application of TOPSIS for ranking internet web browsers. Decision
Science Letters, 1(2), 53-58.
Saaty, T. L. (1992). How to make a decision: the analytic hierarchy process. European Journal of
Operational Research, 48, 9–26.
Sun, C. C., & Lin, G. T. R. (2009). Using fuzzy TOPSIS method for evaluating the competitive
advantages of shopping websites. Expert Systems with Applications, 36, 11764–11771.
Yadollahi Farsi, J., Siahkali Moradi, J., & Jamali, B. (2012). Which product would be chosen? A fuzzy VIKOR method for evaluation and selection of products in terms of customers' point of
view; Case study: Iranian cell phone market. Decision Science Letters, 1(1), 23-32.
Yoon, K. P., & Hwang, C. L. (1995). Multiple attribute decision making. Thousand Oaks, CA: Sage