Performance Measurement of Turkish and
Chinese Manufacturing Firms: A Comparative
Analysis
1Nizamettin BAYYURT
∗
Gokhan DUZU
**Abstract
The aim of this paper is to compare the relative efficiencies of manufacturing companies of China, one of the BRIC countries (BRIC: Brazil, Russia, India, China) that are expected to dominate the world economy in 2050s, and Turkey, that is an attractive emerging market (Morgan Stanley Index 2006) with great potential. We will determine the relative performances of Turkish and Chinese manufacturing firms using weight restricted Data Envelopment Analysis (DEA). Weights of inputs and outputs are estimated by canonical correlation analysis. Mean efficiencies of the firms of the two countries are compared by t-test. The results of DEA and statistical analyses indicate that Chinese manufacturing firms are highly efficient than Turkish manufacturing firms on average.
Keywords: DEA, CCA, Manufacturing Companies, Turkey and China, Efficiency.
JEL Classification: G0, C14, L6.
1 This study is a part of a project supported by the Scientific Research Fund of Fatih University under the
project number P51020702
∗ Corresponding author, PhD. Assistant Professor, Department of Management, Fatih University,
Istanbul, Turkey, E-mail: [email protected]
1. Introduction
China, which is one of the four BRIC (Brazil, Russia, India, China) countries, is going to be expected to dominate world economy in 2050s, and Turkey, which has a great investment potential, are emerging markets that will be analyzed in terms of manufacturing efficiency. When we briefly look at Turkish and Chinese manufacturing sectors; firstly some facts about Chinese manufacturing are as follows (Pinto, 2005):
• Continually increasing manufacturing power
• Significant cost advantages (beyond just labor cost)
• Good, repetitive quality
• Worldwide market share, 50% of cameras, 30% of air conditioners and televisions, 25% of washing machines, 20% of refrigerators
• One private Chinese company makes 40% of all microwave ovens sold in Europe
• The city of Wenzhou, in Eastern China produces 70% of the world's metal cigarette lighters
• Wall-mart, Buys $18 billion worth of goods from China, providing a direct link to the US consumer
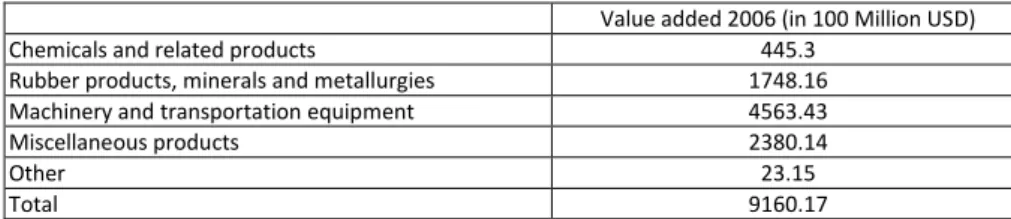
As it known, China is the one of the most growing countries. This growth is largely based on expansion of industrial manufacturing. The total value added output of manufacturing rose by 178% percent since 1995. Majority of these were electrical machinery, industrial chemicals, transport equipment, iron and steel, and non-electrical machinery (such as computers). Another reason for this upward trend was the decline of state owned enterprises and intense foreign direct investment (Morrison 2008). The major industries that add value to export of manufacturing are provided in Table 1.
Table 1: Major contributors in Chinese Manufacturing in Exports
Value added 2006 (in 100 Million USD)
Chemicals and related products 445.3
Rubber products, minerals and metallurgies 1748.16
Machinery and transportation equipment 4563.43
Miscellaneous products 2380.14
Other 23.15
Total 9160.17
EJBE 2008, 1(2) Page | 73
Table2: Major contributors in Turkish Manufacturing in Exports
Value added 2006 (in Million USD)
Transportation vehicles and equipments 12,675.9
Apparels 10,169.9
Main Metal Products 9,324.3
Textiles 9,261.2
Other Machinery & Equipment 5,994.1
Food, beverages, and tobacco 6,467
Total Manufacturing 41,199
Source: Prime Ministry of Turkish Republic State Planning Organization (2007), Temel Ekonomik Göstergeler
When we look at Turkey’s export of manufacturing, we see that the value added contribution to GDP is declining. The reason behind this is the boom of the service sector with the help of European investors thanks to quasi liberal policies and perfect location of Turkey (Albaladejo 2006). The major contributors in Turkey’s export of manufacturing are shown in Table 2.
We can say that Machinery and transportation equipment is the most value added sub-industry in both China and Turkey. Metal products and apparels & textile are other sectors which are valuable for Turkey and miscellaneous products and rubber products & minerals are for China.
As China grows faster, it is getting more threatening the world countries. The giant economy threatens to become the global workshop for manufacturing activity, leaving out many developing countries from the international industrial scene. What makes the Chinese case exceptional; however, is that its industrial progress has spanned the entire technological spectrum – from garments to electronics – putting a competitive threat not only to developing countries but also to industrialised ones. Yet the main competitive threat has been felt by countries specialised in resource-based and low-technology labour-intensive products where China now accounts for 15.3% of world trade (Albaladejo 2006).
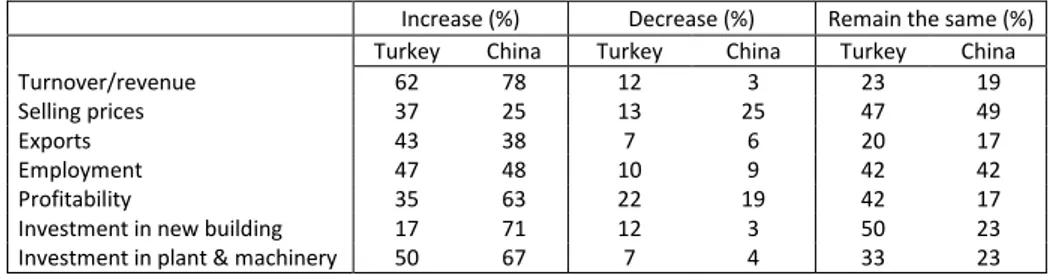
In a survey called International Business Report conducted by Grant Thornton International Company in 2006, concerning growth, profit and expectations of manufacturing companies for the next 12 months, Turkish and Chinese manufacturers have the same level of confidence for future outlook. Turkey is %78 optimistic and China is %80. Below is the table that shows the expectation of businesses in the manufacturing sector.
Table 3: Businesses’ Expectations of China and Turkey in Manufacturing
Sector
Increase (%) Decrease (%) Remain the same (%)
Turkey China Turkey China Turkey China
Turnover/revenue 62 78 12 3 23 19
Selling prices 37 25 13 25 47 49
Exports 43 38 7 6 20 17
Employment 47 48 10 9 42 42
Profitability 35 63 22 19 42 17
Investment in new building 17 71 12 3 50 23
Investment in plant & machinery 50 67 7 4 33 23
Source: Grant Thornton International Business Report Survey, 2006
Table 3 displays that Chinese manufacturers have a higher expectation rate about the increase of revenue, profitability, employment and investment in plant, new building and machinery than Turkish manufacturers while Turkish manufacturers expects their exports and selling prices to increase. The table also shows the portion of expectations that are foreseen “decrease or remain the same” by manufacturers.
Below, the table 4 compares two countries’ share of manufacturing as percentage of GDP and annual growth. The share of manufacturing is approximately one third of GDP in China in the last three years, and has grown about 10 % every year. In Turkey, the share of manufacturing is about 20 % of GDP and has grown 9 % on average in the last three years.
Table 4: Share of manufacturing as percentage of GDP and annual growth
Value Added (% of GDP ) Value Added (annual % growth)
2004 2005 2006 2004 2005 2006
China 32 33 31 9 12 8
Turkey 20 20 20 12 8 8
EJBE 2008, 1(2) Page | 75
When Turkey and China are considered individually by looking at expectations of manufacturing sectors; manufacturers of both countries mostly mention the cost of raw materials as a pressure on profit margins.
As everyone knows China is frightening the sectors in other countries that compete in the same industry. According to Grant Thornton Survey (2006) again, 50% of Turkish manufacturers expect no impact from Chinese economic boom while 35% think that it will have negative impact on their business.
Huang et al. (2005) say about processing trade, which means that importing components then processing and exporting the final goods, in explaining why manufacturing sectors are competitive in developing countries. The enforcement of competition is an aspect of the business climate that is much debated in the context of development. Firms that have higher efficiencies have important competitive advantages. Since highly efficient firms are able to achieve more outputs with fewer resources; they are more productive, more profitable, and candidate of superior growth. The relationship between competition and efficiency incentive are described in many studies signifying how comparative performance may enhance efficiency incentives, disappointing productivity growth are related with poorly competitive environment (Okada 2005, Sekkat 2007).
Productivity growth compensates for price increases of factor of production and enhances competitiveness. Its changes greatly influence the economic growth since any productivity gains increase the real income. Efficiency which is the ability of converting inputs to outputs, directly affects costs and consequently profits and capital investments (Neda and Sowlati, 2006). The future competitiveness of firms depends on success of improving efficiency and productivity besides developing new products, technologies, and markets; establishing closer ties with customers; and maintaining a skilled and flexible workforce.
2. Canonical Correlation
Canonical correlation analysis tries to find the correlations between two data sets. One data set is called the dependent set, the other the independent set (Johnson and Wichern 2002, Hair et. al. 1998). While it is used for explaining the relation between dependent and independent variables, it explains not only which independent variable has an effect on which dependent variable but also which independent variable has a higher effect on which dependent variables (Levine, 1977:6). The formula can be shown simply as follows:
∑
=
ix
iu
α
,
v
=
∑
β
iy
iCanonical variates
u
and
v
are linear composites of the variables of independentand dependent sets respectively.
α
iand
β
i, that are called canonical coefficientsof the variates are found by maximixing the correlation between
u
and
v
and interpreted as the coefficients of regression analysis.3. Data Envelopment Analysis
Data envelopment analysis (DEA) is a powerful tool for evaluating and improving the performance of organizations. It has a wide range of application in performance evaluation and benchmarking of hospitals, banks, schools, manufacturing plants, non profit organizations, etc.(Charnes et al. 1994).
DEA is a multi-factor productivity analysis model for measuring the relative efficiencies of a homogenous set of decision making units (DMUs). The efficiency score in the presence of multiple input and output factors is defined as:
inputs
of
sum
weighted
outputs
of
sum
weighted
Efficiency
=
Assuming that there are n DMUs, each with m inputs and s outputs, the relative efficiency score of a test DMU p is obtained by solving the following model proposed by Charnes et al. (1978):
∑
∑
= =
m
j jp j s
k kp k
x u
y v
Max
EJBE 2008, 1(2) Page | 77 s.t i x u y v m j ji k s k ki
k
∑
≤ ∀∑
= = ; 1 / 1 1 j k uvk, j ≥0; ∀ ,
Where
k = 1 to s, j = 1 to m, i = 1 to n,
ki
y = amount of output k produced by DMU i, xji = amount of input j utilized by
DMU i,
k
v = weight given to output k, uj= weight given to input j
The above linear program is run n times for all DMUs in finding the relative efficiency score of each. Each DMU maximizes its efficiency score by selecting appropriate input and output weights. In general, a DMU is considered to be efficient if its efficiency score is 1 and inefficient if its efficient score is less than 1.
3.1 Weight Restrictions in DEA
DEA allows for unrestricted weight flexibility in determining the efficiency scores of DMUs. This allows units to achieve relatively high efficiency scores by assigning inappropriate input and output weights. Weight restrictions permit for the integration of managerial preferences, expert opinions or prior knowledge in terms of relative importance levels of various inputs and outputs. Weight restrictions discriminate efficient and inefficient units effectively than unrestricted forms.
Some of the suggestions for weight restrictions are;
Absolute region: weights have upper and lower bounds.
i i i i
i
i
v
B
ve
C
u
D
A
≤
≤
≤
≤
Assurance region: some relations between the ratios of two variables are known.
k i k k
i
v
B
Av
v
Bv
v
A
≤
/
≤
⇒
≤
≤
k i k k
i
u
D
Cu
u
Du
u
C
≤
/
≤
⇒
≤
≤
0
...
3 3 2 2 11
u
+
c
u
+
c
u
+
+
c
tu
t≥
c
0
...
3 3 2 2 11
v
+
d
v
+
d
v
+
+
d
mv
m≥
d
4. The Analysis
The firms included in this research are ISE (Istanbul Stock Exchange) and SSE (Shenzhen Stock Exchange) listed manufacturing companies in 2006 and 2005. Data was collected from CorporateInformation.com. This site holds "Best of the Web" recognition from FORBES Magazine. BARRON's Magazine featured the site as one of the best sources of company information for investors.This site is also one of the few sources in the world for English language reports on many companies in Asia, Latin America and Eastern Europe that do not release their results in English. Data of166 Chinese and 65 Turkish firms were gathered. After excluding the firms with missing values and as outliers at 5% level of significance by the test of Mahalanobis Distance, the sample for analysis was made up of 126 Chinese and 47 Turkish manufacturing firms.
In the study independent variables (inputs in DEA) are number of employees (NE), inventory turnover (IT), receivable turnover (RT), total asset/total debt (TATD; 1/leverage), cash flow (CF), current ratio (CR), and property plant & equipment/total asset (PLTS), and dependent variables (outputs in DEA) are net income per employee (NIPE), growth in sales (GS), net income per share (NIPS) and ebit margin (EM). Outputs of the study evaluate firm performance in multidimensional aspects. Inputs are important determinants affecting firm performance. IT: end)/2 at term Inventory beginning at term (Inventory sold goods of Cost
+ This ratio analyzes how
many times the company’s inventories have been sold in a year. A high value of this ratio reveals the profitability of the company.
RT:
s
receivable
Short term
sales
Net
This ratio shows how many times the company is ableto convert its short term receivables account into sales. In general, a high ratio and an upward trend indicate a good performance.
TATD:
debt Total
assets
Total The value of this ratio shows the ability of the company’s total
EJBE 2008, 1(2) Page | 79
CF: The sum of operating activities, financing activities and investing activities
CR:
s liabilitie current
Total
assets current
Total The value of this ratio shows the ability of the
company’s total current assets to cover its short term obligations
PLTS:
assets Total
equipment &
plant property
Net
GS: Percent change in sales
EM: Ebit margin shows the percentage of sales revenue that is left after all expenses have been removed, excluding net interest and income tax expenses. Ebit is calculated by taking the earnings before net interest has been deducted and before the income tax obligation on the earnings has been deducted.
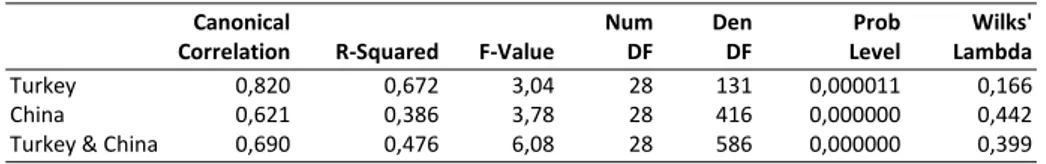
Table 5: Canonical Correlations Section
Canonical Num Den Prob Wilks'
Correlation R-Squared F-Value DF DF Level Lambda
Turkey 0,820 0,672 3,04 28 131 0,000011 0,166
China 0,621 0,386 3,78 28 416 0,000000 0,442
Turkey & China 0,690 0,476 6,08 28 586 0,000000 0,399
In the study, canonical correlation was used to investigate the interrelationships between two variables sets: the criterion set includes performance factors (NIPE, GS, NIPS and EM) while the predictor set consists of variables (NE, IT, RT, TATD, CF, CR)
Table 5 displays the test statistics of canonical correlations of Turkish and Chinese manufacturing industries one by one and together. Canonical correlations (R=0,82, R=0,621 and R=0,69) indicate a strong relationship between criterion and predictor variables. All the canonical correlations were found to be significant (p<0,00001) using Bartlett’s chi-square test. Consequently, predictor variables are effective to explain (criterion variables) firm performance.
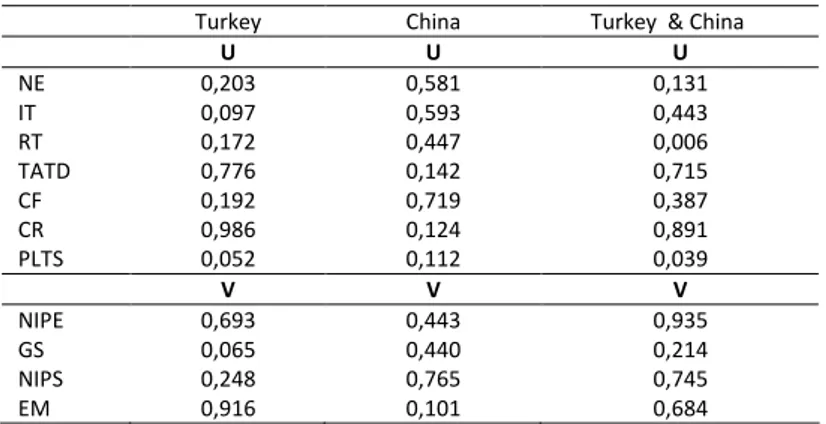
significant variables is NIPE (0,935), NIPS (0,745) and EM (0,684). NIPE>GS, NIPS>GS for all the three canonical loadings, and NIPE>NIPS, NIPE >EM, EM> GS and NIPS>EM for two of the loadings. As a result the rank of priority of variables can be as NIPE>NIPS>EM>GS. Loadings less than 0, 40 are assumed as not significant.
Table 6: Canonical loadings
Turkey China Turkey & China
U U U
NE 0,203 0,581 0,131
IT 0,097 0,593 0,443
RT 0,172 0,447 0,006
TATD 0,776 0,142 0,715
CF 0,192 0,719 0,387
CR 0,986 0,124 0,891
PLTS 0,052 0,112 0,039
V V V
NIPE 0,693 0,443 0,935
GS 0,065 0,440 0,214
NIPS 0,248 0,765 0,745
EM 0,916 0,101 0,684
Canonical variable for the predictor set is a linear combination of the seven variables (NE, IT, RT, TATD, CF, CR, PLTS). Canonical loadings show that CR has the highest correlation (0.986) with its variable and therefore is the most important variable and then TATD (0,776) comes in its set for Turkey. CF is the most important variable (0,719) and then IT (0,593), NE (0,581) and RT (447) come for China. When the analysis was applied to all of the Turkish and Chinese firms jointly then the order of importance of the variables is CR (0,891), TATD (0,715) and IT (0,443). When all the three and for two of the canonical loadings are considered it can be revealed that IT>NE, CF>NE, IT>RT, TATD>PLTS, CR>PLTS, RT>NE, TATD>NE, CR>NE, PLTS>NE, IT>CF, TATD>IT, CR>IT, IT>PLTS, TATD>RT, CF>RT, CR>RT, RT>PLTS, TATD>CF, CR>TATD, CR>CF, CF>PLTS. As a result the rank of importance of variables can be as CR>TATD>IT>CF>RT>PLTS>NE
Consequently weighted restrictions which will be used in DEA are:
NIPE>NIPS>EM>GS
CR>TATD>IT>CF>RT>PLTS>NE
EJBE 2008, 1(2) Page | 81
the mean efficiency of Turkish firms is 0,45 with a standard deviation of 0,16. The means are compared by independent samples t-test. It is concluded that there is statistically significant difference between the mean efficiencies of Turkish and Chinese manufacturing firms. Chinese firms are 20 % on average more efficient than Turkish firms. The results are displayed in table 7.
Table 7: Comparison of efficiencies
Mean efficiencies
N Mean Std. Deviation
China 126 0,65 0,15
Efficiency
Turkey 47 0,45 0,16
Independent samples t-test
5. Conclusion
China has become important or dominant in several sectors, causing price collapses in some industries. It has several advantages, including labor cost, labor efficiency, cost of building factories, massive investments in new plant and equipment, large markets attracting local and foreign investment, the ability to carry out reforms, the ability to build and rebuild cities, world-leading infrastructure in some regions, and others (Enright, 2006). In addition to these, the result of the study has shown that China is more efficient in converting the resources to outputs than Turkey, when current ratio, total assets/total debt, inventory turnover, cash flow, receivable turnover, property plant & equipment/total asset, number of employees were used as the resources and net income per employee, net income per share, earnings before interest and taxes margin and growth in sales as outputs for firms.
Levene's Test for Equality
of Variances t-test for Equality of Means
95% Confidence Interval of the
Difference
F Sig. t df
Sig. (2-tailed)
Mean Differe nce
Std. Error Differe
nce Lower Upper
Effi cie ncy
Equal variances assumed
Provided that we consider the efficiency scores of firms of the two countries, the rank of competitiveness by GCI of overall economies of Turkey and China among 131 economies is admissible in manufacturing industry. Chinese firms are more efficient and therefore more competitive than the Turkish ones concerning the utilized indicators in the study. The results of this study may affirm the negative expectations from Chinese economic boom in Turkish manufacturing industry based on the efficiencies of firms. Turkish manufacturing firms must evaluate their performance concerning competitors.
References
Albaladejo M., (2006), “The Manufacturing Sector in Turkey: Challenges for Structural change and convergence”, unpublished paper prepared for Europe and Central Asia (ECA) Region Department of the World Bank as the background paper to Turkey’s Investment Climate Assessment (ICA).
Huang, C., Zhang M. & Zhao Y. (2005) “Why the manufacturing sectors in developing countries can be competitive? The Evidence of China”, China’s Economics Annual Conference.
Charnes, A., Cooper W.W., Lewin A.Y. & Seiford L.M. (1994) Data envelopment analysis: Theory methodology and applications, Boston: Kluwer.
China Statistical Yearbook (2007), “Main Export Commodities in Volume and Value” http://www.stats.gov.cn/tjsj/ndsj/2007/indexeh.htm (accessed: 15 March 2008)
Prime Ministry of Turkish Republic State Planning Organization (Devlet Planlama Teşkilati) (2007), “Ihracatin Sektörel Dagilimi”, Temel Ekonomik Göstergeler http://ekutup.dpt.gov.tr/tg/index.asp?yayin=teg&yil=0&ay=0 (accessed: October 10, 2008) Enright, M. (2006) “China’s Competitiveness and Implications for Asia and the World”, The Competitiveness Institute’s (TCI) Regional Conference on Competitiveness and Economic Growth in Asia, Islamabad.
Grant Thornton International Business Report Survey (2006), http://www.internationalbusinessreport.com/survey/IBR.aspx?year=2006 (accessed: September 28, 2007)
Hair, A. & Black T. (1998) Multivariate Data Analysis, Prentice Hall.
Istanbul Stock Exchange (2007), Endeks Kapsamındaki Şirketler, http://www.imkb.gov.tr/veri.htm (accessed: August 15, 2007)
Johnson, R. A. & Wichern D. W. (2002) Applied Multivariate Statistical Analysis, Prentice Hall. Levine, M. S. (1977) Canonical Analysis and Factor Comparison, Sage Publications (USA)
MSCI Index Country Membership,
http://www.mscibarra.com/products/indices/equity/em.html (accessed: October 25, 2006) Morrison, W. M. (2008), China’s Economic Conditions, Congressional Research Service
EJBE 2008, 1(2) Page | 83 http://digitalcommons.ilr.cornell.edu/cgi/viewcontent.cgi?article=1504&context=key_workp lace (accessed: March 23, 2008)
Okada, Y. (2005) “Competition and Productivity in Japanese Manufacturing Industries”, Journal of the Japanese and International Economies, 19 (4), 586-616.
CorporateInformation (2007), Online Company Database, http://member.corporateinformation.com, (accessed: July 30, 2007)
Pinto, J. (2005), Global Manufacturing – The China Challenge, Jim Pinto Writings Articles, http://www.jimpinto.com/writings/chinachallenge.html , (accessed: April 1, 2008)
Neda, S. & Sowlati T. (2006), “Productivity and efficiency assessment of the wood industry: A review with a focus on Canada”, Forest Products Journal, vol. 56, p. 25
Shenzhen Stock Exchange (2007), Indices list: Manufacturing Index, http://www.szse.cn/main/en/marketdata/Indiceslist/# (accessed: August 15, 2007)
The Global Competitiveness Report 2007-2008 (2007), World Economic Forum, http://www.weforum.org/pdf/Global_Competitiveness_Reports/Reports/gcr_2006/gcr2006 _summary.pdf (accessed: January 23, 2008)