ACPD
11, 1595–1639, 2011ENSO-related rainfall variability and Australian dust
L. D. Rotstayn et al.
Title Page
Abstract Introduction
Conclusions References
Tables Figures
◭ ◮
◭ ◮
Back Close
Full Screen / Esc
Printer-friendly Version Interactive Discussion
Discussion
P
a
per
|
Dis
cussion
P
a
per
|
Discussion
P
a
per
|
Discussio
n
P
a
per
Atmos. Chem. Phys. Discuss., 11, 1595–1639, 2011 www.atmos-chem-phys-discuss.net/11/1595/2011/ doi:10.5194/acpd-11-1595-2011
© Author(s) 2011. CC Attribution 3.0 License.
Atmospheric Chemistry and Physics Discussions
This discussion paper is/has been under review for the journal Atmospheric Chemistry and Physics (ACP). Please refer to the corresponding final paper in ACP if available.
Simulated enhancement of ENSO-related
rainfall variability due to Australian dust
L. D. Rotstayn1, M. A. Collier1, R. M. Mitchell2, Y. Qin2, and S. K. Campbell2
1
Centre for Australian Weather and Climate Research, CSIRO Marine and Atmospheric Research, Aspendale, Vic, Australia
2
Centre for Australian Weather and Climate Research, CSIRO Marine and Atmospheric Research, Canberra, ACT, Australia
Received: 20 December 2010 – Accepted: 12 January 2011 – Published: 19 January 2011
Correspondence to: L. D. Rotstayn ([email protected])
ACPD
11, 1595–1639, 2011ENSO-related rainfall variability and Australian dust
L. D. Rotstayn et al.
Title Page
Abstract Introduction
Conclusions References
Tables Figures
◭ ◮
◭ ◮
Back Close
Full Screen / Esc
Printer-friendly Version Interactive Discussion
Discussion
P
a
per
|
Dis
cussion
P
a
per
|
Discussion
P
a
per
|
Discussio
n
P
a
per
Abstract
Average dust emissions from Australia are small compared to those from the major sources in the Northern Hemisphere. However, they are highly episodic, and this may increase the importance of Australian dust as a climate feedback agent. We compare two 160-year coupled atmosphere-ocean simulations of modern-day climate using the
5
CSIRO Mark 3.6 global climate model (GCM). The first run (DUST) includes an in-teractive treatment of mineral dust and its direct radiative effects. The second run (NODUST) is otherwise identical, but has the Australian dust source set to zero. We focus on the austral spring season, when the correlation between rainfall and the El Ni ˜no Southern Oscillation (ENSO) is strongest over Australia. We find that the
ENSO-10
rainfall relationship over eastern Australia is stronger in the DUST run: dry (El Ni ˜no) years tend to be drier, and wet (La Ni ˜na) years wetter. The ENSO-rainfall relation-ship is also weaker over north-western Australia in the DUST run. The amplification of ENSO-related rainfall variability over eastern Australia and the weaker ENSO-rainfall relationship over the north-west both represent an improvement relative to
observa-15
tions. The suggested mechanism over eastern Australia involves stabilisation of the surface layer due to enhanced atmospheric heating and surface cooling in El Ni ˜no years, and enhanced ascent and moisture convergence driven by atmospheric heating in La Ni ˜na years. The results suggest that (1) a realistic treatment of Australian dust may be necessary for accurate simulation of the ENSO-rainfall relationship over
Aus-20
tralia, and (2) radiative feedbacks involving dust may be important for understanding natural rainfall variability over Australia.
1 Introduction
Mineral dust is both strongly influenced by climate and itself influences climate. Dust aerosols exert substantial direct effects by scattering and absorbing shortwave
radia-25
ACPD
11, 1595–1639, 2011ENSO-related rainfall variability and Australian dust
L. D. Rotstayn et al.
Title Page
Abstract Introduction
Conclusions References
Tables Figures
◭ ◮
◭ ◮
Back Close
Full Screen / Esc
Printer-friendly Version Interactive Discussion
Discussion
P
a
per
|
Dis
cussion
P
a
per
|
Discussion
P
a
per
|
Discussio
n
P
a
per
these direct effects, dust affects cloud microphysics and the efficiency of precipitation formation (Wurzler et al., 2000; Rosenfeld et al., 2001). It also provides an important biogeochemical link between terrestrial and marine ecosystems (Ridgwell, 2002). Dust is an important vector for iron supply to the ocean, which subsequently impacts ocean productivity, atmospheric CO2concentrations, and hence global climate (Mackie et al.,
5
2008).
Regionally, dust can exert large radiative effects, especially on surface shortwave radiation. For example, Haywood et al. (2003) estimated a maximum decrease of short wave radiation at the surface of 209 W m−2 during a dust event over the North Atlantic Ocean in September 2000. As a partially absorbing aerosol, dust also tends to
10
increase atmospheric stability and reduce convection (Satheesh and Moorthy, 2005). However, the reality is more complex, because the forcing and response to absorbing aerosols can depend strongly on their relationship to clouds (Liao and Seinfeld, 1998), their optical properties (Miller et al., 2004), altitude (Penner et al., 2003) and the aridity of the environment (Miller et al., 2004).
15
Climatic conditions strongly influence atmospheric dust concentration, via their ef-fects on dust emission, transport and deposition. For example, transport of African dust across the North Atlantic shows large interannual changes that are highly anti-correlated with rainfall in the Soudano-Sahel region (Prospero and Lamb, 2003). Wind erosion of soils is sensitive to vegetation cover and soil moisture, as well as the intrinsic
20
properties of the soil (Gillette and Passi, 1988; F ´ecan et al., 1999; Webb et al., 2006; Ishizuka et al., 2008). Zender and Kwon (2005) found that, in most regions, precipi-tation and vegeprecipi-tation variations strongly constrain dust anomalies, with dust emission and precipitation being negatively correlated on multiple timescales. However, in some regions dust and precipitation anomalies correlate positively. This can occur where
25
flood-transported sediments increase dust emission during subsequent dry periods (McTainsh et al., 1999).
ACPD
11, 1595–1639, 2011ENSO-related rainfall variability and Australian dust
L. D. Rotstayn et al.
Title Page
Abstract Introduction
Conclusions References
Tables Figures
◭ ◮
◭ ◮
Back Close
Full Screen / Esc
Printer-friendly Version Interactive Discussion
Discussion
P
a
per
|
Dis
cussion
P
a
per
|
Discussion
P
a
per
|
Discussio
n
P
a
per
has been shown to increase atmospheric stability and reduce convection in the tropical Atlantic Ocean; this may explain the strong inverse relationship between inter-annual variations of tropical cyclone activity and Saharan dust outbreaks (e.g., Evan et al., 2006; Sun et al., 2009). Model simulations suggest that direct radiative forcing by increased levels of North African dust can explain up to 30% of the observed
precipita-5
tion reduction in the Sahel between wet and dry periods (Yoshioka et al., 2007). Mod-elling of the 1930s “dust bowl” drought in North America suggests that human-induced land degradation is likely to have contributed to the dust storms and also amplified the drought, in part due to the direct radiative effects of dust (Cook et al., 2009).
Australia is the dominant source of dust in the Southern Hemisphere (Tanaka and
10
Chiba, 2006; Mackie et al., 2008). Satellite retrievals identify the large (1 140 000 km2) Lake Eyre Basin of central-eastern Australia as the largest dust source in the Southern Hemisphere (Prospero et al., 2002); see also Washington et al. (2003), McTainsh et al. (2007), Bullard et al. (2008) and Mitchell et al. (2010). Compared to the major Northern Hemisphere dust source regions, Australian average dust emissions are relatively low.
15
However, they are very episodic, with periods of high dust activity occurring during drought (McTainsh et al., 2007). Australia’s Southern Hemisphere location and the sensitivity of its responses (in both time and space) to rainfall variations may increase the importance of Australian dust as a feedback on climate.
To our knowledge, there have been no modelling studies of the direct radiative
ef-20
fects of Australian dust on climate. However, Rotstayn et al. (2010) noted a substantial improvement in the simulation of Australian natural rainfall variability in an updated version of the CSIRO global climate model (GCM), which they tentatively attributed to the inclusion of an interactive dust treatment. They assessed the model’s simulation of the leading modes of annual rainfall variability using empirical orthogonal
telecon-25
ACPD
11, 1595–1639, 2011ENSO-related rainfall variability and Australian dust
L. D. Rotstayn et al.
Title Page
Abstract Introduction
Conclusions References
Tables Figures
◭ ◮
◭ ◮
Back Close
Full Screen / Esc
Printer-friendly Version Interactive Discussion
Discussion
P
a
per
|
Dis
cussion
P
a
per
|
Discussion
P
a
per
|
Discussio
n
P
a
per
Australia, in good agreement with observations, whereas in Mark 3.5 it was incorrectly centred over Western Australia.
Based on qualitative arguments, Rotstayn et al. (2010) proposed that by further sup-pressing convection over eastern Australia during El Ni ˜no events (and enhancing it during La Ni ˜na events), dust feedbacks may increase the magnitude of rainfall
variabil-5
ity there, in tune with the model’s ENSO cycle. However, because their updated model included other changes besides the inclusion of an interactive dust scheme, they were unable to state this with confidence. An accurate simulation of this rainfall mode is necessary for modelling the response of Australian rainfall to anthropogenic climate change. The hypothesis also suggests that feedbacks involving dust may be important
10
for understanding natural rainfall variability over Australia. For example, it is possible that there is a positive feedback on drought induced by the recent observed increase in Australian dust (Mitchell et al., 2010).
The purpose of this paper is to investigate the effect of Australian dust on ENSO-related rainfall variability by comparing two coupled ocean-atmosphere simulations with
15
the CSIRO Mark 3.6 GCM (hereafter Mk3.6). The first is an extension of the run de-scribed by Rotstayn et al. (2010), with the Australian dust source included. The second run is otherwise identical, but the Australian dust source is set to zero. By comparing two runs which differ on only one respect, it should be possible to isolate the effect of Australian dust.
20
ACPD
11, 1595–1639, 2011ENSO-related rainfall variability and Australian dust
L. D. Rotstayn et al.
Title Page
Abstract Introduction
Conclusions References
Tables Figures
◭ ◮
◭ ◮
Back Close
Full Screen / Esc
Printer-friendly Version Interactive Discussion
Discussion
P
a
per
|
Dis
cussion
P
a
per
|
Discussion
P
a
per
|
Discussio
n
P
a
per
2 Model and simulations
2.1 Model description
The CSIRO Mk3.6 GCM is described by Rotstayn et al. (2010). It was developed from the earlier Mk3.5 version (Gordon et al., 2010); for an historical overview see Smith (2007). It is a coupled ocean-atmosphere model with dynamic sea ice, and
horizon-5
tal resolution of approximately 1.9◦×1.9◦ (spectral T63). The atmospheric component has 18 vertical levels. The main differences between Mk3.5 and Mk3.6 are the in-corporation of an interactive aerosol treatment and an updated radiation scheme in the latter. The aerosol species treated interactively are sulfate, black carbon, organic aerosol, mineral dust and sea salt. All the above aerosol types, except for sea salt, are
10
treated prognostically by the model, so that equations are included for their emission, transformation, transport and removal at each time step. In all, there are 11 prognostic variables in the aerosol scheme: dimethyl sulfide (DMS), sulfur dioxide (SO2), sulfate, hydrophobic and hydrophilic forms of black carbon and organic aerosol, and four size bins of mineral dust, with radii ranging from 0.1–1, 1–2, 2–3 and 3–6 µm respectively. A
15
further two modes of sea salt are diagnosed as a function of wind speed in the marine boundary layer, but are not treated prognostically. Also, the distribution of stratospheric aerosol from volcanic eruptions is prescribed using monthly mean data (extended from Sato et al., 1993). Rotstayn et al. (2007) give further details of the aerosol schemes (including their limitations). The aerosol treatments are supported by an updated
radi-20
ation scheme that includes aerosol-radiative effects (Grant et al., 1999; Chou and Lee, 2005; Rotstayn et al., 2007). The radiation scheme treats the shortwave effects of all the above aerosol types and the longwave effects of dust and volcanic aerosol. Indirect effects of aerosol on liquid-water clouds depend only on sulfate, carbonaceous aerosol and sea salt (Rotstayn et al., 2010), and it should be noted that indirect effects of dust
25
are not included in the model.
ACPD
11, 1595–1639, 2011ENSO-related rainfall variability and Australian dust
L. D. Rotstayn et al.
Title Page
Abstract Introduction
Conclusions References
Tables Figures
◭ ◮
◭ ◮
Back Close
Full Screen / Esc
Printer-friendly Version Interactive Discussion
Discussion
P
a
per
|
Dis
cussion
P
a
per
|
Discussion
P
a
per
|
Discussio
n
P
a
per
(TOMS), which indicate that most major dust sources correspond to topographic de-pressions (Prospero et al., 2002). These are typically dry lakes or riverbeds where a sufficiently deep layer of loose alluvial sediment was able to accumulate. Zender et al. (2003) found that assigning enhanced erodibility to topographic minima (as in Ginoux et al., 2001) realistically increases emissions in several regions, including the Lake
5
Eyre basin in central-eastern Australia. The characterisation of the Lake Eyre basin as the major Australian dust source is also broadly consistent with several studies cited in the Introduction. The dust source function depends on the prescribed spatial distribu-tion of soil erodibility for each dust size class and a threshold value of 10-metre wind speed (u10m). Above this threshold wind speedut, which is a function of soil moisture,
10
the dust source is proportional tou210m(u10m−ut); see Ginoux et al. (2004).
To account for mesoscale variations that are unresolved on the relatively coarse grid of our GCM, our dust emission scheme includes a parameterization of sub-grid gustiness due to deep convection and boundary-layer free convection, based on Re-delsperger et al. (2000). The term related to deep convection is (in m s−1)
15
Vdeep= 19.8R 2
1.5+R+R2) !0.4
(1)
whereR is the rainfall rate in cm per day. The term related to free convection is
Vfree=0.65w∗ (2)
wherew∗is the free convection velocity (Deardorff, 1970). As noted by Lunt and Valdes (2002), these terms can plausibly be added in quadrature, or linearly, with the latter
20
giving a larger effect. In the current version of our model, the terms are added linearly, so that the effective wind speed used in the dust emission scheme is
Ve
ff=V10+Vdeep+Vfree (3)
ACPD
11, 1595–1639, 2011ENSO-related rainfall variability and Australian dust
L. D. Rotstayn et al.
Title Page
Abstract Introduction
Conclusions References
Tables Figures
◭ ◮
◭ ◮
Back Close
Full Screen / Esc
Printer-friendly Version Interactive Discussion
Discussion
P
a
per
|
Dis
cussion
P
a
per
|
Discussion
P
a
per
|
Discussio
n
P
a
per
Transport of dust occurs by advection, vertical turbulent mixing and vertical transport inside deep convective clouds. Vertical advection is handled using a flux-corrected transport scheme (Van Leer, 1977), and horizontal advection is handled via a semi-Lagrangian scheme (McGregor, 1993). The treatment of vertical turbulent mixing is based on stability-dependent K-theory (Louis, 1979). Under convective conditions, an
5
additional non-local counter-gradient flux is added (Holtslag and Boville, 1993). Con-vective transport is based on the vertical profiles of the updraft mass flux and com-pensating subsidence generated by the convection scheme (Gregory and Rowntree, 1990).
Removal of dust from the atmosphere occurs via wet and dry deposition and
grav-10
itational settling. Wet deposition is linked to the formation of warm rain and frozen precipitation in the stratiform-cloud and convection schemes (Rotstayn and Lohmann, 2002). The treatment of dry deposition and gravitational settling is described by Ginoux et al. (2001).
The model’s dust optical properties were revised by Rotstayn et al. (2010), to
im-15
prove the shortwave treatment and to include longwave effects, which were previously omitted. The refractive indices used to derive the shortwave optical properties were revised due to mounting evidence from observations that older models tend to over-estimate the absorption of shortwave radiation by dust (Myhre et al., 2003; Yu et al., 2004). The revised scheme uses refractive indices based on measurements at Bahrain
20
(Dubovik et al., 2002); these have smaller imaginary components than the old refrac-tive indices, giving less absorprefrac-tive dust. In the mid-visible band (497.5–692.5 nm), the single scattering albedos (SSAs) for the four dust size bins (0.1–1, 1–2, 2–3 and 3– 6 µm) are 0.977, 0.943, 0.915 and 0.873 respectively. In the global mean, the bulk mid-visible SSA of dust (weighted by optical depth) is 0.961, confirming that dust is a
25
ACPD
11, 1595–1639, 2011ENSO-related rainfall variability and Australian dust
L. D. Rotstayn et al.
Title Page
Abstract Introduction
Conclusions References
Tables Figures
◭ ◮
◭ ◮
Back Close
Full Screen / Esc
Printer-friendly Version Interactive Discussion
Discussion
P
a
per
|
Dis
cussion
P
a
per
|
Discussion
P
a
per
|
Discussio
n
P
a
per
Longwave effects of dust were included by tabulating single-scattering properties from OPAC (Optical Properties of Aerosols and Clouds; Hess et al., 1998), using their mineral dust nucleation and accumulation modes to represent the radiation scheme’s small and large dust modes respectively.
2.2 Simulations
5
We compare two 160-year coupled atmosphere-ocean simulations with the CSIRO Mk3.6 GCM. Both simulations have forcing (greenhouse gases, anthropogenic aerosols and ozone) appropriate for the year 2000. The DUST run is a continuation of the 70-year run described by Rotstayn et al. (2010): we extended this run to a total of 240 years. The setup of the NODUST run is identical to that of the DUST run, except
10
that the Australian dust source is set to zero. NODUST was initialised from the end of the above 70-year run, and was also integrated to the end of year 240. We show results from the last 160 years of both simulations, to allow for a 10-year spinup period in NODUST. Hereafter, we label these as years 1 to 160, so that year 1 is equivalent to year 81 in the original terminology. To investigate dust-ENSO interactions, we will
15
mainly focus on the Austral spring season, September to November (SON), when the effect of ENSO on Australian rainfall is strongest (McBride and Nicholls, 1983).
The simulation of mean seasonal Australian climate in the earlier 70-year run was evaluated by Rotstayn et al. (2010), who found that in most respects the model per-formed well. In particular, calculation of a non-dimensional skill score (the “M-statistic”;
20
ACPD
11, 1595–1639, 2011ENSO-related rainfall variability and Australian dust
L. D. Rotstayn et al.
Title Page
Abstract Introduction
Conclusions References
Tables Figures
◭ ◮
◭ ◮
Back Close
Full Screen / Esc
Printer-friendly Version Interactive Discussion
Discussion
P
a
per
|
Dis
cussion
P
a
per
|
Discussion
P
a
per
|
Discussio
n
P
a
per
3 Results and discussion
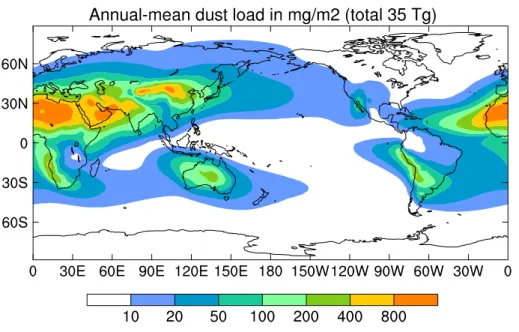
3.1 Dust simulation
The annual-mean global dust load from the DUST run is shown in Fig. 1. In common with other global modelling studies (e.g., Ginoux et al., 2001; Woodward, 2001; Tegen et al., 2002; Zender et al., 2003; Miller et al., 2006; Tanaka and Chiba, 2006; Yoshioka
5
et al., 2007), the dominance of the sources in the Northern Hemisphere is obvious. The total global dust load is 35 Tg, towards the high end of the range (8–36 Tg) found in 16 global models reviewed by Zender et al. (2004). This is likely due to the treatment of sub-grid wind fluctuations in the dust emission scheme (Eq. 3), which contributes to a relatively large global dust emission (3569 Tg yr−1) in the DUST run. This is
some-10
what larger than the range of 1000 to 3000 Tg that was found to be consistent with observations by Cakmur et al. (2006).
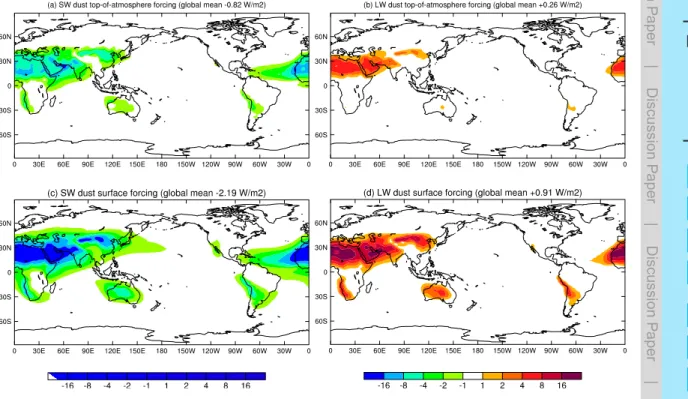
Figure 2 shows the direct radiative forcing of dust at the top of the atmosphere and the surface. We calculated these quantities by repeating the last 60 years of the DUST run with the inclusion of an additional radiation call every three hours (which
15
is the usual interval between radiation calls in the model). The global-mean top-of-atmosphere direct radiative effect of dust in the DUST run is −0.82 W m−2 (short-wave) and +0.26 W m−2 (longwave). These values are similar to those obtained in two recent modelling studies that also used updated refractive indices to represent less absorptive dust particles than previously assumed: Miller et al. (2006) obtained
20
−0.62 W m−2(shortwave) and+0.23 W m−2(longwave), and Yoshioka et al. (2007) ob-tained−0.92 W m−2 (shortwave) and +0.32 W m−2 (longwave). Due to the relatively high SSA (∼0.96) of dust, the top-of-atmosphere shortwave forcing is negative ev-erywhere, unlike some other models, where more absorptive dust can give positive shortwave forcing over surfaces with high albedo. As in other models, surface
short-25
ACPD
11, 1595–1639, 2011ENSO-related rainfall variability and Australian dust
L. D. Rotstayn et al.
Title Page
Abstract Introduction
Conclusions References
Tables Figures
◭ ◮
◭ ◮
Back Close
Full Screen / Esc
Printer-friendly Version Interactive Discussion
Discussion
P
a
per
|
Dis
cussion
P
a
per
|
Discussion
P
a
per
|
Discussio
n
P
a
per
forcing has a larger relative contribution from large particles. Also, dust shortwave forc-ing over oceans is enhanced in relative terms by the lower surface albedo. A useful recent summary of results from other models is given by Yue et al. (2010); this shows that the surface radiative forcing in our model is within the range of other results. The magnitude of both our shortwave and longwave surface forcing is larger than average,
5
probably due to our relatively large dust burden.
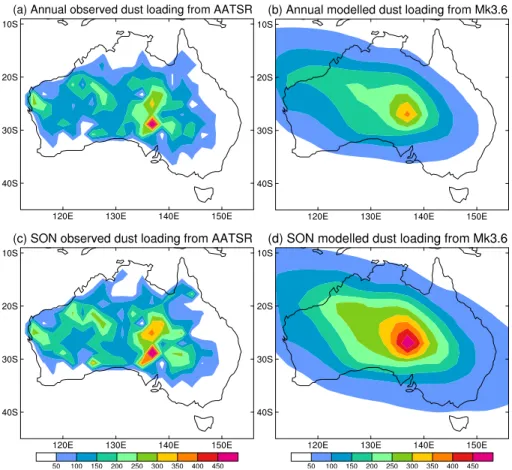
Before attempting to draw conclusions about the effects of dust in the Mk3.6 simula-tions, it is useful to compare the simulated distribution of Australian dust with observed values. Our observed distribution is based on a spatial pattern derived from Advanced Along-Track Scanning Radiometer (AATSR) satellite retrievals for the period 2002–
10
2008. A new algorithm for aerosol retrieval from AATSR has been developed, which enables the retrieval of aerosol optical depth (AOD) and identification of aerosol types. The algorithm will be discussed in two separate papers that are currently in preparation. It is based on classification of local aerosol types reported by Qin and Mitchell (2009), using a clustering analysis of sunphotometer observations at CSIRO Aerosol Ground
15
Station Network (AGSNet) sites, which are affiliated with NASA’s Aerosol Robotic Net-work (Mitchell and Campbell, 2004). Among the Australian aerosol classes is a dust aerosol, the particle size distribution of which allows dust mass loading to be derived from the AATSR AOD.
Figure 3 shows observed and modelled dust loading over Australia for annual-mean
20
and SON conditions. The model is broadly successful at capturing the spatial pattern of Australian dust, with the Lake Eyre Basin in central-eastern Australia as the dominant dust source. There is some evidence of a high bias in the modelled results relative to the satellite retrievals, especially in SON. The noisier pattern in the satellite-retrieved values probably reflects, at least in part, the much shorter time period for the satellite
25
record (six years as opposed to 160 years in the model).
ACPD
11, 1595–1639, 2011ENSO-related rainfall variability and Australian dust
L. D. Rotstayn et al.
Title Page
Abstract Introduction
Conclusions References
Tables Figures
◭ ◮
◭ ◮
Back Close
Full Screen / Esc
Printer-friendly Version Interactive Discussion
Discussion
P
a
per
|
Dis
cussion
P
a
per
|
Discussion
P
a
per
|
Discussio
n
P
a
per
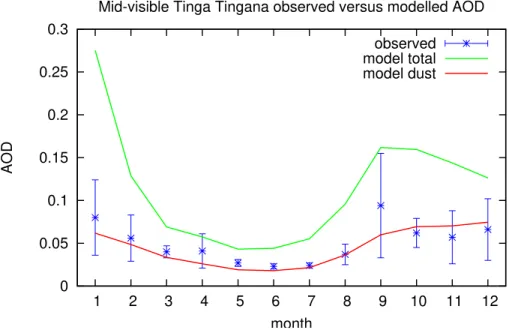
A 10-year aerosol climatology at this site (Mitchell et al., 2010) showed dual peaks in AOD in September and January, the former including a significant fine-particle mode characteristic of smoke from long-range transport, while the January peak was domi-nated by coarse particles characteristic of wind-blown dust.
Figure 4 compares the observed and modelled annual cycles of AOD. The
observa-5
tional cycle is the AOD from Mitchell et al. (2010) interpolated to 530 nm, with vertical bars equal to one standard deviation. The modelled cycles show the seasonal vari-ation of mid-visible AOD, both “total” and “dust only”. The comparison suggests that the modelled total AOD is unrealistically high throughout the year, particularly during the spring and summer peaks. These peaks are not present in the model’s “dust only”
10
AOD, and are likely due to an excessive contribution to AOD from biomass burning in the model. This is especially true in January, when the biomass-burning emissions used in this version of the model are too large over eastern Australia; the emissions are based on satellite retrievals for the year 2000 (Ito and Penner, 2004, 2005), which are probably not representative of the long-term average. Plots of the modelled distribution
15
of carbonaceous aerosol (not shown) indicate that the modelled AOD at Tinga Tin-gana is elevated by biomass-burning aerosol advected from northern Australia during the months of August to November, with a maximum effect in September. According to Mitchell et al. (2010), the observed AOD in September is also elevated by smoke aerosol from long-range transport, suggesting that this feature in the model is
qualita-20
tively realistic, though overestimated in magnitude.
In summary, the model qualitatively captures the annual cycle of AOD at Tinga Tin-gana, but overestimates the magnitude of the peaks in September and January due to an excessive contribution from biomass burning. Combining the results of Figs. 3 and 4, the model appears to moderately overestimate the Australian dust load and optical
25
ACPD
11, 1595–1639, 2011ENSO-related rainfall variability and Australian dust
L. D. Rotstayn et al.
Title Page
Abstract Introduction
Conclusions References
Tables Figures
◭ ◮
◭ ◮
Back Close
Full Screen / Esc
Printer-friendly Version Interactive Discussion
Discussion
P
a
per
|
Dis
cussion
P
a
per
|
Discussion
P
a
per
|
Discussio
n
P
a
per
3.2 Simulation of mean Australian climate
The simulation of seasonal-mean rainfall, surface air temperature and mean sea-level pressure (MSLP) in a shorter version of the DUST run was evaluated in detail by Rot-stayn et al. (2010), who found an overall improvement relative to earlier versions of the model. Before we investigated the ENSO-related rainfall variability in the DUST
5
and NODUST simulations, we considered whether there were any significant effects of Australian dust on the simulation of mean Australian climate by Mk3.6. When we compared the DUST and NODUST runs, we found that differences in simulated mean rainfall and MSLP were generally small and insignificant.
Since we will focus on variability of rainfall during SON, we show the mean SON
10
rainfall from observations and the model in Fig. 5. The DUST run (middle panel) is broadly able to capture the observed climatology shown in the left panel, although the model has a dry bias compared to the observations. The difference between the DUST and NODUST runs (right panel) confirms that, although there is an area in eastern Australia where the DUST run has slightly higher rainfall in SON, the differences are
15
generally not statistically significant. This was also the case in other seasons (not shown).
However, there was a small but statistically significant increase of annual-mean sur-face air temperature over the Australian continent in the DUST run. This was seen more strongly in the daily minimum temperatures (0.24 K) than in daily maxima (+0.09 K),
20
ACPD
11, 1595–1639, 2011ENSO-related rainfall variability and Australian dust
L. D. Rotstayn et al.
Title Page
Abstract Introduction
Conclusions References
Tables Figures
◭ ◮
◭ ◮
Back Close
Full Screen / Esc
Printer-friendly Version Interactive Discussion
Discussion
P
a
per
|
Dis
cussion
P
a
per
|
Discussion
P
a
per
|
Discussio
n
P
a
per
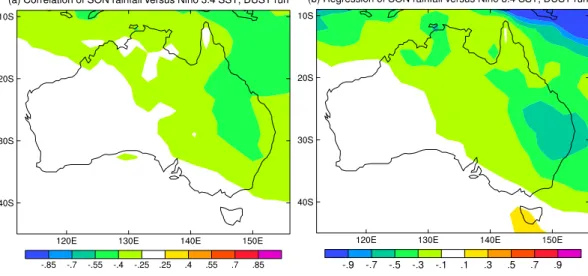
3.3 Observed and modelled ENSO-rainfall relationships
In this section, we will compare the ENSO-rainfall relationships in the DUST and NODUST runs with corresponding observed relationships during SON, using standard linear regression. Sea surface temperature (SST) observations are the 1◦ gridded analysis from HadISST2 (Rayner et al., 2003), and rainfall observations are from the
5
Australian Water Availability Project (AWAP; Jones et al., 2009). We follow the common practice of measuring the state of ENSO using SST averaged over the Ni ˜no 3.4 region (170◦W–120◦W, 5◦S–5◦N). The standard deviation of Ni ˜no 3.4 SST (taking each SON average as a single data point) is 0.64 K in DUST and 0.63 K in NODUST (compared to 0.81 K in HadISST2). Thus, when we show the results of the linear regression relative
10
to a 1 K change in Ni ˜no 3.4 SST, this represents somewhat less than a±1 standard deviation change.
Figure 6 shows the observed relationships between Ni ˜no3.4 SST and Australian rainfall for the period 1901–2007. These plots confirm the results of earlier studies, that there is a strong relationship between ENSO and Australian rainfall in spring, mainly
15
over the eastern two-thirds of the continent (McBride and Nicholls, 1983; Ropelewski and Halpert, 1987).
Figure 7 shows the same relationships for the DUST run. The model is rather suc-cessful at capturing the observed relationships, with significant correlations between
−0.25 and−0.55 over most of eastern Australia, and regression slopes that are
com-20
parable in magnitude to those in the right panel of Fig. 6. Note that, due to the model’s relatively coarse resolution (approximately 1.9◦, compared to 0.25◦ in the observa-tions), it would not be expected to resolve the enhanced rainfall over the Alps in south-eastern Australia, or along the Queensland coast. Over some parts of central-south-eastern Australia, the modelled correlations and regression slopes are somewhat stronger than
25
the observed values.
ACPD
11, 1595–1639, 2011ENSO-related rainfall variability and Australian dust
L. D. Rotstayn et al.
Title Page
Abstract Introduction
Conclusions References
Tables Figures
◭ ◮
◭ ◮
Back Close
Full Screen / Esc
Printer-friendly Version Interactive Discussion
Discussion
P
a
per
|
Dis
cussion
P
a
per
|
Discussion
P
a
per
|
Discussio
n
P
a
per
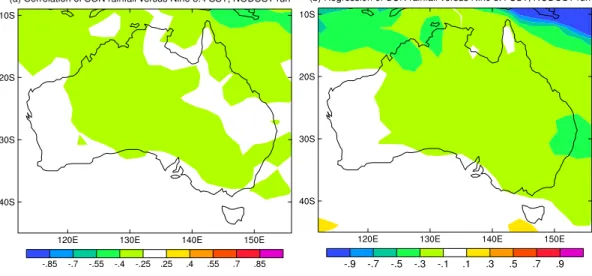
areas of eastern Australia, the correlations are not significant (|r|<0.25). The region of significant correlation also extends further to the west in NODUST, which agrees less well with the observed relationship.
Figure 9 shows the difference of the Ni ˜no3.4 SST – rainfall regression slopes be-tween the DUST and NODUST runs. Statistical significance is assessed using a t-test
5
for the difference of regression slopes (Zar, 1996, chapter 17). This plot confirms that inclusion of Australian dust amplifies the modelled ENSO-rainfall relationship over eastern Australia and weakens it over parts of western Australia. In total, there are 19 grid points over eastern Australia (stippled in the plot) where the Ni ˜no3.4 SST – rainfall regression slope is significantly different in the two runs.
10
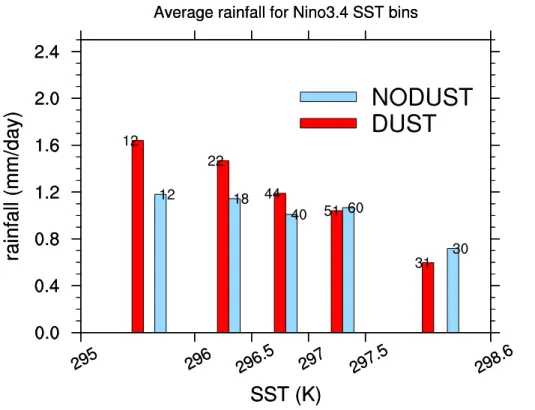
Is the stronger ENSO-rainfall relationship over eastern Australia in the DUST run due to wet years becoming wetter, dry years becoming drier, or both? For each of the SON seasons, we averaged the rainfall over the stippled points in eastern Australia in Fig. 9, and plotted a scatter diagram of these 160 data points against Ni ˜no3.4 SST for both runs (not shown). This confirmed the above result that the regression slope
15
is steeper in DUST than in NODUST, and the correlation between Ni ˜no3.4 SST and rainfall is also markedly stronger in DUST (r=−0.48) than in NODUST (r=−0.27). To make this clearer, we sorted the data points into 0.5◦ Ni ˜no3.4-SST bins, and plotted them as a histogram in Fig. 10. This confirms that wet years are wetter and dry years are drier in the DUST run (red bars) than in the NODUST run (blue bars). There is
20
a monotonic change in the effect of dust with increasing SST: there is a dust-induced rainfall increase of 39%, 28% and 18% in the first, second and third SST bins, and a dust-induced rainfall decrease of 2.5% and 17% in the fourth and fifth SST bins. This also shows that, even in relative terms, the effect of dust is stronger in wet years than in dry years. It is also seen that, averaged over the points used to construct the
25
ACPD
11, 1595–1639, 2011ENSO-related rainfall variability and Australian dust
L. D. Rotstayn et al.
Title Page
Abstract Introduction
Conclusions References
Tables Figures
◭ ◮
◭ ◮
Back Close
Full Screen / Esc
Printer-friendly Version Interactive Discussion
Discussion
P
a
per
|
Dis
cussion
P
a
per
|
Discussion
P
a
per
|
Discussio
n
P
a
per
3.4 Possible mechanism of dust-ENSO feedback
Is the dust radiative forcing over Australia large enough to exert substantial dynamic effects? In Fig. 11 we show average dust shortwave atmospheric heating and surface radiative forcing for SON, averaged over the latitude range 20.5◦S to 29.8◦S. The lati-tude range was chosen to roughly capture the region where the dust-induced change
5
in the regression slope of rainfall versus Ni ˜no3.4-SST is significant in Fig. 9, and end points of the range correspond to the edges of model grid boxes. Peak atmospheric heating of more than 0.1 K day−1occurs near the surface at about 130◦E. Somewhat larger values were shown for SON over Australia by Miller et al. (2004), but their mid-visible SSA was substantially lower (0.906 in the global mean, compared to 0.961 in
10
our model), so this seems fairly consistent. Comparison with other studies suggests that these heating rates are large enough to induce significant circulation changes. For example, Lau et al. (2006) simulated aerosol shortwave heating rates of 0.2 to 0.4 K day−1 over the Tibetan Plateau, and argued that the convection induced by this “elevated heat pump” draws in warm and moist air over the Indian subcontinent prior to
15
the onset of the monsoon. Dust surface radiative forcing in our simulation is also sub-stantial: it reaches almost−10 W m−2near 137◦E, and its magnitude exceeds 4 W m−2 over a wide area.
Rotstayn et al. (2010) showed that dust loading over Australia in Mk3.6 is strongly correlated with ENSO, especially over eastern and northern Australia. This makes
20
sense, because rainfall strongly affects the source function for dust (via its effect on soil moisture) as well as the sink via wet deposition. We thus expect that dust radiative forcing will also be correlated with ENSO in the DUST run.
To examine the dust-ENSO dynamic feedback in more detail, we regressed three-dimensional dust concentrations and dust shortwave heating rates against Ni
˜no3.4-25
ACPD
11, 1595–1639, 2011ENSO-related rainfall variability and Australian dust
L. D. Rotstayn et al.
Title Page
Abstract Introduction
Conclusions References
Tables Figures
◭ ◮
◭ ◮
Back Close
Full Screen / Esc
Printer-friendly Version Interactive Discussion
Discussion
P
a
per
|
Dis
cussion
P
a
per
|
Discussion
P
a
per
|
Discussio
n
P
a
per
response centred below 900 hPa and between about 135◦E and 150◦E. The location of the positive correlation is consistent with the area where SON rainfall is positively correlated with Ni ˜no3.4-SST in Fig. 7, and also agrees quite well with the area in east-ern Australia where the dust-induced enhancement of the rainfall–ENSO relationship is significant (Fig. 9). There is a smaller area west of about 125◦E where dust
con-5
centration decreases with Ni ˜no3.4-SST, although this relationship is less strong than the increase over eastern Australia. This decrease cannot be explained by changes in rainfall, and is due to a decrease of surface wind speed with Ni ˜no3.4-SST in that re-gion (Fig. 13). This is part of a larger pattern that extends westward across the Indian Ocean, where the climatological easterly winds are weakend by enhanced westerly
10
flow in El Ni ˜no years (not shown). This is consistent with a previously reported con-traction and strengthening of the Hadley cell under El Ni ˜no (Lu et al., 2008), which increases confidence that it is associated with a coherent dynamical response.
How do the ENSO-induced changes in dust affect atmospheric heating and dust-induced radiative forcing at the surface? The regression of dust shortwave radiative
15
forcing against Ni ˜no3.4-SST is shown in Fig. 14. East of about 120◦E, increasing Ni ˜no3.4-SST gives an increase of dust-induced heating of the lower troposphere and cooling of the surface. The magnitude of the surface forcing peaks near 145◦E, which is east of the maximum change in dust concentration, whereas the largest response of atmospheric heating is further to the west. The surface forcing is increased by
20
lower surface albedo near the east coast, whereas atmospheric heating is increased by stronger insolation and higher surface albedo in the arid zone. West of about 120◦E, there is a relatively small decrease of atmospheric heating with increasing Ni ˜no3.4-SST, related to the decrease of dust concentration shown in Fig. 12.
The water vapour balance of an atmospheric column in equilibrium is given by
(Perl-25
witz and Miller, 2010)
− ∇ ·Mq=P−E (4)
whereMq is the horizontal flux of specific humidity integrated over the atmospheric
ACPD
11, 1595–1639, 2011ENSO-related rainfall variability and Australian dust
L. D. Rotstayn et al.
Title Page
Abstract Introduction
Conclusions References
Tables Figures
◭ ◮
◭ ◮
Back Close
Full Screen / Esc
Printer-friendly Version Interactive Discussion
Discussion
P
a
per
|
Dis
cussion
P
a
per
|
Discussion
P
a
per
|
Discussio
n
P
a
per
precipitation. Equation 4 can also be used to estimate the contribution to precipitation from moisture transport (derived asP−E), assuming no net accumulation of moisture in the column. Figure 15 showsP−E, sorted into 0.5◦Ni ˜no3.4-SST bins, for the same model columns used in Fig. 10. This suggests that in the DUST run, precipitation in these columns is enhanced by moisture convergence in the first two SST bins, whereas
5
in NODUST there is net atmospheric moisture divergence across all SST bins.
Numerous studies have shown that aerosols reduce surface insolation, which must be balanced by weaker latent and sensible heat fluxes (Ramanathan et al., 2001; Rod-erick and Farquhar, 2002; Liepert et al., 2004). Absorption of shortwave radiation by aerosols such as dust also causes heating of the lower troposphere and cooling of
10
the surface, which is expected to stabilise the lower atmosphere and reduce convec-tion (Satheesh and Moorthy, 2005). This has been shown on regional scales in sev-eral modelling studies (Jiang and Feingold, 2006; Grini et al., 2006; Fan et al., 2008; Wendisch et al., 2008). Our results suggest that under suppressed (El Ni ˜no) condi-tions, the surface radiative effect of dust reduces convection in this manner. However,
15
there is also evidence that diabatic heating due to absorbing aerosols can enhance ascent and moisture convergence, leading to increased convection and precipitation (Stephens et al., 2004; Lau et al., 2006; Randles and Ramaswamy, 2008; Solmon et al., 2008; Lau et al., 2009; Perlwitz and Miller, 2010). In a recent attempt to synthe-sise the semi-direct effects of absorbing aerosols, Koch and Del Genio (2010) argued
20
that absorbing aerosols below cloud may enhance convection and cloud cover. The climatological SON cloud cover over Australia in our model lies mostly above the dust layer (not shown). It is thus possible that this is the dominant mechanism in our model under convective (La Ni ˜na) conditions in eastern Australia.
Over parts of north-western Australia, dust concentration decreases with
increas-25
ACPD
11, 1595–1639, 2011ENSO-related rainfall variability and Australian dust
L. D. Rotstayn et al.
Title Page
Abstract Introduction
Conclusions References
Tables Figures
◭ ◮
◭ ◮
Back Close
Full Screen / Esc
Printer-friendly Version Interactive Discussion
Discussion
P
a
per
|
Dis
cussion
P
a
per
|
Discussion
P
a
per
|
Discussio
n
P
a
per
circulation change over the north-west in response to the dust-induced changes over eastern Australia, along the lines of that described by Stephens et al. (2004).
3.5 Discussion of uncertainties
Our results show that, in the CSIRO Mk3.6 GCM, dust over eastern Australia tends to exert a negative feedback on rainfall under El Ni ˜no conditions and a positive feedback
5
under La Ni ˜na conditions. This is intriguing, because it suggests that the radiative feed-back of dust on rainfall is potentially of opposite sign under suppressed and convective conditions. We noted examples in the literature of negative and positive feedbacks on convection due to the radiative effects of absorbing aerosols. However, further work is needed to understand why a negative (positive) feedback should be dominant under
10
suppressed (convective) conditions.
An interesting comparison is with Heinold et al. (2008), who described both positive and negative dust radiative feedbacks on surface wind speeds in a regional modelling study of Saharan dust over a one-week period. Dust feedbacks caused higher surface wind speeds when momentum was mixed downwards to the ground by turbulence.
15
Under stable conditions, thermal stratification suppressed turbulent mixing and dust-induced stabilisation caused lower surface wind speeds. Although the context is slightly different, their study provides a precedent whereby dust can generate positive and negative feedbacks, depending on the atmospheric stratification and the degree of stabilisation by mineral dust.
20
The preceding arguments are based on the shortwave radiative effects of dust. Our model does include longwave effects of dust, and a number of studies confirm that these are non-negligible (e.g., Highwood et al., 2003; Haywood et al., 2005; Hansell et al., 2010; Yue et al., 2010). We justify this simplification because convective rain-fall over continental areas in GCMs is usually largest in the middle of the day, when
25
ACPD
11, 1595–1639, 2011ENSO-related rainfall variability and Australian dust
L. D. Rotstayn et al.
Title Page
Abstract Introduction
Conclusions References
Tables Figures
◭ ◮
◭ ◮
Back Close
Full Screen / Esc
Printer-friendly Version Interactive Discussion
Discussion
P
a
per
|
Dis
cussion
P
a
per
|
Discussion
P
a
per
|
Discussio
n
P
a
per
the resulting convective precipitation maximum tends to occur in the late afternoon or evening (Nesbitt and Zipser, 2003), whereas GCMs tend to lead the observed diurnal cycle by several hours (Yang and Slingo, 2001; Collier and Bowman, 2004). In our current simulations, we only saved monthly mean output, so we are unable to resolve the diurnal cycle, but this may be important for a more rigorous analysis.
5
In addition to the above analysis, we considered whether dust-induced changes in atmospheric circulation or evaporation of moisture from the ocean surface could explain the different rainfall response in the DUST and NODUST runs. However, we were unable to find a plausible explanation via these avenues. It is possible that diagnostics of moisture transport (which were not available to us) would yield valuable insight.
10
Another possible approach is the use of composites, to separately examine warm and cool ENSO events.
Another uncertainty concerns the simulation of ENSO itself in the model. In common with most other GCMs, Mk3.6 suffers from the Pacific equatorial cold-tongue bias: the tongue of SST anomalies associated with ENSO extends too far west towards the
east-15
ern Indian Ocean, which is expected to generate an ENSO-rainfall relationship that is centred too far west over Australia (e.g., Shi et al., 2008). This suggests that a useful extension of the present study would be to perform an ensemble of atmosphere-only runs following the protocol of the Atmospheric Model Intercomparison Project (AMIP). However, it should be noted that such atmosphere-only simulations also have
limita-20
tions, e.g., inclusion of a radiative perturbation may alter the land-sea contrast in an unrealistic way, since SSTs are unable to respond to the perturbation.
Comparison with observations suggests that the radiative effects of dust may be over-estimated in our model, so the impact of dust on the simulated rainfall variability may also be exaggerated. On the other hand, the model uses prescribed vegetation, so
25
ACPD
11, 1595–1639, 2011ENSO-related rainfall variability and Australian dust
L. D. Rotstayn et al.
Title Page
Abstract Introduction
Conclusions References
Tables Figures
◭ ◮
◭ ◮
Back Close
Full Screen / Esc
Printer-friendly Version Interactive Discussion
Discussion
P
a
per
|
Dis
cussion
P
a
per
|
Discussion
P
a
per
|
Discussio
n
P
a
per
4 Summary and conclusions
We compared two 160-year coupled atmosphere-ocean simulations of modern-day climate using the CSIRO Mk3.6 GCM. The DUST simulation included an interactive treatment of mineral dust and its direct radiative effects. This was a longer version of a similar run described by Rotstayn et al. (2010), who noted an improved simulation of
5
Australian rainfall variability in Mk3.6 compared to its predecessor (Mk3.5) and several other GCMs. They hypothesised that “active” dust (which interacts with the model’s hydrological cycle) might contribute to the improved simulation in Mk3.6 relative to Mk3.5. Their hypothesis was based on qualitative arguments, since they did not have access to a pair of simulations in which only one thing was changed. This motivated
10
us to perform a second run (NODUST), which was identical to DUST, except that the Australian dust source was set to zero.
Comparison of the dust simulation with observations and other models led us to con-clude that our dust concentrations and resultant radiative forcing are probably some-what too large. We attributed this to the treatment of sub-grid wind speed used in the
15
dust emission scheme. However, the spatial pattern of dust over Australia was cap-tured rather well by our model, in which the dust emission scheme assigns enhanced erodibility to topographic depressions (Ginoux et al., 2001).
To investigate possible dust-ENSO-rainfall feedbacks in the model, we focused on the austral spring season (SON), when the correlation between rainfall and ENSO is
20
strongest over Australia. We used ordinary least squares linear regression against Ni ˜no3.4-SST to characterise the variation of rainfall, dust and other quantities with re-spect to ENSO. We found that the ENSO-rainfall relationship over eastern Australia was stronger in the DUST run: dry (El Ni ˜no) years tended to be drier, and wet (La Ni ˜na) years wetter. The ENSO-rainfall relationship was also weaker over north-western
25
ACPD
11, 1595–1639, 2011ENSO-related rainfall variability and Australian dust
L. D. Rotstayn et al.
Title Page
Abstract Introduction
Conclusions References
Tables Figures
◭ ◮
◭ ◮
Back Close
Full Screen / Esc
Printer-friendly Version Interactive Discussion
Discussion
P
a
per
|
Dis
cussion
P
a
per
|
Discussion
P
a
per
|
Discussio
n
P
a
per
loading showed a positive relationship with Ni ˜no3.4-SST, due to the strong negative dependence of dust concentration on rainfall in the model. The proposed mechanism over eastern Australia involved stabilisation of the surface layer due to enhanced short-wave atmospheric heating and surface cooling in El Ni ˜no years, and enhanced ascent and moisture convergence driven by dust-induced radiative heating in La Ni ˜na years.
5
Over parts of north-western Australia, dust loading showed a negative relationship with Ni ˜no3.4-SST, which was explained by decreasing near-surface wind speeds with in-creasing Ni ˜no3.4-SST. The location of these dein-creasing wind speeds agreed well with the region where the dust-ENSO relationship was significantly weakened by inclusion of dust. It thus seems plausible that, in that region, inclusion of dust acts to weaken
10
the ENSO-rainfall relationship via an inverse process to that which occurs over eastern Australia. As discussed in Sect. 3.5, these arguments are only tentative at present, and further work is needed to clarify the mechanism.
Although the Australian dust source is smaller than the major sources in the North-ern Hemisphere, our results show that the direct radiative effects of Australian dust
15
may have important interactions with climate variability. The results suggest that (1) a realistic treatment of Australian dust may be necessary for accurate simulation of the ENSO-rainfall relationship over Australia, and (2) radiative feedbacks involving dust may be important for understanding natural rainfall variability over Australia. (1) is potentially important for climate modelling, because ENSO dominates rainfall
variabil-20
ity over most of eastern and central Australia, and the response of ENSO to climate change is an active research question (Collins et al., 2010). (2) raises various research questions, e.g., it is possible that there is a positive feedback on drought induced by the recent observed increase in Australian dust (Mitchell et al., 2010). Although our model tends to over-estimate the Australian dust source, it is possible that the use of
25
ACPD
11, 1595–1639, 2011ENSO-related rainfall variability and Australian dust
L. D. Rotstayn et al.
Title Page
Abstract Introduction
Conclusions References
Tables Figures
◭ ◮
◭ ◮
Back Close
Full Screen / Esc
Printer-friendly Version Interactive Discussion
Discussion
P
a
per
|
Dis
cussion
P
a
per
|
Discussion
P
a
per
|
Discussio
n
P
a
per
Acknowledgements. This work was funded in part by the Australian Climate Change Science Program (ACCSP).
References
Bullard, J., Baddock, M., McTainsh, G., and Leys, J.: Sub-basin scale dust source geomorphol-ogy detected using MODIS, Geophys. Res. Lett., 35, L15404, doi:10.1029/2008GL033928,
5
2008. 1598
Cakmur, R. V., Miller, R. L., Perlwitz, J., Geogdzhayev, I. V., Ginoux, P., Koch, D., Kohfeld, K. E., Tegen, I., and Zender, C. S.: Constraining the magnitude of the global dust cycle by minimizing the difference between a model and observations, J. Geophys. Res., 111, D6207, doi:10.1029/2005JD005791, 2006. 1604
10
Chou, M.-D. and Lee, K.-T.: A Parameterization of the Effective Layer Emission for Infrared Radiation Calculations, J. Atmos. Sci., 62, 531–541, 2005. 1600
Collier, J. C. and Bowman, K. P.: Diurnal cycle of tropical precipitation in a general circulation model, J. Geophys. Res., 109, D17105, doi:10.1029/2004JD004818, 2004. 1614
Collins, M., An, S.-I., Cai, W., Ganachaud, A., Guilyardi, E., Jin, F.-F., Jochum, M., Lengaigne,
15
M., Power, S., Timmermann, A., Vecchi, G., and Wittenberg, A.: The impact of global warming on the tropical Pacific ocean and El Nino, Nat. Geosci., 3, 391–397, doi:10.1038/ NGEO868, 2010. 1616
Cook, B. I., Miller, R. L., and Seager, R.: Amplification of the North American “Dust Bowl” drought through human-induced land degradation, P. Natl. Acad. Sci. USA, 106, 4997–5001,
20
doi:10.1073/pnas.0810200106, 2009. 1598
Deardorff, J. W.: Convective velocity and temperature scales for the unstable planetary bound-ary layer and for Rayleigh convection, J. Atmos. Sci., 27, 1211–1213, 1970. 1601
Dubovik, O., Holben, B., Eck, T., Smirnov, A., Kaufman, Y., King, M., Tanre, D., and Slutsker, I.: Variability of absorption and optical properties of key aerosol types observed in worldwide
25
locations, J. Atmos. Sci., 59, 590–608, 2002. 1602
Evan, A. T., Dunion, J., Foley, J. A., Heidinger, A. K., and Velden, C. S.: New evidence for a relationship between Atlantic tropical cyclone activity and African dust outbreaks, Geophys. Res. Lett., 33, L19813, doi:10.1029/2006GL026408, 2006. 1598
Fan, J., Zhang, R., Tao, W., and Mohr, K. I.: Effects of aerosol optical properties on
ACPD
11, 1595–1639, 2011ENSO-related rainfall variability and Australian dust
L. D. Rotstayn et al.
Title Page
Abstract Introduction
Conclusions References
Tables Figures
◭ ◮
◭ ◮
Back Close
Full Screen / Esc
Printer-friendly Version Interactive Discussion
Discussion
P
a
per
|
Dis
cussion
P
a
per
|
Discussion
P
a
per
|
Discussio
n
P
a
per
deep convective clouds and radiative forcing, J. Geophys. Res., 113, D8209, doi:10.1029/ 2007JD009257, 2008. 1612
F ´ecan, F., Marticorena, B., and Bergametti, G.: Parametrization of the Increase of the Aeolian Erosion Threshold Wind Friction Velocity Due to Soil Moisture for Arid and Semi-Arid Areas, Ann. Geophysicae., 17, 149–157, 1999. 1597
5
Gillette, D. A. and Passi, R.: Modeling dust emission caused by wind erosion, J. Geophys. Res., 93, 14233–14242, 1988. 1597
Ginoux, P., Chin, M., Tegen, I., Prospero, J. M., Holben, B., Dubovik, O., and Lin, S.-J.: Sources and distributions of dust aerosols simulated with the GOCART model, J. Geophys. Res., 106, 20255–20273, doi:10.1029/2000JD000053, 2001. 1600, 1601, 1602, 1604, 1615
10
Ginoux, P., Prospero, J. M., Torres, O., and Chin, M.: Long-term simulation of global dust distribution with the GOCART model: correlation with North Atlantic Oscillation, Environ. Modell. Softw., 19, 113–128, 2004. 1600, 1601
Gordon, H. B., O’Farrell, S. P., Collier, M. A., Dix, M. R., Rotstayn, L. D., Kowalczyk, E. A., Hirst, A. C., and Watterson, I. G.: The CSIRO Mk3.5 Climate Model, Technical Report No. 21,
15
The Centre for Australian Weather and Climate Research, Aspendale, Vic., Australia, 62 pp., available online at: http://www.cawcr.gov.au/publications/technicalreports.php, 2010. 1600 Grant, K. E., Chuang, C. C., Grossman, A. S., and Penner, J. E.: Modeling the spectral optical
properties of ammonium sulfate and biomass burning aerosols: parameterization of relative humidity effects and model results, Atmos. Environ., 33, 2603–2620, 1999. 1600
20
Gregory, D. and Rowntree, P. R.: A mass flux convection scheme with representation of cloud ensemble characteristics and stability-dependent closure, Mon. Weather Rev., 118, 1483– 1506, 1990. 1602
Grini, A., Tulet, P., and Gomes, L.: Dusty weather forecasts using the MesoNH mesoscale atmospheric model, J. Geophys. Res., D19205, doi:10.1029/2005JD007007, 2006. 1612
25
Hansell, R. A., Tsay, S. C., Ji, Q., Hsu, N. C., Jeong, M. J., Wang, S. H., Reid, J. S., Liou, K. N., and Ou, S. C.: An Assessment of the Surface Longwave Direct Radiative Effect of Airborne Saharan Dust during the NAMMA Field Campaign, J. Atmos. Sci., 67, 1048–1065, doi:10.1175/2009JAS3257.1, 2010. 1613
Haywood, J., Francis, P., Osborne, S., Glew, M., Loeb, N., Highwood, E., Tanr ´e, D., Myhre, G.,
30
ACPD
11, 1595–1639, 2011ENSO-related rainfall variability and Australian dust
L. D. Rotstayn et al.
Title Page
Abstract Introduction
Conclusions References
Tables Figures
◭ ◮
◭ ◮
Back Close
Full Screen / Esc
Printer-friendly Version Interactive Discussion
Discussion
P
a
per
|
Dis
cussion
P
a
per
|
Discussion
P
a
per
|
Discussio
n
P
a
per
Haywood, J. M., Allan, R. P., Culverwell, I., Slingo, T., Milton, S., Edwards, J., and Clerbaux, N.: Can desert dust explain the outgoing longwave radiation anomaly over the Sahara during July 2003?, J. Geophys. Res., 110, D05105, doi:10.1029/2004JD005232, 2005. 1613 Heinold, B., Tegen, I., Schepanski, K., and Hellmuth, O.: Dust radiative feedback on Saharan
boundary layer dynamics and dust mobilization, Geophys. Res. Lett., 35, L20817, doi:10.
5
1029/2008GL035319, 2008. 1613
Hess, M., Koepke, P., and Schult, I.: Optical properties of aerosols and clouds: The software package OPAC, B. Ame. Meteor. Soc., 79, 831–844, 1998. 1603
Highwood, E. J., Haywood, J. M., Silverstone, M. D., Newman, S. M., and Taylor, J. P.: Radiative properties and direct effect of Saharan dust measured by the C-130 aircraft during Saharan
10
Dust Experiment (SHADE): 2. Terrestrial spectrum, J. Geophys. Res., 108, 8578, doi:10. 1029/2002JD002552, 2003. 1613
Holtslag, A. A. M. and Boville, B. A.: Local versus non-local boundary layer diffusion in a global climate model, J. Climate, 6, 1825–1842, 1993. 1602
Ishizuka, M., Mikami, M., Leys, J., Yamada, Y., Heidenreich, S., Shao, Y., and McTainsh, G. H.:
15
Effects of soil moisture and dried raindroplet crust on saltation and dust emission, J. Geo-phys. Res., 113, D24212, doi:10.1029/2008JD009955, 2008. 1597
Ito, A. and Penner, J. E.: Global estimates of biomass burning emissions based on satellite imagery for the year 2000, J. Geophys. Res., 109, D14S05, doi:10.1029/2003JD004423, 2004. 1606
20
Ito, A. and Penner, J. E.: Historical emissions of carbonaceous aerosols from biomass and fossil fuel burning for the period 1870–2000, Glob. Biogeochem. Cy., 19, GB2028, doi:10. 1029/2004GB002374, 2005. 1606
Jiang, H. and Feingold, G.: Effect of aerosol on warm convective clouds: Aerosol-cloud-surface flux feedbacks in a new coupled large eddy model, J. Geophys. Res., 111, D01202, doi:
25
10.1029/2005JD006138, 2006. 1612
Jones, D. A., Wang, W., and Fawcett, R.: High-quality spatial climate data-sets for Australia, Aust. Meteorol. Oceanogr. J., 58, 233–248, 2009. 1608
Koch, D. and Del Genio, A. D.: Black carbon semi-direct effects on cloud cover: review and syn-thesis, Atmos. Chem. Phys., 10, 7685–7696, doi:10.5194/acp-10-7685-2010, 2010. 1612
30
ACPD
11, 1595–1639, 2011ENSO-related rainfall variability and Australian dust
L. D. Rotstayn et al.
Title Page
Abstract Introduction
Conclusions References
Tables Figures
◭ ◮
◭ ◮
Back Close
Full Screen / Esc
Printer-friendly Version Interactive Discussion
Discussion
P
a
per
|
Dis
cussion
P
a
per
|
Discussion
P
a
per
|
Discussio
n
P
a
per
Lau, K. M., Kim, K. M., Sud, Y. C., and Walker, G. K.: A GCM study of the response of the atmospheric water cycle of West Africa and the Atlantic to Saharan dust radiative forcing, Ann. Geophys., 27, 4023–4037, doi:10.5194/angeo-27-4023-2009, 2009. 1612
Liao, H. and Seinfeld, J. H.: Effect of clouds on direct aerosol radiative forcing of climate, J. Geophys. Res., 103, 3781–3788, 1998. 1597
5
Liepert, B. G., Feichter, J., Lohmann, U., and Roeckner, E.: Can aerosols spin down the water cycle in a warmer and moister world?, Geophys. Res. Lett., 31, L06207, doi: 10.1029/2003GL019060, 2004. 1612
Louis, J.-F.: A Parametric Model of Vertical Eddy Fluxes in the Atmosphere, Bound. Layer Meteorol., 17, 187–202, 1979. 1602
10
Lu, J., Chen, G., and Frierson, D. M. W.: Response of the Zonal Mean Atmospheric Circulation to El Nino versus Global Warming, J. Climate, 21, 5835–5851, doi:10.1175/2008JCLI2200.1, 2008. 1611
Lunt, D. J. and Valdes, P. J.: The modern dust cycle: Comparison of model results with obser-vations and study of sensitivities, J. Geophys. Res., 107, 4669, doi:10.1029/2002JD002316,
15
2002. 1601
Mackie, D. S., Boyd, P. W., McTainsh, G. H., Tindale, N. W., Westberry, T. K., and Hunter, K. A.: Biogeochemistry of iron in Australian dust: From eolian uplift to marine uptake, Geochem. Geophys. Geosyst., 9, Q03Q08, doi:10.1029/2007GC001813, 2008. 1597, 1598
McBride, J. L. and Nicholls, N.: Seasonal relationships between Australian rainfall and the
20
Southern Oscillation, Mon. Weather Rev., 111, 1998–2004, 1983. 1603, 1608
McGregor, J. L.: Economical Determination of Departure Points for Semi-Lagrangian Models, Mon. Weather Rev., 121, 221–230, 1993. 1602
McTainsh, G. H., Leys, J. F., and Nickling, W.: Wind erodibility of arid lands in the channel country of western Queensland, Australia, Z. Geomorphol., 116, 113–130, 1999. 1597
25
McTainsh, G. H., Tews, E. K., and Leys, J. F. Bastin, G.: Spatial and temporal trends in wind erosion of Australian rangelands during 1960 to 2005 using the Dust Storm Index (DSI), Report for the Australian Collaborative Rangeland Information System [ACRIS], available at: http://www.environment.gov.au/land/publications/acris/wind-erosion.html, 2007. 1598 Miller, R. L., Tegen, I., and Perlwitz, J.: Surface radiative forcing by soil dust aerosols and the
30
hydrologic cycle, J. Geophys. Res., 109, D04203, doi:10.1029/2003JD004085, 2004. 1597, 1602, 1610
ACPD
11, 1595–1639, 2011ENSO-related rainfall variability and Australian dust
L. D. Rotstayn et al.
Title Page
Abstract Introduction
Conclusions References
Tables Figures
◭ ◮
◭ ◮
Back Close
Full Screen / Esc
Printer-friendly Version Interactive Discussion
Discussion
P
a
per
|
Dis
cussion
P
a
per
|
Discussion
P
a
per
|
Discussio
n
P
a
per
K. E., Prigent, C., Ruedy, R., Schmidt, G. A., and Tegen, I.: Mineral dust aerosols in the NASA goddard institute for Space Sciences ModelE atmospheric general circulation model, J. Geophys. Res., 111, D06208, doi:10.1029/2005JD005796, 2006. 1604
Mitchell, R. M. and Campbell, S. K.: The Australian Aerosol Ground Station Network: Status Report and Development of a Radiometric Calibration Facility, Optica Pura y Aplicada, 37,
5
3259–3262, 2004. 1605
Mitchell, R. M., Campbell, S. K., and Qin, Y.: Recent increase in aerosol loading over the Australian arid zone, Atmos. Chem. Phys., 10, 1689–1699, doi:10.5194/acp-10-1689-2010, 2010. 1598, 1599, 1606, 1616
Myhre, G., Grini, A., Haywood, J. M., Stordal, F., Chatenet, B., Tanr ´e, D., Sundet, J. K., and
10
Isaksen, I. S. A.: Modeling the radiative impact of mineral dust during the Saharan Dust Experiment (SHADE) campaign, J. Geophys. Res., 108, 8579, doi:10.1029/2002JD002566, 2003. 1602
Nesbitt, S. W. and Zipser, E. J.: The diurnal cycle of rainfall and convective intensity according to three years of TRMM measurements, J. Climate, 16, 1456–1475, 2003. 1614
15
Penner, J. E., Zhang, S. Y., and Chuang, C. C.: Soot and smoke aerosol may not warm climate, J. Geophys. Res., 108, 4657, doi:10.1029/2003JD003409, 2003. 1597
Perlwitz, J. and Miller, R. L.: Cloud cover increase with increasing aerosol absorptivity: A coun-terexample to the conventional semidirect aerosol effect, J. Geophys. Res., 115, D08203, doi:10.1029/2009JD012637, 2010. 1611, 1612
20
Prospero, J. M. and Lamb, P. J.: African Droughts and Dust Transport to the Caribbean: Climate Change Implications, Science, 302, 1024–1027, doi:10.1126/science.1089915, 2003. 1597 Prospero, J. M., Ginoux, P., Torres, O., Nicholson, S. E., and Gill, T. E.: Environmental
char-acterization of global sources of atmospheric soil dust identified with the NIMBUS 7 Total Ozone Mapping Spectrometer (TOMS) absorbing aerosol product, Rev. Geophys., 40, 1002,
25
doi:10.1029/2000RG000095, 2002. 1598, 1601
Qin, Y. and Mitchell, R. M.: Characterisation of episodic aerosol types over the Australian continent, Atmos. Chem. Phys., 9, 1943–1956, doi:10.5194/acp-9-1943-2009, 2009. 1605 Ramanathan, V., Crutzen, P. J., Kiehl, J. T., and Rosenfeld, D.: Aerosols, climate and the
hydrological cycle, Science, 294, 2119–2124, 2001. 1612
30