BAR, Rio de Janeiro, v. 9, n. 2, art. 6, pp. 229-245, Apr./June 2012
Assessment of Market Efficiency in Argentina, Brazil and Chile:
an Event Study of Mergers and Acquisitions
Mario Domingues Simões *
E-mail address: [email protected] Pontifícia Universidade Católica do Rio de Janeiro – IAG/PUC-Rio Rio de Janeiro, RJ, Brazil.
T. Diana L. van Aduard de Macedo-Soares
E-mail address: [email protected] Pontifícia Universidade Católica do Rio de Janeiro – IAG/PUC-Rio Rio de Janeiro, RJ, Brazil.
Marcelo Cabus Klotzle
E-mail address: [email protected] Pontifícia Universidade Católica do Rio de Janeiro – IAG/PUC-Rio Rio de Janeiro, RJ, Brazil.
Antonio Carlos Figueiredo Pinto
E-mail address: [email protected] Pontifícia Universidade Católica do Rio de Janeiro – IAG/PUC-Rio Rio de Janeiro, RJ, Brazil.
* Corresponding author:Mario Domingues Simões
Rua Visconde de Pirajá, 220/701, Rio de Janeiro, RJ, 22410-000, Brazil.
Abstract
This paper presents an investigation into the relationship between the announcement of mergers and acquisitions, the existence of positive abnormal returns for shares of these firms, and market efficiency in Argentina, Brazil and Chile. Statistically significant Standardized Abnormal Returns were present in the event announcement and the following days in Argentina and Chile and on the event day in Brazil, confirming value creation signaling. Furthermore, the significance of abnormal returns in the event window, namely in the 5 days following the event in Argentina and Chile and the absence of such in Brazil suggests a more efficient market exists in Brazil, in keeping with the semi-strong market efficiency hypothesis. The absence of semi-strong efficient market behavior could prove valuable to investors who could use a window of a few days after the event announcement to accumulate abnormal returns, provided the appropriate research into news of possible mergers or acquisitions has been made.
Introduction
As the world becomes increasingly globalized, firms are establishing strategic linkages – alliances and mergers and acquisitions (M&A) – in order to improve their ability to meet the many challenges they are constantly encountering in the course of doing business.
In the literature, many studies have addressed the problem of news about alliances and the creation of value for M&A participants, and adopted abnormal stock returns for the firm over the announcement period window as a proxy (Brito, Batistella, & Fama, 2005; Brooke & Oliver, 2005; Chan, Kensinger, Keown, & Martin, 1997; Rochman & Arbeleche, 2009; Swaminathan & Moorman, 2009). Although the evidence found in many of these studies indicates that value is indeed created, this is not absolutely certain in all cases. In Brazil for example, many studies that focused on specific industrial areas provided evidence that such abnormal returns were not present (Brito et al., 2005; Rochman & Arbeleche, 2009). At the same time, the news conveyed by such M&A activities present a good opportunity for assessing the efficiency of the markets where these take place.
The aim of this article is to share the results of an investigation that addressed the following question on whether the news of M&A undertaken by firms in Latin America generate abnormal returns, as indicated by an increase in the company stock prices. An indication of the efficiency of these markets will be provided from the speed and completeness with which these markets absorb such news.
Different from past research, our investigation did not attempt to segregate the deals into different industries or areas of activity due to the small amount of information available regarding markets in Latin America. In fact, although we used all available data in aggregate form for each country, this study was forced to limit itself to Argentina, Brazil, and Chile in order to obtain statistically acceptable results.
This paper is organized as follows: the first section presents a brief literature review and is followed by a description of the methodology adopted for our investigation. The results obtained are presented in the following section with a discussion of the results and final considerations in the last two sections.
Literature Review
This work presents the result of an event study around M&As. As such, we identify two different theoretical aspects that should be addressed, these being that (a) the fact that the news regarding Mergers and Acquisitions signal value creation to the market, and (b) an observation of the market reaction to such news can be used to measure market efficiency.
In sequence, we present a brief literature review of each of the aspects mentioned above.
Value creation
It is important to emphasize here that, as Nohria and Garcia-Pont (1991) noted, strategic linkages include not just strategic alliances (e.g. joint ventures or equity partnerships), but also M&As. Drawing on Contractor and Lorange (1988) as well as Nohria and Garcia-Pont (1991), Macedo-Soares and Mendonça (2010) adopted a typology of linkages based on the degree of relationship interdependence/intensity of the linkage and where M&A correspond to the highest degree of relationship dependence. This typology was considered relevant for our investigation because increasing interorganizational dependence is generally correlated with strategic impact (Pfeffer & Nowak, 1976); in other words, the higher the degree of interdependence/intensity the greater the impact of the linkage upon the firms´ performance in terms of their competitiveness. Indeed, it is therefore fair to assume that M&A would have the potential for creating more strategic value for the firms involved than linkages with a lesser degree of dependence. Also, one can assume that this value would be reflected in the firms´ respective stock prices (Brito et al., 2005; Brooke & Oliver, 2005; Chan et al., 1997; Rochman & Arbeleche, 2009; Swaminathan & Moorman, 2009). The problem that was addressed in the investigation at issue in this article was to find evidence that stock prices of companies that have been involved in M&A activity do indeed generate positive abnormal returns, over a certain period.
It has been shown that takeover targets are not necessarily underperforming firms (Agrawal & Jaffe, 2003), and the evidence of positive abnormal returns provided by the observation of stock price behavior as related to abnormal returns, or rather the lack of such evidence, could indicate many different possibilities: (a) the merger or acquisition was not successful; (b) the market did not consider it to be a good option; (c) the targeted firm was an underperforming one and therefore no opportunities for improvement were believed to exist; (d) the merger or acquisition itself would probably be unsuccessful; (e) the alternatives for value creation were not perceived or were simply ignored (Bieshaar, Knight, & Wasenaer, 2001; Ederington & Guan, 2005; Lasserre, 2002).
Therefore, the results we are looking for in the present work are those indicating abnormal returns greater than zero at the event date: this indicates that the market considered the M&A news as advertising good value bearing surprises. In general, a positive abnormal return will indicate value increase, having been the result of price increases of the stocks connected to the M&A news; the contrary meaning the news is value destroying.
However, one must bear in mind that the present work concerns itself to the study of short-term abnormal returns. As such, these cannot produce evidence about the long-term results of a M&A, which may not always be good (in the sense of value creation) as discussed above.
Market efficiency
The Efficient Market Hypothesis (EMH) is based on the assumption that, in efficient markets, asset prices fully reflect all available information. Thus, any change in equilibrium prices will be due to the flow of information available to market participants. Therefore, if one accepts that market equilibrium conditions are translated into expected returns and that these are formed on the basis of the available information, no system could be devised to enable abnormal returns (i.e. returns in excess of expected market returns) to be obtained (Malkiel, 2003). Another way of looking at this issue is that if any form of regularity could possibly be detected in the market, it would indicate inefficient information flow and in this case a system could be devised to enable someone to obtain abnormal gains.
Fama (1970) identifies three forms of market efficiency; (a) weak form, when only historical price information is available; (b) semi-strong form, when recent and obvious publicly available information is added to the previous set; (c) strong form, when information held by private groups, and which is not publicly available, is considered. Fama (1970) also identifies sufficient (but not necessary) conditions for capital market efficiency (Montibeller, Belton, Ackermann, & Ensslin, 2007), as follows:
. all information is available at no cost to all market participants;
. all market participants agree on the meaning and implications of the available information.
As regards the gathering of evidence for testing the semi-strong form of market efficiency, the literature is basically concerned with measuring the speed with which market prices adjust to new information (Dimson & Mussavian, 1998).
The most important research tool in this area is the so called event study (Camargos & Barbosa, 2003; MacKinlay, 1997). This kind of methodology tries to gather statistical evidence that market prices do not immediately adjust to new information, and helps to identify clusters of abnormal returns close to the event (M&A, stock splits, change in interest rates, announcement of changes in major macro-economic indicators, etc.) (Gersdorff & Bacon, 2009; Seiler, 2003; Wong, 2002).
Even if the value of the evidence provided by these so-called market models is debatable, it is generally accepted that the market model methodology can improve the available knowledge regarding markets (MacKinlay, 1997).
In general, significant positive TSARs (Total Standardized Abnormal Returns) after the event date indicate that the market was not efficient enough in absorbing the good news that was released. On its part, significant positive CTSARs (Cumulative Total Standardized Abnormal returns) after the event date would mean that value was still being created through price increases, thus pointing towards market inefficiency in terms of complete assimilation of the good news bearing surprises (Fama, 1970).
Additionally, if such positive and significant TSARs results are not connected to the event date, that is, the date when the merger news is supposed to be released, a positive significant TSAR will indicate some kind of information leakage and gains related to market inefficiency in terms of the gains not being the result of the action of the market on public news, since the information about the merger would not yet be public at the time (Fama, 1970).
Methodology
The main two research questions regard (a) whether the announcement of M&A is perceived as unexpected good news by the market, and (b) whether the market reacts in an efficient way to such events.
Since we do not try to establish the size of eventual abnormal returns for any announcement day, but only whether such abnormal returns actually exist, we chose to use the event study method, in order to measure the reaction of stock prices to the announcement of M&A (Chan et al., 1997; Dodd & Warner, 1983). Specifically, the goal of the research is to find if statistically significant evidence of abnormal returns are present close to the dates of M&A news disclosure to the market and whether these abnormal returns accumulate or are readily absorbed by the market.
Following the general practice revealed by the literature review, we conducted event studies for M&A news as described below. We adopted a significance level of 95% for our statistical results, in accordance with usual practice (Almeida, Bueno, & Braga, 1999; Beesley, 1965; Belton & Stewart, 2002; Brito et al., 2005; Carvalho, 2007; Seiler, 2003).
This method requires eight steps (Seiler, 2003):
1. Identification of the event date.
3. Definition of the estimation period.
4. Selection of the sample.
5. Calculation of normal returns.
6. Calculation of abnormal returns (ARs).
7. Calculation of cumulative abnormal returns (CARs)
8. Determination of the statistical significance of the ARs and CARs.
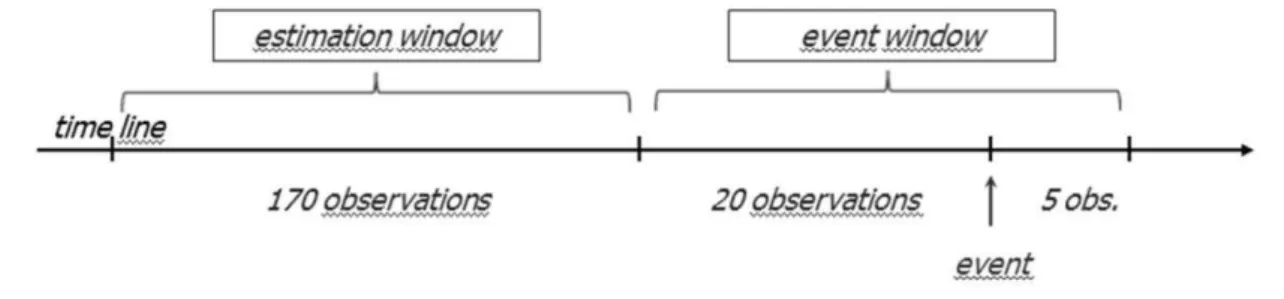
Figure 1. Event Study.
In the case at issue here, the event date is that on which the merger or acquisition is announced, as listed in Standard & Poor´s database Capital-IQ (Standard & Poor [S&P], 2009). An event window and an estimation period window then have to be defined. This was undertaken by following a previously used method, with the event date defined above as day 0, the estimation period starting on day -170 and ending on day -21 and the event window going from day -20 until day + 5 (Chan et al., 1997). The length of the event window is indeed much shorter than that of the estimation one, with some variation as to the chosen intervals, in line with the practice pursued in the literature (Brown & Warner, 1985; Chan et al., 1997; MacKinlay, 1997; Park, 2004). According to the methodology adopted, abnormal returns are calculated by taking the actual returns from the stock sample and subtracting predicted normal returns for each day of the event period (Seiler, 2003).
The challenge was to assemble datasets with stock prices for the relevant dates, for each of the countries to be studied. In our research, we started with the event dates obtained from the CapitalIQ database, as described above, and proceeded to gather the necessary stock price data using the Economatica database (Arrow, 1963), which contains stock price data for Latin American countries. The base data for this research were stock prices obtained as described above for the period starting on October, 1995 through August, 2008.
We decided to avoid extending the data gathering period further, because a very recent study indicates a structural break on the Brazilian stock market on September, 2008 (Faria, Ness, Klotzle, & Pinto, 2011).
Initially, it was our goal to study data from all Latin American countries, except Mexico, but the lack of pertinent information, due to the fact that stock markets in many of these countries are relatively underdeveloped, obliged us to use data solely from Argentina, Brazil and Chile. Even so, the liquidity criterion used, that is, for the trading frequency of each of the stocks, was a minimum of 80% available stock price data on the dates when the respective trading market operated during the relevant period for each stock. Naturally this introduces a limitation to the study in terms of the available sample size.
Having thus fulfilled the four initial steps of the methodology adopted, we started calculating the required returns. The market returns, in this case, were proxied by the MERVAL, IBOVESPA and IPSA stock market indexes, for Argentina, Brazil and Chile, respectively. The returns themselves were calculated according to the usual practice in the literature, that is, log returns were used according to the formula below:
⁄ (1)
where Pt is the observed price; subscript t refers to time t.
Abnormal returns were calculated using the approach known as risk-adjusted return (as opposed to market return), which were defined as the difference between the actual observed return and the expected return, the latter being predicted, in the event window, by using a regression, where the parameters are defined in the estimation window, consistent with the market model procedure (MacKinlay, 1997). Using the sample data gathered as described above, we regressed the observed stock returns against the appropriate market returns for each country, thus obtaining predicted returns for the event window.
Having obtained the predicted stock values for each day in the event window, the subtraction of the predicted value from the actual observed return for each day in the event window should produce the abnormal return (Seiler, 2003). In a nutshell, the whole procedure can be expressed by Formulas (2) and (3).
[ ] (2)
where
. [ ] is the expected return;
. is the market return;
. subscript t refers to time t.
After calculating the ARs (abnormal returns), these were standardized in order to establish a comparison unit. Next, they were summed across each day and for all companies (each country analysis was carried out separately). Finally CTSARs (cumulative total standard abnormal returns) were calculated for each of the days in the event window, starting with the first day.
[ ] (3)
where
. [ ] is the expected return;
. is the return;
. subscript o refers to observed;
. subscript t refers to time t.
The procedure that we followed is described in greater detail in Seiler (2003).
Results and Discussion
Argentina
The results obtained for the sample of firms in Argentina are summarized in Table 1. The table presents data as captioned in the column headings and each row represents a day in the event window, from the first day (event date – 20) to the last one (event date + 5) with the event date (day 0) shown in darker grey. Statistically significant data within 5% are shown in bold italics and the variables considered are:
. TSAR – total standard abnormal returns
. CTSAR – cumulative total standard abnormal returns
When one observes the calculations for TSARs and CTSARs for the duration of the observed event window, one can find significance in the value of the TSAR on days -15, -11, -6, -2 and 1 with significant positive figures for all days except day -6, as well as for the event day itself. There is thus evidence that a belief about value creation occurred on these days. When considered together with the event day, that shows the largest TSAR, the data strongly suggests that the M&A news indeed signaled value creation for these stocks, in the Argentinean market.
Table 1
Results for Argentina1
day Total SAR Total SAR z-statistic
Total SAR p-value
Cumulative TSAR
CTSAR z-statistic
CTSAR p-value
-20 -2,943 -0,781 43% -2,943 -0,191 85%
-19 3,905 1,293 20% 0,963 0,062 95%
-18 5,224 1,730 8% 6,187 0,401 69%
-17 1,626 0,538 59% 7,812 0,506 61%
-16 0,302 0,100 92% 8,114 0,526 60%
-15 8,172 2,706 1% 16,286 1,056 29%
-14 3,169 1,049 29% 19,456 1,261 21%
-13 -2,868 -0,949 34% 16,588 1,075 28%
-12 2,798 0,926 35% 19,386 1,257 21%
-11 5,849 1,936 5% 25,236 1,636 10%
-10 3,767 1,247 21% 29,003 1,880 6%
-9 1,469 0,486 63% 30,472 1,975 5%
-8 -0,367 -0,121 90% 30,105 1,951 5%
-7 -2,028 -0,671 50% 28,077 1,820 7%
-6 -11,003 -3,643 0% 17,074 1,107 27%
-5 0,726 0,240 81% 17,800 1,154 25%
-4 2,591 0,858 39% 20,391 1,322 19%
-3 1,990 0,659 51% 22,381 1,451 15%
-2 8,012 2,652 1% 30,392 1,970 5%
-1 -3,681 -1,219 22% 26,712 1,731 8%
0 13,355 4,421 0% 40,067 2,597 1%
Table 1 (continued)
day Total SAR Total SAR z-statistic
Total SAR p-value
Cumulative TSAR
CTSAR z-statistic
CTSAR p-value
1 8,938 2,959 0% 49,005 3,176 0%
2 -5,454 -1,806 7% 43,550 2,823 0%
3 1,342 0,444 66% 44,893 2,910 0%
4 -4,604 -1,524 13% 40,289 2,612 1%
5 -0,469 -0,155 88% 39,820 2,581 1%
Note.1 total data for 14 companies.
On the other hand, the significance of the values scattered about the event window days before the event date seems to indicate that the market was prone to leakage of information or use of the latter by groups that attempted to extract returns from the market for no apparent reason.
A verification of the situation for the CTSARs showed significant positive levels of abnormal returns accumulation for days -9, -8, -2 and -1, as well as from day 0 to +5, in the observed event window. All these values were positive, though not monotonous in size, leading us to believe that this market was indeed not efficient as per the Efficient Market (semi-strong) Hypothesis, rather it was trying to adjust itself to a proper price level. The figures indicate an accumulation of gains during a short time frame after the announcement date. However, rather than efficiently reaching a stable price level, there appears to have been some oscillation around a certain point, indicating the possibility of the market having overshot the proper price level but then striving to achieve stability.
Though such a behavior is not unexpected, it does indicate the failure of the market functioning in an entirely efficient way, as per the semi-strong form Efficient Market Hypothesis (Fama, 1970).
Brazil
The results obtained for the sample of firms in Brazil are presented in Table 2. Data is presented in a similar fashion to Argentina’s, with the exception of the sample size, as we noted above.
Different from the previous case, the event window for the Brazilian stock market only indicated significance for the positive TSARs on the event day. This leads us to believe that M&A news indeed pointed to the possibility of value creation for the stocks observed, and that the market’s behavior was consistent with the semi-strong Efficient Market Hypothesis, as expected.
Table 2
Results for Brazil1
day Total SAR Total SAR z-statistic
Total SAR p-value
Cumulative TSAR
CTSAR z-statistic
CTSAR p-value
-20 -2,837 -0,533 59% -2,837 -0,087 93%
-19 -8,998 -1,689 9% -11,835 -0,363 72%
-18 -6,099 -1,145 25% -17,934 -0,550 58%
-17 5,820 1,092 27% -12,114 -0,371 71%
-16 -9,910 -1,860 6% -22,024 -0,675 50%
-15 -3,947 -0,741 46% -25,971 -0,796 43%
-14 0,051 0,010 99% -25,920 -0,795 43%
-13 -1,719 -0,323 75% -27,640 -0,847 40%
-12 -4,898 -0,919 36% -32,538 -0,998 32%
-11 -0,066 -0,012 99% -32,604 -1,000 32%
-10 -3,492 -0,655 51% -36,096 -1,107 27%
-9 6,614 1,241 21% -29,482 -0,904 37%
-8 3,031 0,569 57% -26,451 -0,811 42%
-7 0,759 0,143 89% -25,692 -0,788 43%
-6 -0,342 -0,064 95% -26,035 -0,798 42%
-5 -6,680 -1,254 21% -32,714 -1,003 32%
-4 5,525 1,037 30% -27,189 -0,834 40%
-3 -3,497 -0,656 51% -30,685 -0,941 35%
-2 4,037 0,758 45% -26,648 -0,817 41%
-1 1,150 0,216 83% -25,498 -0,782 43%
0 16,740 3,142 0% -8,758 -0,269 79%
1 -5,527 -1,037 30% -14,285 -0,438 66%
2 -4,503 -0,845 40% -18,788 -0,576 56%
3 -1,779 -0,334 74% -20,567 -0,631 53%
4 -6,036 -1,133 26% -26,603 -0,816 41%
5 -1,577 -0,296 77% -28,180 -0,864 39%
Note. 1 total data for 28 companies.
These results corroborate the findings of a study recently conducted in Brazil (Camargos & Barbosa, 2007), which concluded that “the market, in terms of information availability, behaved in a semi-strong efficient manner”.
Chile
Table 3
Results for Chile1
day Total SAR Total SAR z-statistic
Total SAR p-value
Cumulative TSAR
CTSAR z-statistic
CTSAR p-value
-20 1,305 0,391 70% 1,305 0,114 91%
-19 2,710 0,812 42% 4,015 0,349 73%
-18 6,467 1,937 5% 10,482 0,912 36%
-17 0,319 0,095 92% 10,800 0,940 35%
-16 -1,850 -0,554 58% 8,951 0,779 44%
-15 1,387 0,415 68% 10,338 0,900 37%
-14 -3,253 -0,974 33% 7,085 0,617 54%
-13 0,229 0,069 95% 7,315 0,637 52%
-12 1,927 0,577 56% 9,242 0,804 42%
-11 -0,870 -0,260 79% 8,372 0,729 47%
-10 -1,621 -0,485 63% 6,751 0,588 56%
-9 -1,262 -0,378 71% 5,489 0,478 63%
-8 7,524 2,253 2% 13,013 1,133 26%
-7 2,263 0,678 50% 15,276 1,330 18%
-6 3,682 1,103 27% 18,958 1,650 10%
-5 0,609 0,182 86% 19,567 1,703 9%
-4 -0,534 -0,160 87% 19,033 1,657 10%
-3 9,246 2,769 1% 28,279 2,461 1%
-2 -4,724 -1,414 16% 23,555 2,050 4%
-1 -1,847 -0,553 58% 21,708 1,889 6%
0 10,239 3,066 0% 31,947 2,781 1%
1 3,244 0,971 33% 35,190 3,063 0%
2 3,046 0,912 36% 38,236 3,328 0%
3 -2,429 -0,727 47% 35,807 3,117 0%
4 -1,837 -0,550 58% 33,970 2,957 0%
5 -1,542 -0,462 64% 32,428 2,823 0%
Note.1 total data for 11 companies.
In the case of the Chilean stock market it was possible to observe significant positive TSARs figures on days -8, -3 and the event date itself. This observation is in agreement with the possibility of some kind of news leakage being used by individuals to obtain abnormal gains.
CTSARs, on the other hand, were significant on days -3 and -2, and from day 0 through day +5. However, different from the Argentinean case, the TSAR values were positive for days 0, 1 and 2 and negative for days 3, 4 and 5.
further suggesting that an equilibrium price point was surpassed and a reversal of the process was at work; that is, the market was striving to adjust itself to a proper level, having overshot the appropriate stability point as the news was released.
It is true that the accumulation of abnormal returns observed does indicate the existence of an inefficient market according to the semi-strong EMH. However, the CTSAR pattern suggests that the market was behaving as expected, albeit more slowly – at least in comparison to the Brazilian one.
Final Considerations
In this article we attempted to provide evidence that M&A in the three Latin American countries Argentina, Brazil and Chile indicate the possibility of value creation, by conveying new information to the market in the form of the announcement of the merger or acquisition.
On the basis of the data collected in our research, we achieved this objective in that it provided evidence that M&A news does signal value in the case of all three countries at issue, with statistically significant results at a 95% level.
Indeed, we further found evidence that the market appeared to behave in an efficient way, according to the semi-strong Efficient Market Hypothesis in the case of Brazil, but not in the case of Argentina or Chile. Our results confirmed the findings of recent studies (Camargos & Barbosa, 2006, 2007; Camargos & Romero, 2006) and are consistent with the expected behavior of the stock market in an increasingly regulated environment.
Moreover, the Chilean market appeared to behave more efficiently than the Argentinean one, in keeping with the semi-strong Efficient Market Hypothesis, even though it appeared to be rather slow where the absorption of news regarding the event was concerned.
As to the limitations of our research, the choice of the observation and event windows may have hampered the ability to further observe market behavior in the case of Chile and Argentina. We indeed believe that an expanded event window including a few more days might have provided insights into the direction of the market, especially in the case of Chile.
Thus, we suggest that future research be carried out with the purpose of determining the timing involved in semi-strong market behavior in both Argentina and Chile. Although our study was unable to conclude that these countries have semi-strong efficient markets there is evidence pointing in that direction, although the time factor at issue needs to be better understood.
There is also an important limitation on the part of market representativeness, both in terms of firm activity (industrial or services) and market segment. This is a definite limitation, mainly in countries where markets are extremely dependent on a few companies; however, the largest problem by far in dealing with such limitations is related to the available sample size.
However, in spite of the above mentioned limitations, we believe that our study provided valuable evidence of possible earnings by stock market investors who could bet on the apparent inefficiency of the Argentinean and the Chilean stock markets, regarding the absorption of merger or acquisition announcements.
This could prove valuable to investors who could use a window of a few days after the event announcement to accumulate abnormal returns, provided the appropriate research into news of possible mergers or acquisitions has been made.
above points to the fact that news is not promptly absorbed in some of the markets studied, some effort should be made so as to try and correct those shortcomings where they still exist.
By the same token, care should be taken by the managers involved in any M&A efforts that no leaks of this news happen prior to the determined date of the announcement, so that the market is allowed to behave in an efficient way.
Received 27 November 2010; received in revised form 24 October 2011.
References
Agrawal, A., & Jaffe, J. F. (2003). Do takeover targets underperform? Evidence from operating and stock returns. Journal of Financial & Quantitative Analysis, 38(4), 721-746. doi: 10.2307/4126741
Almeida, R. J. de, Bueno, A. F., & Braga, R. F. R. de (1999, October). Teste sobre a eficiência informacional do mercado brasileiro em relação ao anúncio ou divulgação de fusões/aquisições no período entre maio/1995 e janeiro/1998. Proceedings of the Seminário em Administração, São Paulo, Brazil, 4.
Arrow, K. J. (1963). Uncertainty and the welfare economics of medical care. The American Economic Review, 53(5), 941-973. doi: 10.1126/science.151.3712.867-a
Beesley, M. E. (1965). The value of time spent in travelling: some new evidence. Economica, 32(126), 174-185.
Belton, V., & Stewart, T. J. (2002). Multiple criteria decision analysis: an integrated approach. Amsterdam: Kluwer Academic Publishers.
Bieshaar, H., Knight, J., & Wasenaer, A. van (2001). Fusões e aquisições que geram valor [review]. HSM Management, Edition 27.
Brito, G. A. S., Batistella, F. D., & Fama, R. (2005). Fusões e aquisições no setor bancário: avaliação empírica do efeito sobre o valor das ações. Revista de Administração da Universidade de São Paulo, 40(4), 353-360.
Brooke, J., & Oliver, B. (2005). The source of abnormal returns from strategic alliance announcements. Pacific-basin Finance Journal, 13(2), 145-161. doi: 10.1016/j.pacfin.2004.07.003
Brown, S. J., & Warner, J. B. (1985). Using daily stock returns: the case of event studies. Journal of Financial Economics, 14(1), 3-31. doi: 10.1016/0304-405X(85)90042-X
Camargos, M. A. de, & Barbosa, F. V. (2003). Estudos de evento: teoria e operacionalização. Caderno de Pesquisas em Administração, 10(3), 1-20.
Camargos, M. A. de, & Barbosa, F. V. (2006). Eficiência informacional do mercado de capitais brasileiro pós-Plano Real: um estudo de eventos dos anúncios de fusões e aquisições. Revista de Administração da Universidade de São Paulo, 41(1), 43-58.
Camargos, M. A. de, & Romero, J. A. R. (2006). Análise empírica da reação do mercado de capitais brasileiro a eventos corporativos: teste conjunto da hipótese de eficiência do mercado. Revista de Gestão USP, 13(3), 57-74.
Carvalho, M. A. S. de (2007). Fusões e aquisições no sector bancário: homogeneização ou diferenciação dos produtos bancários? (Unpublished master’s dissertation). Universidade do Minho, Lisboa, Portugal.
Chan, S. H., Kensinger, J. W., Keown, A. J., & Martin, J. D. (1997). Do strategic alliances create value? Journal of Financial Economics, 46(2), 199-221. doi: 10.1016/S0304-405X(97)00029-9
Contractor, F. J., & Lorange, P. (1988). Cooperative strategies in international business. Lexington, Mass: Lexington Books.
Dimson, E., & Mussavian, M. (1998). A brief history of market efficiency. European Financial Management, 4(1), 91-103. doi: 10.1111/1468-036X.00056
Dodd, P., & Warner, J. B. (1983). On corporate governance: a study of proxy contests. Journal of Financial Economics, 11(1-4), 401-438. doi: 10.1016/0304-405X(83)90018-1
Ederington, L. H., & Guan, W. (2005). Forecasting volatility. Journal of Futures Markets, 25(5), 465-490. doi: 10.1002/fut.20146
Fama, E. F. (1970). Efficient capital markets: a review of theory and empirical work. The Journal of Finance, 25(2), 383-417.
Faria, L. E. C. T. de, Ness, W. L., Jr., Klotzle, M. C., & Pinto, A. C. F. (2011). Análise da utilização de um modelo de quatro fatores como ferramenta auxiliar para gestão de carteiras baseadas no IBrX. BBR-Brazilian Business Review, 8(4), 70-93.
Gersdorff, N. von, & Bacon, F. (2009). U.S. Mergers and acquisitions: a test of market efficiency. Journal of Finance and Accountancy, 1(8), 1-8. Retrieved from http://www.aabri.com/manuscripts/09142.pdf
Lasserre, P. (2002). Global strategic management. New York: Pallgrave Macmillan.
Macedo-Soares, T. D. L. v. A. de, & Mendonça, A. P. G. de (2010). Strategic implications of alliances and other linkages of leading telecom operators in Brazil: network and international perspectives. Latin American Business Review, 11(1), 45-73. doi: 10.1080/10978521003769686
MacKinlay, A. C. (1997). Event studies in economics and finance. Journal of Economic Literature, 35(1), 13-39. doi: 10.2307/2729691
Malkiel, B. G. (2003). The efficient market hypothesis and its critics. The Journal of Economic Perspectives, 17(1), 59-82. doi: 10.1257/089533003321164958
Montibeller, G., Belton, V., Ackermann, F., & Ensslin, L. (2007). Reasoning maps for decision aid: an integrated approach for problem-structuring and multi-criteria evaluation. Journal of the Operational Research Society, 59(5), 575-589. doi: 10.1057/palgrave.jors.2602347
Nohria, N., & Garcia-Pont, C. (1991). Global strategic linkages and industry structure [Special Issue]. Strategic Management Journal, 12, 105-124. doi: 10.1002/smj.4250120909
Park, N. K. (2004). A guide to using event study methods in multi-country settings. Strategic Management Journal, 25(7), 655-668. doi: 10.1002/smj.399
Richardson, G. B. (1972). The organisation of industry. Economic Journal, 82(327), 883-896.
Rochman, R. R., & Arbeleche, S. (2009, September). Desempenho de longo prazo de fusões e aquisições: evidência de mercados de capitais Latino-Americanos. Proceedings of the Encontro Nacional da Associação Nacional de Pós-Graduação e Pesquisa em Administração, São Paulo, SP, Brazil, 33.
Seiler, M. J. (Ed.). (2003). Performing financial studies: a methodological cookbook. New Jersey: Pearson Prentice Hall.
Standard&Poor. (2009). Capital-IQ. Retrieved October 4, 2009,from http://www.capitaliq.com
Swaminathan, V., & Moorman, C. (2009). Marketing alliances, firm networks and firm value creation. Journal of Marketing, 73(5), 52-69. doi: 10.1509/jmkg.73.5.52
APPENDIX
Table A1
Sample in Argentina (14 Companies)
Geographical Locations
[Target/Issuer] Target/Issuer
Announced/Initial Filing Date (Including Bids and Letters of Intent) Argentina; South America Alpargatas S.A.I.C. (BASE:ALPA) 17-abr-07 Argentina; South America Alpargatas S.A.I.C. (BASE:ALPA) 10-out-07 Argentina; South America Banco de Galicia & Buenos Aires S.A. (BASE:GALI) 17-mai-00 Argentina; South America Banco Santander Rio S.A. (BASE:BRIO) 10-fev-00 Argentina; South America Central Puerto S.A. (BASE:CEPU2) 12-nov-06 Argentina; South America Central Puerto S.A. (BASE:CEPU2) 20-nov-07 Argentina; South America Endesa Costanera SA (BASE:CECO2) 24-mar-04 Argentina; South America Petrobras Energía Participaciones S.A. (BASE:PBE) 22-jul-02 Argentina; South America Quickfood S.A. (BASE:PATY) 14-set-07 Argentina; South America Telefonica of Argentina, Inc. (BASE:TEAR2) 12-jan-00 Argentina; South America Ternium Siderar (BASE:ERAR) 28-dez-06 Argentina; South America Transportadora de Gas Del Sur S.A. (BASE:TGSU2) 18-jan-06 Argentina; South America Transportadora de Gas Del Sur S.A. (BASE:TGSU2) 27-fev-07
Argentina; South America YPF S.A. (BASE:YPFD) 7-jun-00
Table A2
Sample in Chile (11 Companies)
Geographical Locations
[Target/Issuer] Target/Issuer
Announced/Initial Filing Date (Including Bids and Letters of Intent)
Chile; South America AES Gener S.A. (SNSE:GENER) 3-nov-00
Chile; South America Aguas Andinas S.A. (SNSE:AGUAS-A) 16-jul-04
Chile; South America Banco de A. Edwards, S.A. 30-jul-01
Chile; South America Banco Santander Chile prior to merger with Banco Santiago
18-jul-02 Chile; South America Banco Santander-Chile (SNSE:BSANTANDER) 18-mai-99 Chile; South America Cementos Bio-Bio S.A. (SNSE:CEMENTOS) 26-abr-05 Chile; South America Cementos Bio-Bio S.A. (SNSE:CEMENTOS) 18-abr-08 Chile; South America Compañía General de Electricidad S.A. (SNSE:CGE) 13-out-05 Chile; South America Empresa Nacional de Telecomunicaciones S.A.
(SNSE:ENTEL)
19-dez-00
Chile; South America Enersis S.A. (SNSE:ENERSIS) 28-jan-99
Table A3
Sample in Brazil (28 Companies)
Geographical Locations [Target/Issuer]
Target/Issuer
Announced/Initial Filing Date (Including Bids and
Letters of Intent) Brazil; South America Abyara Planejamento Imobiliario SA (BOVESPA:ABYA3) 17-ago-07 Brazil; South America Banco Bradesco S.A. (BOVESPA:BBDC4) 11-abr-08
Brazil; South America Brasmotor S.A. (BOVESPA:BMTO4) 4-nov-99
Brazil; South America Companhia Brasileira de Distribuicao (BOVESPA:PCAR5) 4-mai-05 Brazil; South America Companhia Brasileira de Distribuicao (BOVESPA:PCAR5) 24-jul-08 Brazil; South America Companhia de Gas de Sao Paulo (BOVESPA:CGAS5) 14-abr-99 Brazil; South America Companhia De Transmissao De Energia Eletrica Paulista
(BOVESPA:TRPL4)
4-dez-06
Brazil; South America Datasul S/A 22-jul-08
Brazil; South America ELETROPAULO-Metropolitana Eletricidade de Sao Paulo SA (BOVESPA:ELPL5)
9-set-03 Brazil; South America Embratel Participacoes S.A. (BOVESPA:EBTP4) 15-mar-04 Brazil; South America Embratel Participacoes S.A. (BOVESPA:EBTP4) 8-mai-06
Brazil; South America Gafisa S.A. (BOVESPA:GFSA3) 22-fev-07
Brazil; South America Industrias Romi SA (BOVESPA:ROMI3) 18-ago-08
Brazil; South America Light SA (BOVESPA:LIGT3) 2-out-00
Brazil; South America Light SA (BOVESPA:LIGT3) 11-dez-00
Brazil; South America M&G Poliester S.A. (BOVESPA:RHDS3) 22-jul-02 Brazil; South America Net Serviços de Comunicação (BOVESPA:NETC4) 28-jun-04 Brazil; South America Petroleo Brasileiro (BOVESPA:PETR4) 30-jun-08 Brazil; South America Quattor Petroquimica SA (BOVESPA:SZPQ4) 3-ago-07 Brazil; South America Telecomunicacoes de Sao Paulo S.A. - TELESP
(BOVESPA:TLPP4)
11-jan-00 Brazil; South America Telecomunicacoes de Sao Paulo S.A. - TELESP
(BOVESPA:TLPP4)
12-abr-01 Brazil; South America Usinas Siderúrgicas de Minas Gerais S.A.
(BOVESPA:USIM5)
6-nov-06 Brazil; South America Usinas Siderúrgicas de Minas Gerais S.A.
(BOVESPA:USIM5)
22-dez-06 Brazil; South America Vivo Participacoes S.A. (BOVESPA:VIVO4) 14-mar-00 Brazil; South America Vivo Participacoes S.A. (BOVESPA:VIVO4) 21-mai-01 Brazil; South America Vivo Participacoes S.A. (BOVESPA:VIVO4) 18-out-02 Brazil; South America Vivo Participacoes S.A. (BOVESPA:VIVO4) 9-out-03