DOI: 10.1590/0004-282X20150212
ARTICLE
The prevalence of developmental dyscalculia
in Brazilian public school system
A prevalência da discalculia do desenvolvimento no sistema publico de educação brasileiro
José Alexandre Bastos, Angela Maria Traldi Cecato, Marielza Regina Ismael Martins, Kelly Regina Risso Grecca, Rafael Pierini
Developmental dyscalculia (DD) is deined as a speciic
disability in learning arithmetic occurring in individuals with normal intellectual level, without neurological, psychiatric, sensory, and emotional disorders1. Its prevalence is
contro-versial, since some studies claim that DD is a rare disorder with an occurrence of 1%2;whereas other studies regard it as
being frequent, ranging from 3 to 6%3.
“he role of the physician in the management of dyscal -culia begins in the diagnostic phase by establishing wheth-er the learning disability is a primary, symptomatic, or co-morbid entity. Physicians, with their inherent authority, are often the appropriate member within the multidisciplinary
team to discuss with parents the nature and ramiications of the cognitive disability afecting their child. hey can guide
both child and parents through the maze of expert assess-ments and multitude of therapeutic options while providing
explanations regarding the neurologic underpinnings of the disorder and its familial-genetic implications”4.
In Brazil, quantitative assessments School performance assessment system of theState of São Paulo (SARESP) and (Elementary Education Assessment System). Brazilian Ministry of Education (SAEB) have been conducted on arithmetic skills corresponding to the curriculum, without considering the various causes that have led to the bad re-sults found. International studies, such as the Program for International Student Assessment (PISA) carried out peri-odically by the Organization for Economic Co-operation and
Development (OECD), conirm the low outcome accom -plished by Brazilian children in arithmetic. In addition, there are no studies on the prevalence of DD. Research should be conducted in order to standardize the diagnosis and develop appropriate intervention strategies.
Projeto Gato de Botas, São José do Rio Preto SP, Brazil.
Correspondence: José Alexandre Bastos; Avenida Brigadeiro Faria Lima, 5622; 15090-000 São José do Rio Preto SP, Brasil; E-mail: [email protected] Conflict of interest: There is no conlict of interest to declare.
Received 30 July 2015; Received in inal form 27 October 2015; Accepted 17 November 2015.
ABSTRACT
The goal of the study was to assess public school children at the end of the irst stage of elementary school. We used a protocol applied concurrently with a writing test in the form of an unexpected activity in 28 public schools; 2,893 children assessed, 687 exhibited performance below 58 points, 184 were excluded due to change of address or lack of consent; 503 children subjected to a test of intellectual capacity and reading assessment and 71 considered intellectually disabled were excluded. 226 (7.8%) children, who could read, write, and had normal intellectual level, met the criteria of developmental dyscalculia (DD), 98 female and 128 male. The most inluential factors in the prevalence were socioeconomic levels of the schools neighborhood, education level of parents, and being male, as demonstrated by the odds ratio and multiple logistic regression analysis. Further studies should be done so that educational policies are taken.
Keywords: dyscalculia, epidemiology, prevalence, children, socioeconomic status, multivariate analysis.
RESUMO
Este estudo teve como objetivo avaliar crianças da rede pública no inal da 1a etapa do ciclo fundamental; com um protocolo aplicado em forma de atividade surpresa em 28 escolas públicas, concomitantemente a uma prova de escrita: Das 2893 crianças avaliadas, 687 tiveram rendimento abaixo de 58 pontos, 184 foram excluídas por mudança de domicilio ou por falta de consentimento; 503 submetidas a um teste de avaliação intelectual e de leitura, 71 consideradas intelectualmente deicientes foram excluídas do estudo. 226 (7,8%) sabiam ler e escrever e intelectualmente normais, preenchendo os critérios para o diagnóstico de discalculia do desenvolvimento (DD), 98 do sexo feminino e 128 masculinos. Fatores que mais inluenciaram na prevalência da DD foram os níveis socioeconômicos do bairro da escola, nível de escolaridade dos pais e sexo masculino, demonstrados pela Odds Ratio e Analise de regressão logística múltipla. Mais estudos devem ser realizados para que políticas educacionais sejam tomadas.
In recent years, neuroscience in education has been assuming an increasingly important role. It involves
professionals from various ields such as neurologists, psy -chiatrists, psychologists, speech pathologists, neuropsychol-ogists, occupational therapists, educational psycholneuropsychol-ogists, and teachers, whose goal is to understand how the brain
learns in order to provide better teaching. he advancement
of neuroscience with genetic and neuroimaging studies show that the DD is a genetic disorder with neurobiological
bas-es and strong environmental inluence. he great challenge
is exactly how to proceed with this new knowledge of func-tional neuroimaging, electromagnetography, and computer sciences, so that teaching methodologies can be developed.
he DD has the same prevalence of the disorder attention deicit and dyslexia5, though it causes major impediment in
professional and socioeconomic development of the indi-vidual, the number of studies about them is lower, making their diagnosis is underestimated with consequent fewer of
people treated. he present study correlates DD with social
conditions of the neighborhood in which the schools were located, sex, education level of the parents, and coexistence with reading and writing disabilities.
METHOD
São José do Rio Preto is a city located in the northwest of the State of São Paulo, Brazil. It has about 480,000 inhabit-ants with human development index considered above the
Brazilian average. he present study assessed 2,893 children of a total of 3,093 who had completed the irst stage of el -ementary education (5th grade) in the public school network.
he schools were divided into group A, B, C, D and E following
the criteria of family vulnerability indicator system (SIFV)6.
The study was approved by the Ethics Committee of São José do Rio Preto Medical School (FAMERP)
un-der no. 5685/2009, Opinion no. 396/2009. It is a de -scriptive, exploratory and cross-sectional study using a convenience sample.
A mathematics protocol was used (Bastos, 2003; adapted
from Grafman and Boller’s modiied protocol)5, since it allows
simultaneous assessment of a large population. he skills as -sessed were: lexical skill in symbolic and writing form; syn-tax skill in the production of dozens, hundreds, thousands, and ten thousands in symbolic and writing form; quantifying high and low numbers; performing the four fundamental op-erations with simple and complex calculations; and resolu-tion of concrete, semi-concrete, and abstract problems.
his protocol was composed of 50 questions allowing the
maximum score of 100 points.
Procedure of the first step
In the irst step of the study, the protocol was applied in
the form of an unexpected activity, on the same day, at the
beginning of the 2012 school year, in children who had
com-pleted the irst stage of elementary education (5th grade) in
the 2011 school year. he students were asked to produce a text from three words. hey were given 60 minutes for com -pleting the activity and the only exclusion criterion was the absence of the children.
he activity was corrected by the team of the Puss in Boots
Project which is a partnership between Medical School of S.J. of Rio Preto SP. and the Municipal Secretary of Education
for diagnosis and intervention in children with speciic learn
-ing disorder. he cut-of score to consider children’s perfor
-mance below expected was 58 points out of 100 possible. he
outcome was considered two levels below the expected for this school level. At this time, writing skills were also corrected.
Procedure of the second step
At the beginning of the 2012 school year and after the parents had signed an informed consent from, Wechsler Intelligence Scale for Children-Revised (WISC-R)7 (cubes and
vocabulary) was used to assess the presumed intellectual lev-el. At this time, reading skills were assessed by means of a text compatible with the educational level and 184 children were not assessed due to change of address, or because the parents had not signed the informed consent form.
he data obtained include: (a) identiication of children and
school; (b) ages (c) sex; (d) fathers’ education; (e) mothers’ educa-tion; ( f) social level of the neighborhoods in which the schools were located; (g) quantitative outcome; (h) qualitative outcome; (i) whether the children could write; (j) whether the children could read; (k) intellectual level (Tables 1 and 2).
Statistical analysis
he descriptive statistical analysis of the variables under
study was initially performed and the chi-square test was subsequently used for comparing the categorical variables. Fisher’s exact test with Yates’ correction and the calculation of the odds ratio (OR) were used for two-by-two comparisons.
he multiple logistic regression (LR) model was used to conirm the inluence of sex, social level of the schools,
and parents’ education level on dyscalculia, considering as outcome individuals with dyscalculia that scored below 58 points, could read and write, and had normal intellectual
level. he backward LR method was used for the selection, and 5% signiicance level (p-value ≤ 0.05) and the Statistical
Package for the Social Sciences software (SPSS version 22.0) were used in all comparisons.
RESULTS
Multiple logistic regressions were used considering as an outcome children exhibiting dyscalculia or not, who scored
showed an R2 value of 45.6% and general hit power of 97%.
All variables assessed as predictors or explanatory variables
inluenced the occurrence of dyscalculia. he mothers’ edu -cation level was the variable that best explains dyscalculia
(OR = 8.764), followed by sex (OR = 7.213), and social lev -el of the neighborhood in which the schools were located
(OR = 6.871). he fathers’ education level was the one that least inluenced the proposed model (OR = 0.661) - Figure 1,
Figure 2, Figure 3, Figure 4, Table 3, Figure 5, Figure 6, Table 4.
DISCUSSION
In 1957, Russia celebrated the success of the launch of the
Sputnik satellite into space8, while the United States sufered
a series of failures, which lead President Eisenhower to
sum-mon his advisors for explanations. he conclusion is that, at
the time, the American education was geared toward profes-sionalization and training of technicians, lacking highly
qual-iied teachers in mathematics to teach a number of high-level students needed to meet the demand. his fact changed the
direction of mathematics teaching in the United States and
serves as a present-day relection on the need for changes in
our teaching.
he present study shows that the prevalence of DD in São José do Rio Preto was 7.8%. herefore, it is necessary to
warn that this number–slightly above the world average–
represents important social problems. he analysis of the
results showed greater prevalence among children studying in schools located in neighborhoods of greater vulnerability, with parents of low education level, and predominance of oc-currence in male individuals.
he comparison between the results of the present
study with those found by other researchers reveals that the
numbers are not so diferent. Shalev4 showed a prevalence
of 6.5%, which is similar to dyslexia and attention deicit
Below 58 Over 58 2000
2500
500 1000 1500
0
Figure 1. Results of the Mathematics Protocol (Bastos, 2003; adapted from Grafman and Boller’s modiied protocol) 5
(n = 2,893), shows that the outcome of 687 children was below 58 points.
71
432
Intellectually disabled Intellectually normal 500
350
200 250
50 400 450
300
100 150
0
Figure 2. Results of the WISC-R for the sample of students below 60 (n = 503), shows that 184 students were excluded due to change of address, or because their parents had not signed the informed consent form. The WISC-R showed that 71 children were considered intellectually disabled.
Table 1. Demographic characteristics of the sample (n = 2,893). Shows the frequency of children assessed in the present study with respect to sex and level of social vulnerability in the neighborhood in which the schools were located. Age: average in years ± SD = 10.8 ± 0.72
VARIABLES %
Sex
Female 49.3 (n = 1,428)
Male 50.7 (n = 1,465)
Social level of the Schools (n = 29)
A 0
B 10.5
C 31.5
D 58
E 0
SD: standard deviation; A: safety situation; B: very low vulnerability; C: low vulnerability; D: medium vulnerability; E: high vulnerability.
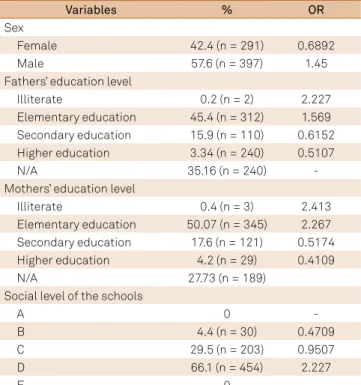
Table 2. Characterization of the sample of students with outcome below 58 points and odds ratio values (n = 687). Show children`s outcomes. Age: average in years ± SD = 10.99 ± 0.91
Variables % OR
Sex
Female 42.4 (n = 291) 0.6892
Male 57.6 (n = 397) 1.45
Fathers’ education level
Illiterate 0.2 (n = 2) 2.227
Elementary education 45.4 (n = 312) 1.569 Secondary education 15.9 (n = 110) 0.6152 Higher education 3.34 (n = 240) 0.5107
N/A 35.16 (n = 240)
-Mothers’ education level
Illiterate 0.4 (n = 3) 2.413
Elementary education 50.07 (n = 345) 2.267 Secondary education 17.6 (n = 121) 0.5174
Higher education 4.2 (n = 29) 0.4109
N/A 27.73 (n = 189)
Social level of the schools
A 0
-B 4.4 (n = 30) 0.4709
C 29.5 (n = 203) 0.9507
D 66.1 (n = 454) 2.227
E 0
hyperactivity disorder (ADHD). However, the author points out the fact that the study had been conducted with children who attended the public educational system. Another factor is related to diagnostic criteria for DD, which should be
bet-ter deined, distinguishing children who have mathematics diiculty by means of other factors.
O’Hare et al.2 concluded that the DD was
infre-quent. However, Kosc9 estimated 6.4% in Slovakia, Von
Aster10 found 4.4% in Germany, Lewis et al.11 found 3.6% in
England, Badian et al.12 found 6.4% in the United States, and
Reigosa-Crespo et al.13 found 3.4% in Cuba. hese studies
draw attention to the fact that mathematics diiculty and
the DD should be distinguished.
Hein, Bzufka, and Neumärker14 assessed children of urban
and rural areas in Germany and found a prevalence of 6.6 and
6.59%, respectively. Koumoula et al.15 assessed the urban and
ru-ral population in Greece and found a much greater prevalence
in rural areas. his inding is compatible with the sample of the
present study. Even though the rural area has not been assessed, it was demonstrated that the social level of the neighborhood in which a school is located is relevant for the prevalence of DD.
he present study also showed that there was greater
prevalence of DD in male individuals. Studies conducted by Benbow and Stanley16,17 showed a better performance in male
Reading 215
288
Cannot read Can read 350
150 200
50 300 250
100
0
Figure 3. Outcomes of reading skill assessed concurrently with the application of the WISC-R (n = 503), shows that, of 503 children, 215 had reading dificulty considered serious.
Writing 111
392
Cannot write Can write 450
350
200 250
50 400 300
100 150
0
Figure 4. Outcomes of writing skill assessed concurrently with the application of the mathematics protocol (Bastos, 2003; modiied from Grafman and Boller’s(8)) (n = 503), shows that, of
503 children, 111 children had writing dificulty.
Children with dyscalculia: n = 226 (7.8%) Writing:
n = 392 Intellectually normal
n = 432 reading: n = 288
Sample assessed n = 2893
Figure 5. Final results for prevalence of dyscalculia, show that, of the 2,893 children included in the study, 226 could read and write, were intellectually normal, and were suffering from dyscalculia (7.8%).
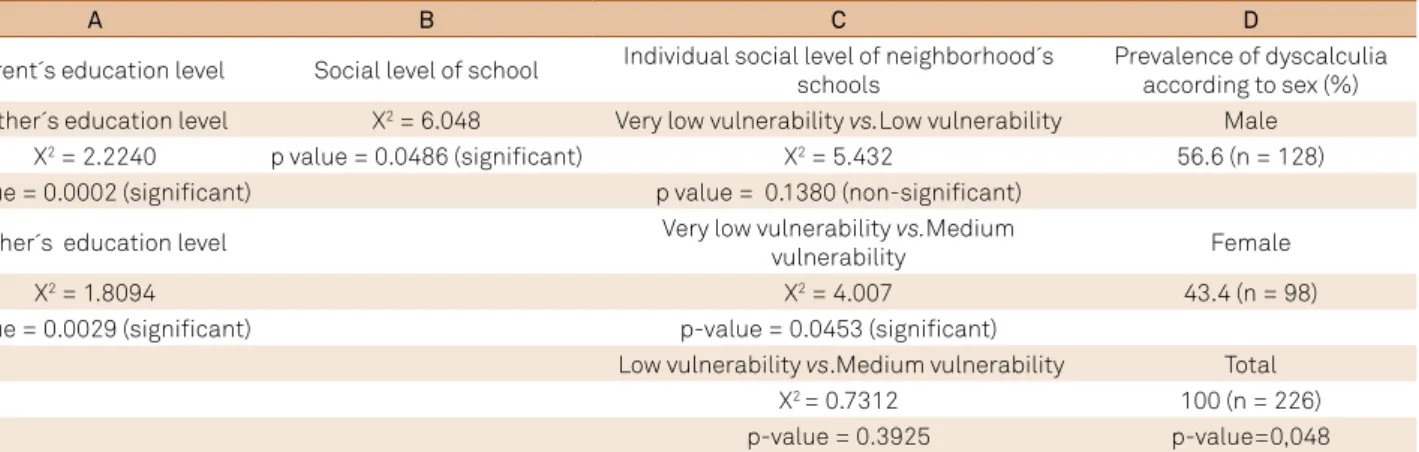
Table 3. Data correlation. When children’s performance was compared with the vulnerability of the neighborhoods in which the schools were located, it was found that the performance was lower between the extremes. The result of the comparison between very low vulnerability and medium vulnerability was signiicant (p-value = 0.0453). When sex was compared, there were a greater number of boys with dyscalculia than girls, with a signiicant p-value (p-value = 0.048).
A B C D
Parent´s education level Social level of school Individual social level of neighborhood´s schools
Prevalence of dyscalculia according to sex (%) Mother´s education level X2 = 6.048 Very low vulnerability vs.Low vulnerability Male
X2 = 2.2240 p value = 0.0486 (signiicant) X2 = 5.432 56.6 (n = 128)
p value = 0.0002 (signiicant) p value = 0.1380 (non-signiicant)
Father´s education level Very low vulnerability vs.Medium
vulnerability Female
X2 = 1.8094 X2 = 4.007 43.4 (n = 98)
p value = 0.0029 (signiicant) p-value = 0.0453 (signiicant)
Low vulnerability vs.Medium vulnerability Total
X2 = 0.7312 100 (n = 226)
individuals, but their studies were conducted with intellectu-ally competent adolescents attending high school and the au-thors attributed these results to environmental factors.
Wei et al.18 assessed children in rural and urban areas
of Great Beijing and found better performance of girls in the tasks of subtraction, complex multiplication, numer-ic comparison, and completing numernumer-ical series. The au-thors attributed these results to better language process-ing. Recently a study in Serbia, supported by the Ministry
of Education, showed a prevalence of 9.9%, number great -er than the world av-erage (3-6%), being attributed to so-cioeconomic factors19. Limitations of this study was to
have been used a non-validated test because in our coun-try there is no gold standard test, also the children evalu-ated were the public schools, for lack of accession of pri-vate schools.
Because of the catastrophic consequences for the indi-vidual and for the country, and there is a clear relationship between educational level, employment and gross domestic
Product of a Nation (OECD), more investments should be made in research and educational policies.
In conclusion, studies in other Brazilian regions with
diferent socioeconomic characteristics are needed in or
-der to ind the real prevalence of developmental dyscal
-culia. Mathematics diiculty as a result of other causes is numerically higher, disorder such as attention deicit and
anxiety to mathematics, which read as mathematics in
diiculty. A clinical situation commonly associated is atten
-tion deicit disorder with or without hyperactivity, which
implies drug treatment with good results20. herefore, care
-ful assessments must be performed to diagnose a medical situation that requires interdisciplinary teams, with conse-quent rehabilitation strategies, as well as other centers us-ing computer resources such as Rescue Calcularis21, and
Race Number22,23. It is essential to raise teachers’ awareness
emphasizing that this group of children should be identiied
and referred for assessment, thus avoiding inappropriate “labels” and certainly compromising their future, closing the doors of colleges, technical courses, and decent jobs, not allowing them to enter into the labor market, which has become increasingly competitive.
Children with dyscalculia associated with reading/writing disorders: n = 431 (14.9%)
Writing: n = 392 reading: n = 288 Children with dyscalculia: n = 226 Intellectuall
y normal n = 432
Sample assessed n = 2893
Figure 6. Final results for prevalence of dyscalculia associated with reading and writing disorders, shows that, when children with reading and writing disorders were added, mathematics impairment was greater, with a total of 432 children
corresponding to 14.9%.
References
1. Associação Americana de Psiquiatria. Manual diagnóstico e estatístico de transtornos mentais (DSM-IV).
Porto Alegre: Artes Médicas; 1995.
2. O`Hare AE, Brown JK, Aitken K. Dyscalculia in children. Dev Med Child Neurol. 1991;33(4):356-61. doi:10.1111/j.1469-8749.1991.tb14888.x
3. Gross-Tsur V, Manor O, Shalev RS. Developmental dyscalculia: prevalence and demographic features. Dev Med Child Neurol. 1996,38(1):25-33. doi:10.1111/j.1469-8749.1996.tb15029.x
4. Shalev RS. Developmental dyscalculia. J Child Neurol. 2004;19(10):765-71. doi:10.1177/08830738040190100601
5. Boller F, Grafman J. Acalculia. In: Frederiks JAM. Clinical neuropsychology. Handb Clin Neurol. 1986;45:473-81.
6. Oishi J, Martins RA, Manzato AJ, Ferrari F, Leme EMMT, Mantovani LR et al. Social diagnostic project of São José do Rio Preto city, SP. In: Book of abstracts of the RSAI World Congress 2008; 2008; São Paulo, SP. São Paulo, SP: Faculdade de Economia e Administração da USP; 2008.
7. Wechsler, D. Wechsler Intelligence Scale for Children; WISC-R. Revised edition (1974).
8. Powell, A. How Sputnik changed U.S. education. Harvard Gazette, 11 Oct 2007. Available from: http://news.harvard.edu/gazette/story/2007/10/ how-sputnik-changed-u-s-education/ acessed 15.10.2012
9. Kosc L. Developmental dyscalculia. J Learn Disabil. 1974;7(3):46-59. doi:10.1177/002221947400700309
Table 4. Relationship between performing calculations and mathematical reasoning x calculation. Shows that, excluding the tests of mathematical problems there was no change in the prevalence of dyscalculia. X2 = 0.7312; p-value = 0.3925 value (non-signiicant).
Performance Below 60 Children with
dyscalculia Calculation and mathematical
reasoning 687 226
Calculation (Excluding the questions of mathematical reasoning from the protocol)
10. Aster M. Developmental dyscalculia in children: Review of the literature and clinical validation. Acta Paedopsychiatr. 1994;56(3):169-78.
11. Lewis C, Hitch GJ, Walker P. The prevalence of speciic arithmetic dificulties and speciic reading dificulties in 9- to 10-year old boys and girls. J Child Psychology and Psychiatric. 1994;35(2):283-92. doi:10.1111/j.1469-7610.1994.tb01162.x
12. Badian NA. Arithmetic and nonverbal learning. In: Myklebust HR (Ed.). Progress in learning disabilities. New York: Grune and Stratton; 1983. Vol 5, p. 235-64.
13. Reigosa-Crespo V, Valdés-Sosa M, Butterworth B, Estévez N, Rodríguez M, Santos E et al. Basic numerical capacities and prevalence of developmental dyscalculia: the Havana Survey. Dev Psychol. 2012;48(1):123-35. doi:10.1037/a0025356
14. Hein J, Bzufka MW, Neumärker KJ. The speciic disorder of arithmetic skills. Prevalence studies in a rural and an urban population sample and their clinico-neuropsychological validation. Eur Child Adolesc Psychiatry. 2000;9(2),S87-101. doi:10.1007/s007870070012
15. Koumoula A, Tsironi V, Stamouli V, Bardani I, Siapati S, Annika G et al. An epidemiological study of number processing and mental calculation in Greek schoolchildren. J Learn Disabil. 2004;37(5):377-88. doi:10.1177/00222194040370050201
16. Benbow CP, Stanley JC. Sex differences in mathematical ability: fact or artifact? Science. 1980;210(4475):1262-4. doi:10.1126/science.7434028
17. Benbow CP, Stanley JC. Sex differences in mathematical reasoning ability: more facts. Science. 1983;222(4627):1029-31. doi:10.1126/science.6648516
18. Wei W, Lu H, Zhao H, Chen C, Dong Q, Zhou X. Gender differences in children’s arithmetic performance are accounted for by gender differences in language abilities. Psychol Sci. 2012;23(3):320-30. doi:10.1177/0956797611427168
19. Jovanović G, Jovanović Z, Banković-Gajić JB, Nikolić A, Svetozarević S, Ristic D. The frequency of dyscalculia among primary school children. Psychiatr Danub. 2013;25(2):170-4.
20. Lindsay RL, Tomazic T, Levine MD, Accardo PJ. Impact of attentional dysfunction in dyscalculia. Dev Med Child Neurol. 1999;41(9):639-42. doi:10.1017/S0012162299001309
21. Kucian K, Grond U, Rotzer S, Henzi B, Schönmann C, Plangger F et al. Mental number line training in children with dećvelopmental dyscalculia. Neuroimage. 2011;57(3):782-95. doi:10.1016/j.neuroimage.2011.01.070
22. Wilson AJ, Revkin SK, Cohen D, Cohen L, Dehaene S. An open trial assessment of “The Number Race”,, an adaptive computer game for remediation of dyscalculia. Behav. Brain Funct. 2006,2(1):20. doi:10.1186/1744-9081-2-20