Arq Neuropsiquiatr 2009;67(4):1124-1132
SPINOCEREBELLAR ATAXIAS
Microsatellite and allele frequency in unaffected and affected individuals
Aline Andrade Freund, Rosana Hermínia Scola, Hélio A.G. Teive, Raquel Cristina Arndt,
Magda Clara Vieira da Costa-Ribeiro, Lupe Furtado Alle, Lineu Cesar Werneck
Abstract – The diagnosis and incidence of spinocerebelar ataxias (SCA) is sometimes difficult to analyze due the overlap of phenotypes subtypes and are disorders of mutations caused by CAG trinucleotide repeat expansion. To investigate the incidence of the SCA in Southern Brazil, we analyzed the trinucleotide repeats (CAG)n at the SCA1, SCA2, SCA3, SCA6 and SCA7 loci to identify allele size ranges and frequencies. We examined blood sample from 154 asymptomatic blood donors and 115 individuals with progressive ataxias. PCR products were submitted to capillary electrophoresis. In the blood donors, the ranges of the five loci were: SCA1, 19 to 36 (CAG)n; SCA2, 6 to 28 (CAG)n; SCA3, 12 to 34 (CAG)n; SCA6, 2 to 13 (CAG)n; and SCA7, 2 to 10 (CAG)n. No deviations from Hardy-Weinberg equilibrium were detected. In the ataxia group, we found (CAG)n above the range of the asymptomatic blood donors in SCA3 (21.74%) followed by SCA2 (5.22%), SCA7 (2.61%), SCA6 (0.87%), and no cases of SCA1. The remaining 80 cases (69.56%) have different diagnoses from the type here studied. These data defined the alleles and their frequencies, as well as demonstrated their stability in the population not affected. The molecular diagnosis test confirmed the clinical diagnosis in 28/45 cases and classified another 7/70 from the clinical unclassified ataxias group.
KEY WORDS: microsatellites repeats, allelic repeats, spinocerebelar ataxia, capillary electrophoresis, population genetics, (CAG)n in Brazilians.
Ataxias espinocerebelares: freqüência de alelos e microsatélites em indivíduos normais e afetados Resumo – A incidência e o diagnóstico das ataxias espinocerebelares (SCA) é algumas vezes difícil de avaliar devido a sobreposição dos diversos subtipos e por algumas serem devido a mutações das expansões do mesmo trinucleotídeo CAG. Para investigar a incidências das SCA no sul do Brasil, analisamos as repetições do trinucleotídeo (CAG)n nos loci das SCA1, SCA2, SCA3, SCA6 e SCA7, a fim de identificar os seus limites e freqüência. Examinamos o sangue de 154 doadores de sangue assintomáticos e 115 pacientes com ataxias progressivas. O produto do PCR do sangue foi submetido a eletroforese capilar. Nos doadores de sangue, as expansões encontradas nos cinco loci foram: SCA1, 19 a 36 (CAG)n; SCA2, 6 a 28 (CAG)n; SCA3, 12 a 34 (CAG)n; SCA6, 2 a 13 (CAG)n; and SCA7, 2 a 10 (CAG)n. Não foi detectado desequilíbrio na equação de Hardy-Weinberg. No grupo das ataxias encontramos repetições CAG acima das freqüências dos doadores de sangue na SCA3 (21,7%), seguido da SCA2 (5,22%), SCA7 (2,61%), SCA6 (0,8%) e não foi encontrado nenhum caso de SCA1. Os 80 casos restantes (69,56%) devem ter uma forma de ataxia diferente das aqui estudadas. Esses dados definem os alelos e suas freqüências, bem como demonstram a sua estabilidade na população não afetada. O diagnóstico molecular confirmou o diagnóstico clínico em 28/45 dos casos e permitiu classificar outros 7/70 que pertenciam ao grupo de ataxias clinicamente não classificadas.
PALAVRAS- CHAVE: repetição de microsatélites, repetição de alelos, ataxia espinocerebelar, eletroforese capilar, genética de populações, (CAG)n em Brasileiros.
Neuromuscular and Molecular Biology Unit, Neurology Division, Internal Medicine Department, Hospital de Clínicas, Universidade Federal do Paraná, Curitiba PR, Brazil.
This study was funded by a grant from Fundação Araucária, Curitiba, Brazil, and partially supported by CNPq (Conselho Nacional de Pesquisas) and CAPES (Coordenação de Aperfeiçoamento de Pessoal de Nível Superior), Brasília, Brazil.
Received 28 July 2009, received in inal form 30 July 2009. Accepted 14 August 2009.
Spinocerebellar ataxia (SCA) subtypes 1, 2, 3 (MJD), 6 (CACNA1), and 7 are late-onset disorders with an auto-somal dominant pattern. SCAs are a heterogeneous group of neurodegenerative disorders with progressive deteri-oration in balance and coordination. The clinical diagno-sis of each one of the several types is complicated by the overlap of the phenotypes between genetic subtypes. Prevalence of SCA is estimated to be 3 in 100,000 people. However, it is possible that this igure is underestimat-ed. The prevalence of speciic subtypes depends on the ethnic origin and geographic location of the populations studied1. The mutations associated with the SCA1, SCA2, SCA3, SCA6 and SCA7 (chromosomes 6p23, 12q23-24.1, 14q21, 19p and 3p21.2-12, respectively) subtypes are caused by CAG trinucleotide repeat expansions in the patient’s genes. These expansions encode polyglutamine repeats. The number of CAG trinucleotide repeats varies from one population to another2-4. In normal individuals, SCA 1 al-leles range from 6 to 39 CAG repeats (CAGn)5-8; in SCA2 alleles range from 15 to 24 CAGn9-11; in SCA3 (Machado Jo-seph disease – MJD) from 13 to 41 CAGn12-14; in SCA6¨from 6 to 16 CAGn15-16, and in SCA7 ranges from 4 to 17 CAGn17-18. Intermediate alleles are found in studies with families which have not been described in the normal population. Individuals that present intermediate alleles between nor-mal and affected may not clinically manifest the disease, while other individuals with the same allele may show signs and symptoms, and can be considered to have alleles with reduced penetrance. The presence of these three dis-tinct groups of alleles shows the importance of deining the range of CAG repetitions for normal individuals and patients for each population19.
Population genetic analysis of expansion diseases suggests a controversial pathogenic mechanism among them20-23. There is the hypothesis that most cases of new mutations that cause expansion diseases arise from the existence of a large number of normal repetitions or in-termediate alleles in the non-affected population. These alleles have been considered reservoirs for the genera-tion of new expanded alleles24. The ability to correlate the prevalence of a particular expansion disease with the frequency of highest size of normal alleles in the respec-tive gene depends directly on the epidemiological pro-ile of these diseases. This correlation was no observed among Portuguese with MJD and no intermediate alleles were seen in the normal population23. Moreover, it is be-lieved that expanded alleles in MJD are maintained in the population over generations by presenting greater adap-tive value25. Allelic frequencies in the normal population could explain the evolutionary mechanism to support ex-panded alleles through generations20,23.
The present study is an analysis of trinucleotide (CAG) n repeats in unaffected and affected individuals from
Southern Brazil (Paraná) of SCA1, SCA2, SCA3, SCA6 or SCA7 ataxia in order to deine protocols, allelic frequency and repeat number ranges (number of CAG repeats).
METHOD
DNA samples
The sample consisted of 154 asymptomatic blood donors from Southern Brazil (Paraná) chosen at random and 115 patients with progressive ataxia after being ruled out structural disor-der of the central nervous system. The suspicion diagnosis ac-cording the clinical indings were SCA2 (7 cases), SCA3 (30 cas-es), SCA4 (1 case), SCA6 (5 cascas-es), SCA7 (3 cascas-es), SCA8 (1 case), SCA10 (7 cases), Friedreich ataxia (2 cases) and unclassiied atax-ias by clinical indings (59 cases). None of the blood donors in-cluded in this sample had a clinical diagnosis or family history of spinocerebellar ataxia. The donor group consisted of 90 males and 64 females, with a mean age of 32.29±10.63 years. The pop-ulation breakdown of the blood donor group was as follows: 72.46% Euro-Brazilians, 2.17 % Afro-Brazilians, 23.19 % admixed and 2.17% Amerindians.
Blood samples were collected in tubes with EDTA (BD Va-cutainer), and genomic DNA was extracted from peripheral leu-kocytes using a phenol-chloroform procedure as previously
de-scribed26. Written informed consent was obtained from each
individual. The study had been previously approved by the Eth-ics Committee of the Hospital de Clínicas – Universidade Fed-eral do Paraná.
PCR ampliication and capillary electrophoresis
The ive loci were ampliied in three different reactions with 10 to 30 ng of genomic DNA using an MJ Research model PTC thermal cycler (MJ Research, inc., Watertown, MA, USA). Prim-ers were end-labeled with luorescent dyes appropriate for ABI PRISM instruments (Applied Biosystems, Foster City, CA, USA). Fluorescent labels were selected based on the normal allele size ranges described above for each locus, while taking care to en-sure that loci with overlapping size ranges were given different labels. The following reactions were carried out: one triplex re-action with 1.5 pmol of each primer for SCA1 (36), SCA2 (10) and SCA6 (18); a single reaction with 12pmol of each SCA3 prim-er (SCA3F 5’NED-CTGGCCTTTCACATGG 3’ and SCA3R 5’ CCA-GTCACTACTTTGATTCGTG 3’) and a reaction with 15 pmol of each SCA7 primer (SCA7F 5’VIC- TTGTAGGAGCGGAAAGAAT-GTC 3’and SCA7R 5’ CTTCAGGACTGGGCAGAGG 3’). The last two pairs of primers (SCA3 pair and SCA7 pair) were designed for the present study. The triplex reaction was performed with AccuPrime DNA polymerase systems (1X buffer BII – 2mM of each dNTPs; 1.5 mM of MgCl2; 200mM Tris-HCl pH 8.4 and 1.5U
AccuPrime Taq DNA polymerase) (Invitrogen/Stratagene, La
mmol/L MgCl2 and 1.5 U YT1 Taq DNA polymerase (Promega, Madison, WI, USA). In the SCA7 reaction, 4% of DMSO was add-ed. All reactions had a inal volume of 15 µL. The triplex reac-tion condireac-tions were 1 cycle at 96oC for 10 min; 32 cycles at 94oC
for 1 min, a ramp rate of 0.2oC/s, 61oC for 1 min 30sec and 68oC
for 1 min 30 sec and 1 cycle at 68oC for 1 hour. The SCA3
reac-tion condireac-tions were 1 cycle at 95oC for 10 min; 5 cycles at 95oC
for 1 min, 59oC for 1 min and 72oC for 1 min 30 sec; 20 cycles at
95oC for 1 min, 60oC for 1 min and 72oC 1min 30 sec; 7 cycles at
95oC for 1 min, 61oC for 1 min and 72oC for 1 min 30 sec; and a
i-nal extension at 72oC for 1 hour. The SCA7 reaction conditions
were 1 cycle at 96oC for 10 min; 5 cycles at 95oC for 1 min, 51oC
for 1 min and 72oC for 1 min 30 sec; 21 cycles at 95oC for 1 min,
52oC for 1 min and 72oC for 1 min 30 sec; 7 cycles at 95oC for 1
min, 55oC for 1 min and 72oC for 1min 30 sec; and a inal
exten-sion at 72oC for 1 hour. Samples were prepared by adding 1 µL of
each PCR reaction to 5 µL of deionized formamide and 0.25 µl of internal molecular weight standard (GS-500 ROX). After de-naturizing, the samples were injected into an ABI PRISM 3100-A-vant Genetic analyzer with a 36 cm ×50 µm capillary containing Performance Optimized Polymer-4 (POP-4) for 5 sec. Amplicon length was calculated by comparison with the molecular weight standard using the Genemapper program.
The sizes of the PCR products were calculated automatical-ly on the basis of a standard curve from the internal size stan-dard. Each allele represents the number of CAG repeats. While different individuals had the same alleles, these differed slight-ly in size (bp) from the theoretical values for amplicon length of trinucleotide-repeat region. To deine the alleles reliably, those individuals with alleles whose sizes were close to the theoreti-cal values were grouped together. Using statistitheoreti-cal analysis, the median and variance for clinically normal patients was deter-mined. Those values are used in Genemapper program to de-terminate the alleles of each loci.
Statistical and genetic analysis
The number of CAG repeats was calculated and statistical analysis performed using SPSS software. Hardy-Weinberg (HW) proportions and heterozygosis (H) were calculated using Gene-pop software27,28.
RESULTS
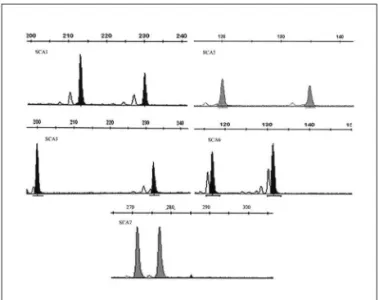
The SCA1, SCA2, SCA3, SCA6 and SCA7 loci were ana-lyzed in 308 chromosomes for each locus from 154 normal individuals from Southern Brazil and in 230 chromosomes for each locus from 115 individuals with clinical suspicion of ataxia. The PCR conditions resulted in consistent am-pliication of the normal-size alleles analyzed, which are seen as well-deined peaks with no background and ab-normal expanded are seen with stutter band from somatic mosaicism and technical artifacts (Figs 1 and 2).
Inter-assay variability of the same allele among dif-ferent individuals at each SCA locus (calculated as a 95%
Fig 1. Ampliication of normal-range alleles at each locus analyzed - well-deined peaks with no background. SCA1: Spinocerebellar Atax-ia type 1; SCA2: Spinocerebellar AtaxAtax-ia type 2; SCA3: Spinocerebel-lar Ataxia type 3; SCA6: SpinocerebelSpinocerebel-lar Ataxia type 6; SCA7: Spi-nocerebellar Ataxia type 7.
Fig 2. Ampliication of expanded alleles from patients with spinoc-erebellar ataxia. SCA2: Spinocspinoc-erebellar Ataxia type 2; SCA3: Spinoc-erebellar Ataxia type 3; SCA6: SpinocSpinoc-erebellar Ataxia type 6; SCA7: Spinocerebellar Ataxia type 7.
conidence interval) ranged from 0.11 to 1.66 bp. For the most frequent alleles at each locus, a higher variance (1.10) was observed in allele 5 of SCA7. The intra-assay variabili-ty was taken repeating ive times the same product of am-pliication of ive different individuals. This was carried out for the ive loci. This variability (calculated as a 95% conidence interval) also was between 0.02 to 0.69 bp.
for the SCA3 locus ranged from 12 to 34 (CAG)n with 18 different alleles dispersed through the locus (Table 3). In the blood donors, the SCA6 allele size ranged from 2 to 13 (CAG)n with 8 different alleles (Table 4). The SCA7 lele size ranged from 2 to 10 (CAG)n with 7 different al-leles (Table 5). No expanded or intermediate alal-leles were found at SCA1, SCA2, SCA3, SCA6 and SCA7 loci. Among patients the number of alleles ranged from 23 to 36 (CAG) n in SCA1 with 12 different alleles. No expanded alleles were found in this locus (Table 1). In locus SCA2 the size
Table 1. Allelic frequencies (±SE%) at the ive loci analyzed for spinocerebellar ataxia 1 (SCA1) among controls and patients.
SCA 1
Alleles Controls Patients
*19 0.35±0.34 –
*20 0.35±0.34 –
*23 0.35±0.34 0.54±0.54
*24 0.35±0.34 –
*25 0.35±0.34 0.54±0.54
*26 2.78±0.94 2.15±1.06
*27 2.78±0.94 2.15±1.06
*28 7.29±1.48 4.84±1.57
*29 28.11±2.56 27.42±3.27
30 32.29±2.66 37.1±3.54
31 10.76±1.77 7.53±1.93
32 7.99±1.54 11.83±2.37
33 2.78±0.94 3.76±1.39
34 1.39±0.67 –
35 1.04±0.58 0.54±0.54
36 1.04±0.58 1.6±0.92
SE: Standard error of mean; –: not detected; *: alleles not described in other Brazilian populations.
Table 2. Allelic frequencies (±SE%) at the ive loci analyzed for spinocerebellar ataxia 2 (SCA2) among controls and patients.
SCA 2
Alleles Controls Patients
**6 0.35±0.34 –
*14 0.35±0.34 0.43±0.48
*15 0.35±0.34 0.43±0.48
*17 0.35±0.34 2.17±1.06
19 0.35±0.34 0.87±0.67
20 84.44±1.95 84.35±2.64
21 7.29±1.48 7.00±1.85
22 1.04±0.57 0.43±0.48
23 0.69±0.47 –
*25 1.74±0.74 0.87±0.67
*26 0.35±0.34 –
*27 0.35±0.34 –
*28 0.35±0.34 0.87±0.67
37 – 0.43±0.48
38 – 1.30±0.82
43 – 0.43±0.48
56 – 0.43±0.48
SE: Standard error of mean; –: not detected; *: alleles not described in others Brazilian populations; **: alleles not described in other populations. Expanded alleles are in bold case.
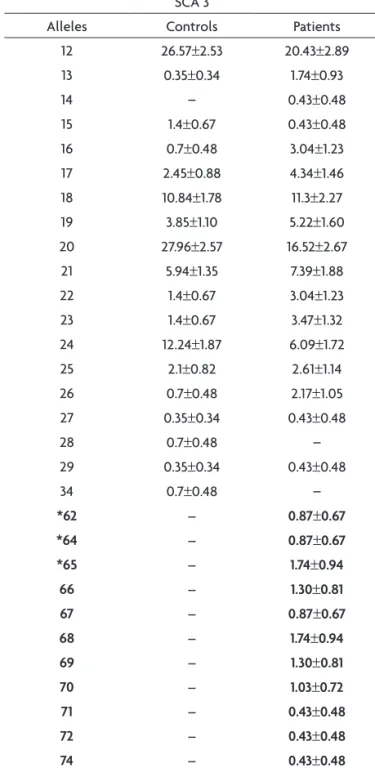
Table 3. Allelic frequencies (±SE%) at the ive loci analyzed for spinocerebellar ataxia 3 (SCA3) among controls and patients.
SCA 3
Alleles Controls Patients
12 26.57±2.53 20.43±2.89
13 0.35±0.34 1.74±0.93
14 – 0.43±0.48
15 1.4±0.67 0.43±0.48
16 0.7±0.48 3.04±1.23
17 2.45±0.88 4.34±1.46
18 10.84±1.78 11.3±2.27
19 3.85±1.10 5.22±1.60
20 27.96±2.57 16.52±2.67
21 5.94±1.35 7.39±1.88
22 1.4±0.67 3.04±1.23
23 1.4±0.67 3.47±1.32
24 12.24±1.87 6.09±1.72
25 2.1±0.82 2.61±1.14
26 0.7±0.48 2.17±1.05
27 0.35±0.34 0.43±0.48
28 0.7±0.48 –
29 0.35±0.34 0.43±0.48
34 0.7±0.48 –
*62 – 0.87±0.67
*64 – 0.87±0.67
*65 – 1.74±0.94
66 – 1.30±0.81
67 – 0.87±0.67
68 – 1.74±0.94
69 – 1.30±0.81
70 – 1.03±0.72
71 – 0.43±0.48
72 – 0.43±0.48
74 – 0.43±0.48
of the alleles ranged from 14 to 56 (CAG)n and four ab-normal expanded alleles were found in six patients (Ta-ble 2). The locus SCA3 have the size of the alleles ranging from 12 to 74 (CAG)n with 28 different alleles. There are 11 expanded alleles in 25 patients (Table 3). The size be-tween alleles at SCA6 ranged from 2 to 21 (CAG)n with 9 different alleles. Only one expanded allele was found at
the SCA6 locus in only one patient (Table 4). These pa-tients at SCA7 locus showed the size of the alleles ranging from 2 to 50 (CAG)n with two expanded alleles in three patients (Table5).
Among the 115 patients with progressive cerebellar ataxia tested, the molecular diagnosis was positive in 35 cases (Table 6).
Table 4. Allelic frequencies (±SE%) at the ive loci analyzed for spinocerebellar ataxia 6 (SCA6) among controls and patients.
SCA 6
Alleles Controls Patients
**2 2.08±0.81 2.66±1.17
4 7.98±1.54 1.06±0.75
5 0.35±0.34 5.32±1.64
8 39.59±2.79 35.11±3.48
9 18.4±2.21 14.36±2.56
10 29.17±2.59 33.52±3.44
11 2.08±0.81 6.91±1.85
12 – 0.53±0.53
13 0.35±0.34 –
21 – 0.53±0.53
SE: Standard error of mean; –: not detected; **: alleles not described in other populations. Expanded alleles are in bold case.
Table 5. Allelic frequencies (±SE%) at the ive loci analyzed for spinocerebellar ataxia 7 (SCA7) among controls and patients.
SCA 7
Alleles Controls Patients
**2 1.15±0.67 2.17±1.34
4 70.61±2.88 64.38±4.38
5 8.4±1.75 10.00±2.75
6 16.03±2.32 18.26±3.54
7 2.67±1.02 3.48±1.68
8 0.76±0.55 –
10 0.38±0.39 –
39 – 0.87±0.85
50 – 0.43±0.60
SE: Standard error of mean; –: not detected; **: alleles not described in other populations. Expanded alleles are in bold case.
Table 6. Relationship between clinical and molecular diagnosis in 115 patients with progressive ataxia. Molecular diagnosis
Positive Negative
Clinical diagnosis
(SCA2, SCA3, SCA6, SCA7) 28 (a) 17 (b) 45 (a+b)
Unclassiied progressive ataxias 7 (c) 63 (d) 70 (c+d)
35 (a+c) 80 (b+d) 115
c2=32.86 p=0.000
Sensibility: a/(a+c)=80.00 % VPP: a/(a+b)=62.22 % Speciicity: d/(b+d)=78.75 % VPN: d/(c+d)=90.00 %
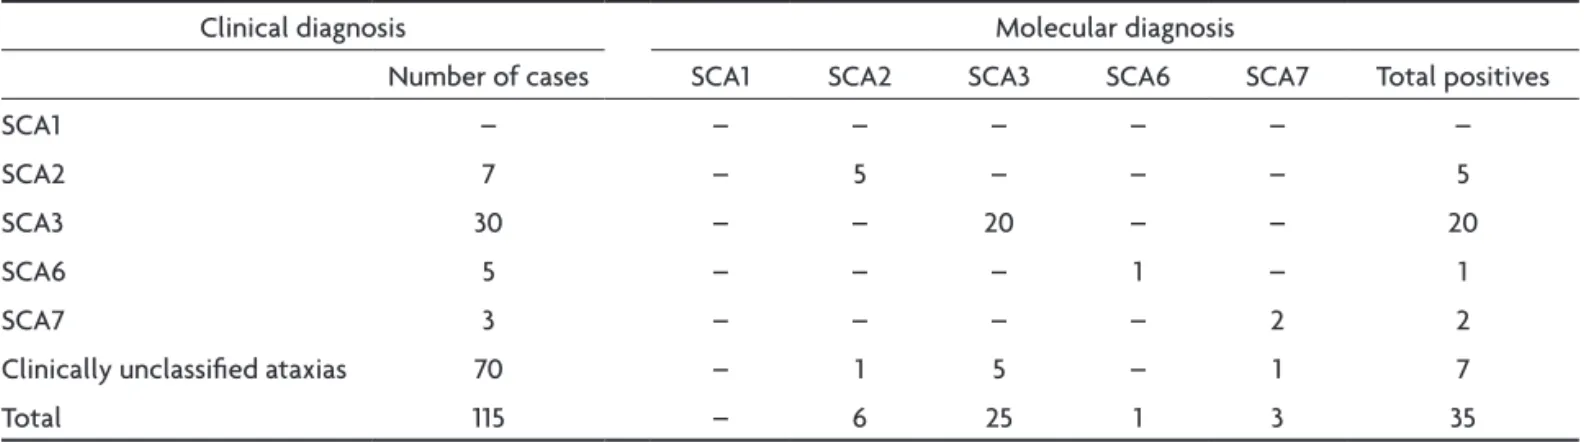
Table 7. Clinical and molecular diagnosis in 115 cases of progressive ataxias.
Clinical diagnosis Molecular diagnosis
Number of cases SCA1 SCA2 SCA3 SCA6 SCA7 Total positives
SCA1 – – – – – – –
SCA2 7 – 5 – – – 5
SCA3 30 – – 20 – – 20
SCA6 5 – – – 1 – 1
SCA7 3 – – – – 2 2
Clinically unclassiied ataxias 70 – 1 5 – 1 7
Total 115 – 6 25 1 3 35
The molecular tests conirmed the clinical suspicion in 5 of 7 cases of SCA2, in 20 of 30 cases of SCA3, in 1 of 5 cases of SCA6 and in 2 of 3 SCA7. In the group of unclassi-ied ataxias, was found 1 cases SCA2, 5 cases of SCA3 and 1 case of SCA7 (Table 7).
At these ive subtypes of ataxia, the most frequent among patients is SCA3, followed by SCA2, SCA7 and SCA6. No case of SCA1 was found (Table 8).
All individuals with expansion featuring are heterozy-gous, so they showed a normal allele and the other al-lele expanded.
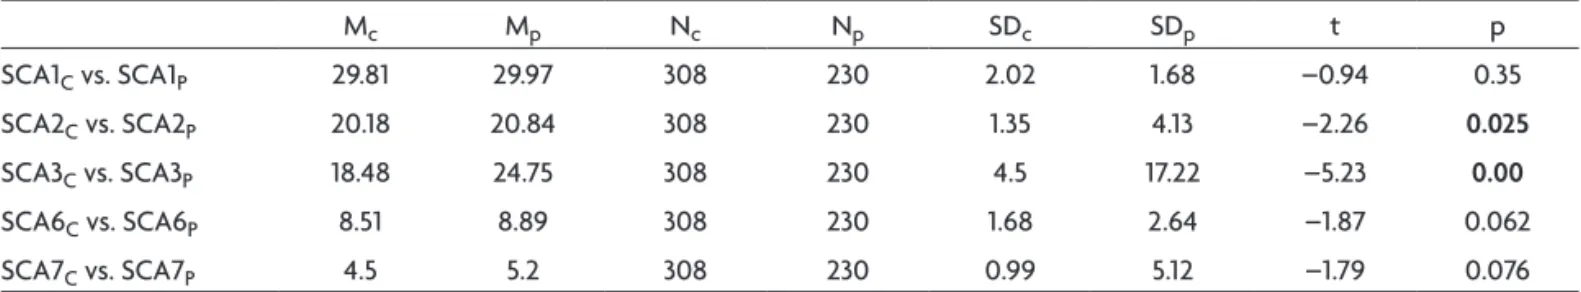
No deviations from Hardy-Weinberg (HW) equilibrium were detected and the heterozygosis (H) data for the ive loci are in Table 9. Signiicant differences in mean allel-ic size (number base pairs) between patients and control samples were found for SCA2 and SCA3 loci (Table 10).
DISCUSSION
Capillary electrophoresis (CE) has been used for DNA fragment analysis in a number of studies to determine the number of microsatellite repeats in expansion illnesses29-31.
In the present study, small variations in allele size were observed between individuals, although the alleles were close to the expected theoretical sizes. This variation is probably due to factors such as electrophoresis tempera-ture, the polymer batch number, and capillary age29-31.
Methods to deine alleles in these SCA loci by compar-ing the results of capillary electrophoresis (CE) with those of PAGE assay have been published and show a discrepan-cy in amplicons sizes between these methodologies. In CE, amplicons were found to migrate faster than predicted, and the results show a lower number of repeats in one or two peaks29-31. Factors contributing to these discrepancies could be the different sieving effects of cross-linked PAGE compared with the linear polymer used in CE, the electro-osmotic effect, the extent of denaturation or differenc-es in secondary structure between amplicons and stan-dard markers32. Considering the previous studies regard-ing differences between PAGE with CE, we did not com-pare these two methodologies. Since the standard devia-tion for each allele was small the use of GS-500 ROX pro-vided reliable results. To estimate the range of each allele we analyzed the samples of normal asymptomatic popu-lation and deined a pool of existing alleles in these indi-viduals. When the mean allelic size of patients was com-pared with normal asymptomatic population we found a signiicant difference in the SCA2 and SCA3 (Table 10).
Table 8. Frequency of diseases at 115 individuals with clinical suspicion of ataxia.
Diseases
Frequency (%)
Number of individuals
SCA1 0 0
SCA2 5.22 6
SCA3 21.74 25
SCA6 0.87 1
SCA7 2.61 3
Clinically unclassiied ataxias 69.56 80
Table 9. Heterozygosis and Hardy-Weinberg equilibrium (Qui Square (c2), probability and degrees of freedom)
in ive loci analyzed.
Loci c2 p Degrees of freedom Heterozygosis (H)
SCA1 12.87 0.80 18 0.79
SCA2 2.10 0.84 5 0.24
SCA3 20.13 0.33 18 0.82
SCA6 4.96 0.97 12 0.72
SCA7 12.87 0.80 7 0.47
Table 10. Comparison of all alleles from 115 patients and control asymptomatic population (“t” test for independent samples) in spinocerebellar ataxias (SCA).
Mc Mp Nc Np SDc SDp t p
SCA1C vs. SCA1P 29.81 29.97 308 230 2.02 1.68 –0.94 0.35
SCA2C vs. SCA2P 20.18 20.84 308 230 1.35 4.13 –2.26 0.025
SCA3C vs. SCA3P 18.48 24.75 308 230 4.5 17.22 –5.23 0.00
SCA6C vs. SCA6P 8.51 8.89 308 230 1.68 2.64 –1.87 0.062
SCA7C vs. SCA7P 4.5 5.2 308 230 0.99 5.12 –1.79 0.076
The 36-repeat allele in the SCA1 locus is borderline in some populations being an intermediate allele with re-duced penetrance8. Therefore, patients who have this al-lele should be considered negative for SCA1 in southern Brazilian population. Our data found no intermediate al-leles for SCA2, SCA3, SCA6 or SCA7 in the unaffected pop-ulation. However, studies of families with SCA traits usual-ly reveal an intermediate allele size3,8,10,33. Probably, inter-mediate alleles are as rare as the expanded alleles and it must be found only in affected families with the disease.
A 22-repeat allele is described in other populations as the most frequent at the SCA2 locus10,11,24. Molecular anal-ysis of unrelated Brazilian families with SCA3 showed that normal alleles ranged from 12 to 33 (CAG)n34, and in oth-er populations studied the two major alleles had 14 and 23 (CAG)n13,35. Comparisons of allelic frequencies must be made using population studies based on the CE method-ology. Despite the differences in allele size ranges found in this study could be attributed to methodological fac-tors, discrepancies in alleles size ranges are important to characterize the Brazilian population since each human population could present their own genetic proile dif-ferent from others.
Intermediate allele values tend to trigger the growth of repetitions leading to the expansion. There are stud-ies of clinically normal individuals with MJD in different populations that support the idea that the presence of al-leles of size greater than or equal to 27 (CAG)n correlates with higher prevalence of MJD in patients35. According to this study we found alleles with a size equal to or greater than 27 (CAG)n in the MJD gene, and MJD is the most fre-quent ataxia among patients. These indings have an epi-demiological interest as these alleles appear to be in hap-lotypes that have a great potential for expansion by gene conversion19,36-40.
Alleles with a number of (CAG)n greater than 27 are observed in the Portuguese, American, Japanese and Af-rican populations, of which there is a high incidence in SCA3 patients13,37,41. In the patient group in the present study, SCA3 locus had more expanded alleles than oth-er loci. This corroborates the hypothesis that the Portu-guese and African populations brought a pool of found-ing genes to Brazil with a common mutation in the SCA3 gene identiied as the cause of MJD (SCA3)37,41-43. However, other studies of the Portuguese population did not show any correlation between the frequency of the large nor-mal alleles and the frequency of the disease20-23. There was no signiicant correlation between the frequency of MJD and the frequency of small, medium or large nor-mal alleles in the SCA3 locus of the Portuguese popula-tion23. Most of the mutant chromosomes worldwide share a common haplotype, and a second haplotype were found to be present in a group of Portuguese patients. Two other
additional haplotypes were found in some families. These haplotypes may have derived from a main haplotype as a result of microsatellite mutations44. Studies associating in-tragenic haplotypes with intergenerational repeat length instability in the normal chromosome did not support the hypothesis of pre-mutation40. The results of the present study, in which no expanded or intermediate alleles were found in the normal population, corroborate the studies cited above.
Even genetic loci with very similar molecular charac-teristics have different expansion dynamics. The wide-spread distribution of the wild-type MJD alleles is attrib-uted to a high mutation rate, without any bias to expan-sion, which could explain the observed allelic frequen-cies. This is in accordance with a model that postulates the presence of a small number of mutational events from which most of the MJD cases worldwide have originated20 and contrasts with indings for Huntington disease (HD)21, in which intermediate and expanded alleles are observed in the normal population. The results of these studies may corroborate the idea that there is a mechanism that main-tains these diseases in the population and suggest the ex-istence of a few founding chromosomes from which all families originated.
No correlation could be made in the locus SCA 3 only with the data found in this work because patients with MJD is most common form of ataxia and in the sample control no alleles intermediate 46 to 56 (CAG)n) were ob-served in normal alleles and 2.1% of alleles size range from 27 up to 34 (CAG)n. A study with a larger sample, in which there could be a stratiication by Brazilian regions with distinct frequencies of MJD, for example, could lead to a positive or negative correlation between the highest in-cidence of the disease with normal alleles whose num-ber of (CAG)n are larger than 27. Furthermore, the pop-ulation study of alleles with potential to expansion can lead to accurate understanding of how alleles are stable avoiding the appearance of alleles expanded. Another in-teresting fact is that intermediate alleles have ambigui-ty between the possibiliambigui-ty of normal and patient pheno-type and is important elucidate possible cis elements in-volved with molecular mechanisms that may lead to one or the other phenotype.
The present study provides subsidy to understand the origin of the mutations in loci SCA 1, SCA 2, SCA 3, SCA 6 and SCA 7. However, a haplotypic study including oth-er sites of these loci should be carried out in both sam-ples. This is an initial study and in the future other types of ataxia due to CAG repetitions will be done, such as SCA 12, SCA17 and DRPL, to expand the molecular diag-nosis at our center.
stabili-ty in this population. Data of heterozygosis (H) charac-terized the population as the amount heterozygous for each gene. The heterozygosis in this study for the five loci is similar to that that found elsewhere45. Heterozygo-sis similar to the locus ATXN 3 is described in other pop-ulations of the world (H=0.84, H=0.86)37. This result com-bined with no deviation of HW equilibrium indicates that the region of (CAG)n in the gene of MJD can be used as a marker in studies of population genetics23.
The frequency of subtypes of SCA 1, 3 and 6 found in this study is similar to those found in others reports but different for SCA2 and SCA734,45,46. The differences between these results may be due to distinct loci ana-lyzed and probably because the sample of Brazilian pa-tients come from different regions of the country. These results are in agreement with the postulations by differ-ent authors on the variability of alleles and frequency of subtypes of ataxia in different populations. Furthermore, this difference emphasizes the importance of population study in different regions of Brazil due to the ethnic diver-siication in the constitution of the country.
In conclusion, the statistical data from our study al-lowed us to identify the alleles and their frequencies. This study deined the normal range for each one of the ive subtypes and found expanded alleles in patients. Popula-tion genetic analysis ensured the technical quality of this assay and allowed the normal range of (CAG)n size re-peats to be deined in order to distinguish between unaf-fected and afunaf-fected individuals for diagnostic purposes. To understand the origins of the mutations at these loci it is important to consider the information provided by the normal range variation so as to understand the dy-namics of these loci and provide data to be useful from Southern Brazil.
REFERENCES
1. Schöls L, Bauer P, Schmidt T, Schulte T, Riess O. Autosomal dominant cerebellar ataxias: clinical features, genetics, and pathogenesis. Lancet Neurol 2004;3:291-304.
2. Pujana MA, Corral J, Gratacòs M, et al. Spinocerebellar ataxias in Span-ish patients: genetic analysis of familial and sporadic cases: the Ataxia Study Group. Hum Genet 1995;104:516-522.
3. Ranum LP, Lundgren JK, Schut LJ. Spinocerebellar ataxia type1 and Machado-Joseph disease:incidence of CAG expansions among adult-onset ataxia patients from 311 families with dominant, recessive, or spo-radic ataxia. Am J Hum Genet 1995;57:603-608.
4. van de Warrenburg BP, Hendriks H, Dürr A, et al. Age at onset vari-ance analysis in spinocerebellar ataxias: a study in a Dutch-French co-hort. Ann Neurol 2005;57:505-512.
5. Genis D, Matilla T, Volpini V, et al. Clinical, neuropathologic, and ge-netic studies of a large spinocerebellar ataxia type 1 (SCA1) kindred: (CAG)n expansion and early premonitory signs and symptoms. Neu-rology 1995;45:24-30.
6. Matilla T, Volpini V, Genis D, et al. Presymptomatic analysis of spinoc-erebellar ataxia type 1 (SCA1) via the expansion of the SCA1 CAG-re-peat in a large pedigree displaying anticipation and parental male bias. Hum Mol Genet 1993;2:2123-2128.
7. Suzuki Y, Sasaki H, Wakisaka A, et al. Spinocerebellar ataxia 1 (SCA1)
in the Japanese: analysis of CAG trinucleitide (sic) repeat expansion and instability of the repeat for paternal transmission. Jpn J Hum Genet 1995;40:131-143.
8. Zuhlke C, Dalski A, Hellenbroich Y, Bubel, S, Schwinger, Burk K. Spi-nocerebellar ataxia type 1 (SCA1): phenotype-genotype correlation studies in intermediate alleles. Europ J Hum Genet 2002;10:204-209. 9. Cancel G, Durr A, Didierjean O, et al. Molecular and clinical
correla-tions in spinocerebellar ataxia 2: a study of 32 families. Hum Mol Genet 1997;6:709-715.
10. Pulst SM, Nechiporuk A, Nechiporuk T, et al. Moderate expansion of a normally biallelic trinucleotide repeat in spinocerebellar ataxia type 2. Nat Genet 1996;14:269-276.
11. Sanpei K, Takano H, Igarashi S, et al. Identiication of the spinocerebel-lar ataxia type 2 gene using a direct identiication of repeat expansion and cloning technique. Nat Genet 1996;14:277-284.
12. Giunti P, Sweeney MG, Harding AE. Detection of the Machado-Joseph disease/spinocerebellar ataxia three trinucleotide repeat expansion in families with autosomal dominant motor disorders, including the Drew family of Walworth. Brain 1995;118:1077-1085.
13. Kawaguchi Y, Okamoto T, Taniwaki M. CAG expansions in a novel gene for Machado-Joseph disease at chromosome 14q32.1. Nat Genet 1994; 8:221-228.
14. van Alfen N, Sinke RJ, Zwarts MJ, et al. Intermediate CAG repeat lenghts (53, 54) for MJD/SCA 3 are associated with an abnormal phe-notype. Ann Neurol 2001;49:805-807.
15. Matsuyama Z, Kawakami H, Maruyama H, et al. Molecular features of the CAG repeats of spinocerebellar ataxia 6 (SCA6). Hum Mol Genet 1997;6:1283-1287.
16. Zhuchenko O, Bailey J, Bonnen P. Autosomal dominant cerebellar atax-ia (SCA6) assocatax-iated with small polyglutamine expansions in the alpha 1A-voltage-dependent calcium channel. Nat Genet 1996;15:62-69. 17. David G, Abbas N, Stevanin G, et al. Cloning of the SCA7 gene reveals
a highly unstable CAG repeat expansion. Nat Genet 1997;17:65-70. 18. Stevanin G, Giunti P, Belal GD, et al. De novo expansion of intermediate
alleles in spinocerebellar ataxia 7. Hum Molec Genet 1998;7:1809-1813. 19. Andrew SE, Goldberg YP, Hayden MR. Rethinking genotype and
phe-notype correlations in polyglutamine expansion disorders. Hum Mol Genet 1997;6:2005-2010.
20. Andres A, Lao O, Soldevila M, Calafell F, Bertranpetit J. Dynamics of CAG repeat loci revealed by the analysis of their variability. Hum Mutat 2002;21:61-70.
21. Costa MC, Guimarães L, Ferreirinha F, Sousa A, Maciel P, Sequeiros J. Study of the normal CAG tract at the Huntington disease locus in the Portuguese population. Eur J Hum Genet 2002;10:263-264.
22. Deka R, Miki T, Yin SJ, et al. Normal CAG repeat variation at the DRP-LA locus in world populations. Am J Hum Genet 1995;57:508-511. 23. Lima M, Costa MC, Montiel R, et al. Population genetics of wild-type
CAG repeats in the Machado-Joseph disease gene in Portugal. Hum Hered 2005;60:156-163.
24. Imbert G, Saudou F, Yvert G, et al. Cloning of the gene for spinocere-bellar ataxia 2 reveals a locus with high sensitivity to expanded CAG/ glutamine repeats. Nat Genet 1996;14:285-291.
25. Prestes PR, Saraiva-Pereira ML, Silveira I, Sequeiros J, Jardim LB. Machado-Joseph disease enhances genetic itness: a comparison be -tween affected and unaffected women and be-tween MJD and the gen-eral population. Ann Hum Genet 2008;72:57-64.
26. Sambrook J, Fritsch EF, Maniats T. Molecular Cloning, 2nd Ed. Cold
Spring Harbor, NY, Cold Spring Harbor Laboratory, 1989:16-19. 27. Hartl D. Génétique des Population, Edition Française. Editora
Médi-cine-Sciences Flammarion, Paris, 1998:5-34.
28. Raymond M, Rousset F. GENEPOP (version 1.2): population genetics software for exact tests and ecumenicist. J Hered 1995;86:248-249. 29. Dorschner MO, Barden D, Stephens K. Diagnosis of ive spinocerebel
-lar ataxia disorders by multiplex ampliication and capil-lary electro -phoresis. J Mol Diagn 2002;4:108-113.
31. Le H, Fung D, Trent RJ. Applications of capillary electrophoresis in DNA mutation analysis of genetic disorders. Mol Pathol 1997;50:261-265. 32. Rosenblum BB, Oaks F, Menchen S, Johnson B. Improved single-strand DNA sizing accuracy in capillary electrophoresis. Nucleic Acids Res 1997;25:3925-3929.
33. Takiyama Y, Oyanagi S, Kawashima S, et al. A clinical and pathologic study of a large Japanese family with Machado-Joseph disease tightly linked to the DNA markers on chromosome 14q. Neurology 1994;44: 1302-1308.
34. Lopes-Cendes I, Teive HGA, Cardoso F et al. Molecular characteristics of Machado-Joseph disease mutation in 25 newly described Brazilian families. Braz J Genet 1997;20:717-724.
35. Takano H, Cancel G, Ikeuchi T. Close associations between prevalence of dominantly inherited spinocerebellar ataxias with CAG-repeat ex-pansions and frequencies of large normal CAG alleles in Japanese and Caucasian populations. Am J Hum Genet 1998;63:1060-1066. 36. Bauer PO, Zumrova A, Matoska V, et al. Absence of spinocerebellar
ataxia type3/Machado-Joseph disease within ataxia patients in the Czech population. Eur J Neurol 2005;12:851-857.
37. Limprasert P, Nouri N , Heyman RA, et al. Analysis of CAG repeat of the Machado-Joseph gene in human, chimpanzee and monkey popu-lations: a variant nucleotide is associated with the number of CAG re-peats. Hum Mol Genet 1996;5:207-213.
38. Chattopadhyay B, Basu P, Gangopadhyay PK. Variation of CAG repeats and two intragenic polymorphisms at SCA3 locus among
Machado-Jo-seph disease/SCA3 patients and diverse normal populations from east-ern India. Acta Neurol Scand 2003;108:407-414.
39. Mittal U, Srivastava AK, Jain S, Mukerji M. Founder haplotype for Macha-do-Joseph disease in the Indian population. Arch Neurol 2005; 62:637-640. 40. Maciel P, Gaspar C, Guimaraes L. Study of three intragenic polymor-phisms in the Machado-Joseph disease gene (MJD1) in relation to ge-netic instability of the (CAG)n tract. Eur J Hum Genet 1999;7:147-156. 41. Teive HAG, Arruda WO. A família Drew de Walworth - um século após
a avaliação inicial inalmente o diagnóstico. Arq Neuropsiquiatr 2004; 62:177-180.
42. Silveira I, Lopes-Cendes I, Kish S, et al. Frequency of spinocerebellar ataxia type1, dentatorubropallidoluysiana atrophy and Machado Jo-seph disease mutations in a large group of spinocerebellat ataxia pa-tients. Neurology 1996;46:214-218.
43. Harding AE. Clinical features and classiication of inherited ataxias. Adv Neurol 1993;61:1-14.
44. Gaspar C, Lopes-Cendes I, Hayes S, et al. Ancestral origins of the Machado-Joseph disease mutation: a worldwide haplotype study. Am J Hum Genet 2001;68;523-528.
45. Silveira I, Miranda C, Guimarães L, et al. Trinucleotide repeats in 202 families with ataxia: a small expanded (CAG)n allele at the SCA 17 lo-cus. Arch Neurol 2002;59:623-629.