Mauren Lúcia de Araújo Bergmann
, Gabriel Gustavo Bergmann
, Ricardo Halpern
, Ricardo Rodrigo Rech
,
Cristine Boom Constanzi
1, Lidiane Requia Alli
1Universidade Luterana do Brasil - Ulbra1, Canoas; Universidade Federal do Pampa (Unipampa)2, Uruguaiana, RS; Universidade de Caxias do Sul - UCS3, Caxias do Sul, Rio Grande do Sul - Brazil
Abstract
Background: Evidence has suggested that a significant proportion of children and adolescents has high levels of total cholesterol.
Objective: To estimate the prevalence of hypercholesterolemia and associated factors in 07-12 year-old school children.
Methods: School based cross sectional study of a random sample of 1,294 07-12 year-old school children from Caxias do Sul/RS, Brazil. The students answered an interview with information on socioeconomic status, food habits, and physical and leisure activities. Total cholesterol, cardiorespiratory fitness, body mass and height were measured to calculate body mass index. For the data treatment, univariate, bivariate, and multivariate analyzes were used.
Results: The multivariate analysis identified that individuals from high socioeconomic level (OR: 1.70; CI: 1.05-2.75), of female gender (OR: 1.32; CI: 1.03-1.67), and overweight (OR: 1.40; IC: 1.10-1.77) had increased chances of having increased total cholesterol (≥ 3rd tercile).
Conclusion: High total cholesterol levels on 07-12 year-old school children are associated with high socioeconomic level, female gender, and overweight. Encouraging an active life style and appropriate dietary habits can help control cholesterol levels and reduce risk factors. (Arq Bras Cardiol. 2011; [online].ahead print, PP.0-0)
Keywords: Cholesterol; risk factors; child, adolescent; hypercholesterolemia.
Mailing address: Gabriel Gustavo Bergmann •
Rua General Bento Martins, 3530/405 - Centro - 97510-002 - Uruguaiana, RS - Brazil
E-mail: [email protected], [email protected] Manuscript received September 11, 2010; revised manuscript received September 11, 2010; accepted February 08, 2011.
Introduction
Cardiovascular diseases (CVD) are the leading causes of death in developed countries, accounting for thousands of deaths each year1. In Brazil, these conditions determine one
third of all deaths and are the leading cause of medical spending, thus causing a substantial increase in health expenditures2.
One of the main risk factors for CVD is hypercholesterolemia. Epidemiological studies show that high concentrations of total cholesterol (TC) increase the likelihood of developing cardiovascular diseases, leveraged throughout life by obesity and a set of other factors such as smoking, hypertension, diet, family history and sedentary lifestyle3.
Evidence from studies indicate that the deposition of fat on the artery walls begins in childhood and is more likely with higher cholesterol levels in the blood4. However, it rarely leads
to adverse outcomes in children’s health, but its long-term effects can be considerable, since changes in lipid metabolism,
present in childhood and adolescence tends to persist into adulthood, contributing to the development of CVD5.
Evidence from a number of studies shows a high prevalence of hypercholesterolemia in children and adolescents6-9.
Considering that CVD develops slowly and progressively, starting to act since the first years of life, and that TC is an important player in this process, it becomes important to undertake studies on the prevalence of hypercholesterolemia in children and adolescents. However, it is essential that these studies, in addition to diagnosing the prevalence, are also geared towards identifying the factors associated with hypercholesterolemia. Early detection of this problem can provide tools for creating policies to prevent these factors in pediatric patients and preventing or delaying CVD in adults. Given the information presented and discussed, this study aimed to estimate the prevalence of hypercholesterolemia among schoolchildren aged 7 to 12 years of age and their potential associations with sociodemographic indicators, lifestyle, and health-related physical fitness (HRPF).
Methods
a) population of 33,241 schoolchildren of this age group according to information from the state and municipal offices of education; b) estimated prevalence of hypercholesterolemia in 20%; c) confidence interval 95% (95%CI); d) statistical power of 80%; e) acceptable sampling error of 3%; f) design effect (deff) equal to 1.5 to control confounding factors; and g) adding a further 15% to compensate for possible losses and refusals. With the adoption of these criteria the need to evaluate 1,154 students was estimated. The sampling criterion used was probabilistic sampling by clusters, where each school was considered a conglomerate. All the local schools (153) participated in the draw with the same chances to participate in the study according to the number of students aged 7-12 years. All students aged between 7 and 12 from the eight selected schools were invited to participate in the study. Only those with informed consent signed by an adult and those who expressed willingness to participate in the study were included in the sample. This study was approved by the Ethics Committee of the Institution where the study was conducted (protocol 2006-365H). Data collection occurred from April to August of 2007 by four graduate students (three physical education professionals and one physiotherapist) previously trained to collect data.
Initially, a block-structured interview was performed with each of the individuals who comprised the sample for the evaluation of socio-demographic information, dietary habits and physical activity habits and leisure activities. Information regarding socioeconomic status was stratified according to the classification proposed by Barros and Victora10, which
considers the use of 13 variables to produce the National Economic Indicator.
TC values (dependent variable) were obtained through the portable monitor Accutrend™ GCT (Roche Diagnostics) using the method of photometry of reflection. The collection method followed the instructions recommended by the manufacturer. The measurement intervals were 150-300 mg/ dl and the time required for measurement was 180 seconds. Blood was withdrawn by puncture of the volar surface of distal phalanx of the ring finger through the lancing device (softclix pro) and their disposable lancets, graded from 1 to 3 in increasing degree of penetration depth (depth: 1 = smallest; 2 = medium; 3 = largest). To standardize, we used the degree 2 of penetration for all examinations. To initiate the procedure, the finger should be clean and, after puncturing, the individual received a cotton swab to press on the site. The students were not required to be fasting, since the TC shows no significant variation with the individual whether or not fasting11. This form of measuring TC (portable monitor
Accutrend™ GCT Roche Diagnostics) and this procedure (not fasting) were used in a campaign in Brazil by the Brazilian Society of Cardiology in more than 81,000 individuals12. TC
was divided into tertiles, and the first (T1) and second tertiles (T2) were grouped and considered as “normal” and the top tercile (T3) was considered “increased.”
The following independent variables were considered: a) socioeconomic status (high, middle or low); b) education
of household head (≥ 13 years, 9-12 years or ≤ 8 years); c)
type of residence (house or flat); d) age (7-9 or 10-12 years); e) gender (male or female); d) dietary habits (breakfast - yes
or no; lunch every day - yes or no, repeat meal - yes or no; dinner - yes or no - eating after dinner - yes or no); e) physical activity habits and leisure activities (walking / cycling to school - yes or no, practicing sports at leisure - yes or no, time per day watching television, videogames and computer
- ≤ 1 hour, 1-3 hours or ≥ 3 hours); f) cardiorespiratory
fitness (adequate or low); g) and nutritional status (normal or overweight). Except for the last two variables described here, the other independent variables were collected by structured interview.
Cardiorespiratory fitness was estimated from the 9-minute run/walk test following the procedures of measurement and evaluation suggested by the Project Esporte Brasil13. Nutritional
status was estimated from the values of body mass index (BMI), and the students were classified (normal or overweight) according to the cutoffs suggested by the Project Esporte Brasil13. To calculate BMI, height and weight measurements
were taken following recommended procedures13.
For data quality control, 5% of assessments were redone via phone at random and double data entry. The data were stored in a database formatted in EpiData. After checking the consistency of data, the database was exported to the program SPSS 13.0, where they were analyzed. Univariate, bivariate and multivariate analyses were performed.
In the univariate analysis, absolute and relative frequencies (proportions) were used in each of the variables followed by CI95%. For the bivariate analyses, chi-square test was used for heterogeneity and chi-square test was used for trend. In this analysis, each independent variable was associated with a dichotomized dependent variable (“normal” or “increased” TC).
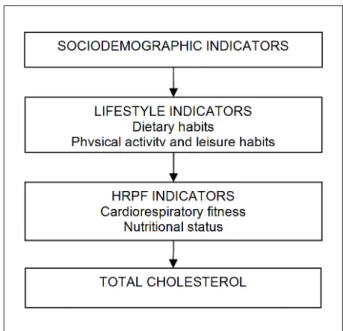
In the multivariate analysis, binary logistic regression was used with dichotomized TC as an outcome. Only the variables that presented significance level (p) equal to or smaller than 0.2 in the bivariate analysis were included in the multivariate model. The input of each of the independent variables in the multivariate analysis took place according to the hierarchical theoretical model constructed (Fig. 1). The theoretical model considered three blocks of causal determination (proximal, intermediate and distal). The first block (sociodemographic indicator) included socioeconomic status, education of household head, type of residence, age and sex. The intermediate block (indicators of lifestyle) included dietary and physical activity habits and leisure activities. The last level (HRPF indicators) included cardiorespiratory fitness and nutritional status. The final multivariate model considered as factors associated with increased TC the independent variables that showed p smaller than or equal to 0.05.
Results
Table 1 continuation - Description of results for the variables studied in students aged 7 to 12 years in Caxias do Sul (RS), 2007
Lifestyle indicators
Dietary habits
Breakfast
Yes 1,132 79.2 (77.1-81.3)
No 298 20.8 (18.7-22.9)
Having lunch every day
Yes 1,372 95.9 (94.9-96.9)
No 298 4.1 (3.1-5.1)
Repeating the meal (lunch)
Yes 400 28.1 (25.8-30.4)
No 1,021 71.9 (69.6-74.2)
Having dinner
Yes 1,301 90.9 (89.4-92.4)
No 130 9.1 (7.6-10.6)
Eating after dinner
Yes 357 26.2 (23.9-28.5)
No 1,004 73.8 (71.5-76.1)
Physical activity habits and leisure
Walking/cycling to school
Yes 825 58.2 (55.6-60.8)
No 592 41.8 (39.2-44.4)
Practicing sports at leisure
Yes 535 38.7 (41.3-36.1)
No 847 61.3 (58.7-63.9)
Daily time with TV. video game and computer
< 1 hour 403 28.5 (26.1-30.9)
1-3 hours 585 41.3 (38.7-43.9)
> 3 hours 428 30.2 (27.8-32.6)
HRPF indicators
Cardiorespiratory itness (9 minutes)
Proper 530 37.8 (35.3-40.3)
Low 873 62.2 (59.7-64.7)
Nutritional status (BMI)
Normality 1.039 72.1 (69.8-74.4)
Excess weight 403 27.9 (25.6-30.2)
n - sample number;% - proportion of the sample, CI95% - conidence interval
of 95%. Figure 1 - Hierarchical theoretical model of factors associated with high
cholesterol.
Table 1 - Description of results for the variables studied in students aged 7 to 12 years in Caxias do Sul (RS), 2007
Variable n % (CI95%)
Dependent
Total cholesterol
Normality (< 3ºT) 849 65.6 (63.0-68.2)
Increased (≥ 3ºT) 345 34.4 (32.0-36.8)
Socio-demographic indicators
Socioeconomic status
Low 125 10.7 (8.9-12.5)
Intermediate 356 30.4 (27.8-33.0)
High 691 59.0 (56.2-61.8)
Education level of household head
≥ 13 years 162 13.7 (11.7-15.7)
9 -12 years 368 31.2 (28.5-33.8)
≤ 8 years 651 55.1 (52.3-57.9) Type of residence
Home 1,291 89.5 (87.9-91.1)
Apartment 151 10.5 (8.9-12.1)
Age group
7-9 years 686 47.6 (45.0-50.2)
10-12 years 756 52.4 (49.8-55.0)
Gender
Male 721 50 (47.4-52.6)
Female 721 50 (47.4-52.6)
than or equal to 0.20. Out of the variables that made up the block of sociodemographic indicators, socioeconomic status, age and sex were associated with a significance level that met the criteria previously set to be included in the multivariate model. The results pointed to a high socioeconomic status, younger age group (7-9 years), and female sex associated with high TC level (table 2).
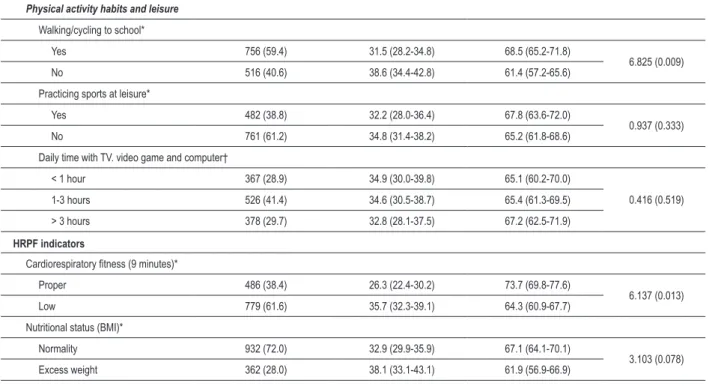
Table 2 - Bivariate analysis between total cholesterol (normality - increased) and the independent variables in schoolchildren in Caxias do Sul (RS), 2007
Variable Total cholesterol
Increased Normality
Socio-demographic indicators n (%) % (CI95%) % (CI95%) c2(p)
Socioeconomic status†
Low 116 (10.9) 24.1 (16.3-31.9) 75.9 (68.1-83.7)
6.041 (0.014) Intermediate 316 (29.8) 31.3 (26.2-36.4) 68.7 (63.6-73.8)
High 629 (59.3) 35.5 (31.8-39.2) 64.5 (60.8-68.2)
Education level of household head†
≥ 13 years 146 (13.7) 34.2 (26.5-41.9) 65.8 (58.1-73.5)
0.222 (0.637) 9 -11 years 332 (31.2) 34.3 (29.2-39.4) 65.7 (60.6-70.8)
≤ 8 years 586 (55.1) 32.8 (29.0-36.6) 67.2 (63.4-71.0)
Type of residence*
Home 1.157 (89.4) 34.7 (32.0-37.4) 65.3 (62.6-68.0)
0.612 (0.434) Apartment 137 (10.6) 31.4 (23.6-39.2) 68.6 (60.8-76.4)
Age group*
07-09 years 606 (46.8) 36.8 (33.0-40.6) 63.2 (59.4-67.0)
2.932 (0.087) 10-12 years 688 (53.2) 32.3 (28.8-35.8) 67.7 (64.2-71.2)
Gender*
Male 652 (50.4) 32.5 (28.9-36.1) 67.5 (63.9-71.1)
2.046 (0.153) Female 642 (49.6) 36.3 (32.6-40.0) 63.7 (60.0-67.4)
Lifestyle indicators
Dietary habits
Breakfast*
Yes 1,018 (79.3) 33.9 (31.0-36.8) 64.1 (61.1-67.1)
0.889 (0.346) No 265 (20.7) 37.0 (31.2-42.8) 63.0 (57.2-68.8)
Having lunch every day*
Yes 1,234 (96.1) 34.8 (32.1-37.5) 65.2 (62.5-67.9)
0.937 (0.324) No 50 (3.9) 28.0 (15.5-40.5) 72.0 (59.5-84.5)
Repeating the meal (lunch)*
Yes 907 (31.1) 33.5 (30.4-36.6) 66.5 (63.4-69-6)
0.504 (0.478) No 368 (28.9) 35.6 (30.7-40.5) 64.4 (59.5-69.3)
Having dinner*
Yes 1,168 (91.0) 34.0 (31.3-36.7) 66.0 (63.3-68.7)
1.499 (0.221) No 116 (9.0) 39.7 (30.8-48.6) 60.3 (51.4-69.2)
Eating after dinner*
Yes 895 (73.2) 34.1 (57.1-63.5) 65.9 (62.8-69.0)
0.176 (0.675) No 328 (26.8) 35.4 (30.2-40.6) 64.6 (59.4-69.8)
Table 2 continuation - Bivariate analysis between total cholesterol (normality - increased) and the independent variables in schoolchildren in Caxias do Sul (RS), 2007
Physical activity habits and leisure
Walking/cycling to school*
Yes 756 (59.4) 31.5 (28.2-34.8) 68.5 (65.2-71.8)
6.825 (0.009) No 516 (40.6) 38.6 (34.4-42.8) 61.4 (57.2-65.6)
Practicing sports at leisure*
Yes 482 (38.8) 32.2 (28.0-36.4) 67.8 (63.6-72.0)
0.937 (0.333) No 761 (61.2) 34.8 (31.4-38.2) 65.2 (61.8-68.6)
Daily time with TV. video game and computer†
< 1 hour 367 (28.9) 34.9 (30.0-39.8) 65.1 (60.2-70.0)
0.416 (0.519) 1-3 hours 526 (41.4) 34.6 (30.5-38.7) 65.4 (61.3-69.5)
> 3 hours 378 (29.7) 32.8 (28.1-37.5) 67.2 (62.5-71.9)
HRPF indicators
Cardiorespiratory itness (9 minutes)*
Proper 486 (38.4) 26.3 (22.4-30.2) 73.7 (69.8-77.6)
6.137 (0.013) Low 779 (61.6) 35.7 (32.3-39.1) 64.3 (60.9-67.7)
Nutritional status (BMI)*
Normality 932 (72.0) 32.9 (29.9-35.9) 67.1 (64.1-70.1)
3.103 (0.078) Excess weight 362 (28.0) 38.1 (33.1-43.1) 61.9 (56.9-66.9)
n - sample number; % - proportion of the sample; CI95% - conidence interval 95%; c2 - Chi-squared test; p - signiicance level; *Chi-squared test for heterogeneity;
†Chi-squared test for trend.
cardiorespiratory fitness and overweight were associated with high TC levels (table 2).
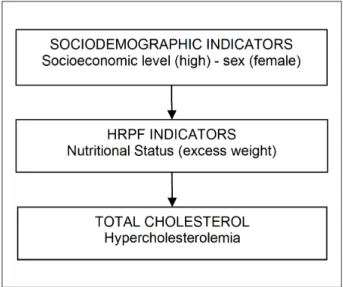
To perform the multivariate analysis, the order of entry of factors associated with the model was performed as shown in Table 3, i.e., respecting the hierarchical theoretical model (Fig. 1). Binary logistic regression analyses, in gross odds ratio (OR) values, confirm the results of the Chi-Square analyses. Students from families of middle and high socioeconomic status, younger age groups, females, who do not walk/ cycle to school, who have low cardiorespiratory fitness and overweight have increased chances of presenting increased TC. When analyzed together (odds ratio adjusted), some of the variables mentioned above lose statistical significance and do not constitute the final multivariate model. The results of binary logistic regression analysis adjusted indicate that high socioeconomic status, female sex and overweight are associated with increased TC levels in students aged 7 to 12 years of age (table 3, figure 2).
Discussion
The results for increased TC levels in the population studied pointed to a prevalence of 34.4%. Considering that high TC level was defined as values at or above the 3rdT
of the distribution and this value was 170 mg/dl, the same value recommended for classification of TC as borderline in individuals aged under 18 years11, it is possible to compare
our results with some studies available in the literature. Similar results were found in different studies6-9, even in neighboring
regions and with similar habits and culture as the population of
the study concerned7. Moreover, there is evidence suggesting
prevalence of hypercholesterolemia still higher than those found in this study14.
In addition to the results of increased TC, other characteristics of concern were found in the population of this study. The high prevalence of low cardiorespiratory fitness and excess weight are similar to those reported by other studies in different regions of Brazil15-20. The concern with these results is due to
the association presented by these two characteristics with increased TC, as evidenced in this study and in a series of another study21-24.
From the bivariate analysis, it was possible to identify the variables, including those used in this study, which were associated with increased TC. Similarly to that found by Gerber and Zielinsky7, in this study, high socioeconomic status was
associated with increased TC. These results deserve attention, since the two studies were conducted in geographically close cities, whose populations have similar cultural characteristics, which may contribute to the similarity of the results. However, as highlighted by Grillo et al25, even with results that suggest
there is no influence of socioeconomic status9, there is a
predominance of studies demonstrating the association between high socioeconomic status and increased TC levels in children and adolescents.
Table 3 - Gross and adjusted odds ratio for total cholesterol (normality - increased) and associated factors among schoolchildren in Caxias do Sul (RS), 2007
Variable Binary logistic regression
Socio-demographic indicators n (%) Gross OR (CI95%) p Adjusted OR (CI95%) p
Socioeconomic status
Low 116 (10.9) 1.00 - 1.00
-Intermediate 316 (29.8) 2.19 (1.72-2.78) 0.000 1.11 (0.82-1.51) 0.464
High 629 (59.3) 3.14 (2.05-4.80) 0.000 1.70 (1.05-2.75) 0.031
Age group
10-12 years 606 (46.8) 1.00 - 1.00
-07-09 years 688 (53.2) 2.09 (1.78-2.46) 0.000 1.15 (0.89-1.48) 0.282
Gender
Male 652 (50.4) 1.00 - 1.00
-Female 642 (49.6) 2.07 (1.76-2.44) 0.000 1.32 (1.03-1.67) 0.031
Lifestyle indicators
Physical activity habits and leisure
Walking/cycling to school
Yes 756 (59.4) 1.00 - 1.00
-No 516 (40.6) 2.17 (1.86-2.53) 0.000 1.24 (0.96-1.62) 0.099
HRPF indicators
Cardiorespiratory itness (9 minutes)
Proper 486 (38.4) 1.00 - 1.00
-Low 779 (61.6) 2.79 (2.02-3.87) 0.000 1.20 (0.78-1.84) 0.399
Nutritional status (BMI)
Normality 932 (72.0) 1.00 - 1.00
-Excess weight 362 (28.0) 2.04 (1.78-2.33) 0.000 1.40 (1.10-1.77) 0.005
n - sample number; % - proportion of the sample; CI95% - conidence interval 95%; OR - odds ratio; p - signiicance level.
Figure 2 - Final theoretical model after multivariate analysis between total
cholesterol and associated factors among schoolchildren in Caxias do Sul,
Brasil, 2007.
schoolchildren are associated with higher levels of TC, the results of a study conducted in Belo Horizonte (MG) indicated that children (under 11 years) have significantly higher average total cholesterol than adolescents (from 12 to 18 years)27. However,
even with much of the results of different studies indicating an association between increasing age and a reduction in TC, there is evidence that do not support these findings8.
Also with respect to the variables that made up the block of sociodemographic indicators, sex was also associated with TC. Just as the two previous variables, where associations with TC are supported in the literature, information regarding sex suggest, as found in this study, that female sex shows an association with increased TC6,8,18,27-29.
Furthermore, it is important to report that some studies have considered the importance of going to school as a major component of the active lifestyle of children and adolescents32,33.
Unlike what was reported by other studies34,35, associations
between dietary habits and TC were not found. These differences may be related to the way dietary habits were operationalized in this study. In this investigation, the students were asked only about having or not the main meals of the day (breakfast, lunch and dinner) and whether they used to repeat the meals at lunch and have anything to eat after dinner, while in other studies the questions referred to the type of food and nutients34,35. This characteristic can be considered
a limitation of this study.
With regard to the block of HRPF indicators, the two variables were associated with TC. These findings are similar to those found by a number of other studies21-24,30,31,36. These
results highlight the need for actions aimed at controlling excess weight, and for the encouragement of physical exercise by children and adolescents, encouraging them to adopt a lifestyle that will help them in the primary prevention of cardiovascular diseases37,38.
After bivariate analyses, all independent variables that correlated with the dependent variable were part of the multivariate analysis. The results of this analysis found that only socioeconomic status, sex and nutritional status remained in the model. Students belonging to families of high socioeconomic status had 70% more chances to have increased TC than their peers from families of low socioeconomic status (OR = 1.70; 95%CI = 1.05-2.75), reinforcing the information discussed in the literature regarding associations between socioeconomic status and TC7,25.
Considering the results provided by the multivariate analysis, associations between sex and TC presented and discussed above are reinforced6,8,18,27-29. The adjusted odds
ratio indicated that female students had 32% more chances to have increased TC than the male students (OR = 1.32, 95%CI = 1.03-1.67).
The last variable to remain in the model after the multivariate analysis was nutritional status. Students classified as overweight had increased chances (40%) to experience high TC levels compared to students classified as normal nutritional status (OR = 1.40; 95%CI = 1.10-1.77). These findings reinforce the well-established association between nutritional status and TC21-24,30,31.
It is important, however, to emphasize that these results are in line with information from some of the studies described here. Stabeline Neto et al21 found that even after correcting for
BMI, cardiorespiratory fitness remained significantly associated with TC in boys. A study involving prepubertal students on the participation of cardiorespiratory fitness, fat percentage
and level of physical activity in determining levels of TC (and other biological risk factors for cardiovascular diseases) indicated that cardiorespiratory fitness has the highest ability to explain the variation of TC results30. In turn, the results of
multivariate analysis of this study are reinforced by evidence from studies that indicate the nutritional status as a variable more associated with TC than with cardiorespiratory fitness23.
Prior to presenting the findings, it is necessary to consider some limitations of the study. Besides the previously mentioned limitation on the procedure used to obtain the information regarding dietary habits, other limitations should be highlighted. Although there were significant associations between various independent variables with TC, it is not possible to establish causality, because it is a cross sectional study. Although the determination of TC alone does not require fasting11 and has already been used as a strategy in
other studies12, this characteristic should be observed, since
the reference values were obtained by fasting for 12 hours. In addition, some results are subject to the recall bias of students who, for being children, may have provided misleading information, especially about their lifestyle. Besides this, it is necessary to stress the non-inclusion of family history as one of the independent variables in this study. Some evidence suggests an association of this characteristic with TC levels of children and adolescents9,39. Nevertheless, regardless of the
limitations, our findings are representative and reinforce the body of knowledge about TC and the variables associated with it in children aged 7-12.
Conclusions
References
1. World Health Organization. The Global Burden of Disease: 2004 UpDate. Geneva:WHO Press;2008.
2. Ministério da Saúde, Secretaria de Vigilância em Saúde. Perfil de mortalidade do brasileiro. [citado em 2010 Dez 10]. Disponível em: http://portal.saude. gov.br/portal/arquivos/pdf/coletiva_saude_061008.pdf
3. Klag ML, Ford DE, Mead LA, He J, Whelton PK, Liang KY, et al. Serum cholesterol in young men and subsequent cardiovascular disease. N Engl J Med. 1993; 328(5):313-8.
4. Raitakari OT, Juonala M, Kähönen M, Taittonen L, Tomi Laitinen T, Mäki-Torkko N, et al. Cardiovascular risk factors in childhood and carotid artery intima-media thickness in adulthood: the cardiovascular risk in Young Finns Study. JAMA. 2003;290(17):2277-83.
5. Webber LS, Srinivasan SR, Wattigney WA, Berenson GS. Tracking of serum lipids and lipoproteins from childhood to adulthood: the Bogalusa Heart Study. Am J Epidemiol. 1991;133(9):884-99.
6. de Franca E, Alves JG. Dislipidemia entre crianças e adolescentes de Pernambuco. Arq Bras Cardiol. 2006;87(6):722-7.
7. Gerber ZRS, Zielinsky P. Fatores de risco de aterosclerose na infância: um estudo epidemiológico. Arq Bras Cardiol. 1997;69(4):231-6.
8. Moura EC, Mellin AS, Figueiredo DBL. Perfil lipídico em escolares de Campinas, SP, Brasil. Rev Saúde Pública. 2000; 34(5): 499-505.
9. Romaldini CC, Issler H, Cardoso AL, Diament J, Forti N. Fatores de risco para aterosclerose em crianças e adolescentes com história familiar de doença arterial coronariana prematura. J Pediatr. 2004;80(2):135-40.
10. Barros AJD, Victora CG. Indicador econômico para o Brasil baseado no censo demográfico de 2000. Rev Saúde Pública. 2005;39(4):523-9.
11. Santos RD; Sociedade Brasileira de Cardiologia. III Diretrizes brasileiras sobre dislipidemias e diretriz de prevenção da aterosclerose do Departamento de Aterosclerose da Sociedade Brasileira de Cardiologia. Arq Bras Cardiol. 2001;77(supl 3):1-48.
12. Martinez TL, Rocha SRD, Armaganijan D, Torres KP, Loures-Vale A, Magalhães ME, et al . National alert campaign about increased cholesterol: determination of cholesterol levels in 81,262 Brazilians. Arq Bras Cardiol. 2003; 80(6):635-8.
13. Projeto Esporte Brasil. [citado em 2010 nov 17]. Disponível em: http://www. proesp.ufrgs.br.
14. Pereira A, Guedes AD, Verreschi IT, Santos RD, Martinez TLR. A obesidade e sua associação com outros fatores de risco cardiovascular em escolares de Itapetininga, Brasil. Arq Bras Cardiol. 2009;93(3):253-60.
15. Lancarotte I, Nobre MR; Zanetta R, Polydoro M. Estilo de vida e saúde cardiovascular em adolescentes de escolas do município de São Paulo. Arq Bras Cardiol. 2010;95(1):61-9.
16. Mendonça MRT, da Silva MAM, Rivera IR, Moura AA. Prevalência de sobrepeso e obesidade em crianças e adolescentes da cidade de Maceió. Rev Assoc Med Bras. 2010;56(2):192-6.
17. Bergmann GG, Araújo MLB, Lorenzi T, Garlipp D, Gaya A. Alteração anual no crescimento e na aptidão física relacionada à saúde de escolares. RBCDH. 2005;7(2):55-61.
18. Bergmann MLB, Bergmann GG, Halpern R. Perfil lipídico, de aptidão cardiorrespiratória, e de composição corporal de uma amostra de escolares de 8ª série de Canoas/RS. Rev Bras Med Esporte. 2008;14(1):22-7.
19. Guedes DP, Guedes JERP, Barbosa DS, Oliveira JA. Aptidão física relacionada à saúde e fatores de risco predisponentes às doenças cardiovasculares em adolescentes. Revista Portuguesa de Ciência de Desporto. 2002;2(5):31-46.
20. Nascimento TBR, Pereira DC, Glaner MF. Prevalência de indicadores de aptidão física relacionada à saúde em escolares. Motriz. 2010;16(2):387-94.
21. Stabelini Neto A, Bozza R, Ulbrich AZ, Vasconcelos IQA, Boguszewski MCS, Campos W. Fatores de risco para aterosclerose associados à aptidão cardiorrespiratória e ao IMC em adolescentes. Arq Bras Endocrinol Metab. 2008;52(6):1024-30.
22. Brage S, Weddrkopp N, Ekelund U, Franks PW, Wareham NJ, Andersen LB, et al. European Youth Heart Study (EYHS). Features of the metabolic syndrome are associated with objectively measured physical activity and fitness in Danish children: the European Youth Heart Study (EYHS). Diabetes Care. 2004;27(9):2141-8.
23. Eisenmann JC, Welk GJ, Wickel EE, Blair SN. Combined influence of cardiorespiratory fitness and body mass index on cardiovascular disease risk factors among 8-18 year old youth: The Aerobics Center Longitudinal Study. Int J Pediatr Obes. 2007;2(2):66-72.
24. Janssen I, Cramp WC. Cardiorespiratory fitness is strongly related to the metabolic syndrome in adolescents. Diabetes Care. 2007;30(8):2143-4.
25. Grillo LP, Crispim SP, Siebert AN, Andrade ATW, Rossi A, Campos IC. Perfil lipídico e obesidade em escolares de baixa renda. Rev Bras Epidemiol. 2005;8(1):75-81.
26. Dai S, Fulton JE, Harrist RB, Grunbaum JA, Steffen LM, Labarthe DR. Blood lipids in children: age-related patterns and association with body-fat indices: Project Heart Beat. Am J Prev Med. 2009;37(1Suppl.):S56-S64.
27. Ribeiro RQC, Lotufo PA, Lamounier JA, Oliveira RG, Soares JF, Botter DA. Fatores adicionais de risco cardiovascular associados ao excesso de peso em crianças e adolescentes: o estudo do coração de Belo Horizonte. Arq Bras Cardiol. 2006;86(6):408-18.
28. Duarte JA, Ribeiro JC, Oliveira J, Mota J. The relationship between physical activity cholesterol levels in children and adolescents. Rev Bras Saúde Mater Infant. 2004;4(2):185-92.
29. Kelishade R, Sadri G, Tavasoli AA, Kahbazi M, Roohafza HR, Sadeghi M, et al. A prevalência cumulativa de fatores de risco para doença cardiovascular em adolescentes iranianos - IHHP- HHPC. J Pediatr. 2005;81(6):447-53.
30. Tolfrey K, Campbell IG, Jones AM. Selected predictor variables and the lipid-lipoprotein profile of prepubertal girls and boys. Med Sci Sports Exerc. 1999;31(11):1550-7.
31. Ostojic SM, Stojanovic M, Stojanovic V, Maric J. Adiposity, physical activity and blood lipid profile in 13-year-old adolescents. J Pediatr Endocrinol Metab. 2010;23(4):333-43.
32. Hallal PC, Bertoldi AD, Gonçalves H, Victora CG. Prevalência de sedentarismo e fatores associados em adolescentes de 10-12 anos de idade. Cad Saúde Pública. 2006;22(6):1277-87.
33. Santos CM, Wanderley Júnior RS, Barros SSH, Farias Júnior JC, Barros MVG de. Prevalência e fatores associados à inatividade física nos deslocamentos para escola em adolescentes. Cad Saúde Pública. 2010;26(7):1419-30.
34. Hopper CA, Gruber NB, Munoz KD, MacConnie SE, Pfingston YM, Nguyen K. Relationship of blood cholesterol to body composition, physical fitness, and dietary intake measures in third-grade children and their parents. Res Quart Exerc Sport. 2001;72(2):182-8.
35. Nicklas TA, Webber LS, Srinivasan SR, Berenson GS. Secular trends in dietary intakes and cardiovascular risk factors of 10-y-old children: the Bogalusa Heart Study (1973-1988). Am J Clin Nutr. 1993;57(6):930-7.
36. Rodrigues NA, Perez AJ, Carletti L, Bissoli NS, Abreu GR. Aptidão cardiorrespiratória e associação com fatores de risco cardiovascular em adolescentes. J Pediatr. 2007;83(5):429-35.
37. Williams CL, Hayman LL, Daniels SR, Robinson TN, Steinberger J, Paridon S, et al. Cardiovascular health in childhood: a statement for health professionals from the committee on atherosclerosis, hypertension, and obesity in the young , American Heart Association. Circulation. 2002;106(1):143-60.
38. Kavey RW, Daniels SR, Lauer RM, Atkins DL, Hayman LL, Taubert K. American Heart Association guidelines for primary prevention of atherosclerotic cardiovascular disease beginning in childhood. Circulation. 2003;107(11):1562-6.