Article
Printed in Brazil - ©2013 Sociedade Brasileira de Química0103 - 5053 $6.00+0.00A
*e-mail: [email protected], [email protected]
Electron and Photon Stimulated Ion Desorption from Poly(thiophene)
J. R. Santa Rita,a,b B. G. A. L. Borges,a B. Beck,a Y. Garcia-Basabe,*,a,c L. S. Romand and M. L. M. Rocco*,a,
aInstituto de Química, Universidade Federal do Rio de Janeiro, 21941-909 Rio de Janeiro-RJ, Brazil
bInstituto Federal de Educação, Ciência e Tecnologia, 28030-130 Rio de Janeiro-RJ, Brazil
cDepartment of Physics, Faculty of Engineering, University of Matanzas, 40100 Matanzas, Cuba
dDepartamento de Física, Universidade Federal do Paraná, 81531-990 Curitiba-PR, Brazil
Poli(tiofeno) (PT) foi estudado através de técnicas de dessorção estimulada por elétrons (ESID) e fótons (PSID) acopladas à espectrometria de massas por tempo-de-voo (TOF-MS), a fim de investigar a resposta desse polímero, quando submetido a feixes de elétrons e fótons. Íons atômicos de enxofre e suas contribuições isotópicas foram claramente identificados. A intensidade máxima das curvas de rendimento iônico de ESID foi medida para todos os íons em cerca de 900 eV, estão relacionadas com o processo de ionização do carbono 1s e explicadas em termos do processo Auger. O estudo da influência de elétrons secundários no processo de desorção foi também realizado, o que é altamente importante, uma vez que envolvem níveis mais baixos de energia, afetando as propriedades de interesse de materiais fotovoltaicos. A análise de TOF-PSID de filmes de PT com diferentes espessuras mostrou um aumento na eficiência da dessorção de espécies mais pesadas, como C3HS+. Este resultado foi atribuído aos elétrons secundários originados
nas camadas internas do material.
Poly(thiophene) (PT) was studied by the electron (ESID) and photon (PSID) stimulated ion desorption techniques coupled with time-of-flight mass spectrometry (TOF-MS) in order to investigate the response from this semiconducting polymer when submitted to electron and photon beams. Atomic sulfur ions and its isotopic contributions could be clearly identified. Maximum intensity in the ESID ion yield curves was measured for all ions around 900 eV, which may be related to carbon 1s ionization and explained in terms of the Auger stimulated ion desorption process. The study of the influence of secondary electrons for the desorption process was also investigated, which is highly important, since they involve lower energy levels, affecting the properties of interest of photovoltaic materials. TOF-PSID analysis on PT films with different thicknesses showed an increase in the efficiency to desorb higher mass species, like C3HS+. This
result was attributed to the role of secondary electrons originated in the inner layers of the material.
Keywords: poly(thiophene), semiconducting polymers, electron stimulated ion desorption
(ESID), photon stimulated ion desorption (PSID), secondary electrons
Introduction
Poly(thiophene) (PT) is an important semiconducting polymer that has been extensively applied in many technological applications mainly due to its optical, electrical and redox properties.1,2 These properties allowed
its use in rechargeable batteries,3 organic light-emitting
diodes (OLEDs),4,5 field-effect transistors (FETs),6 solar
cells,7 electronic displays,8 among others.9-11 A clear
comprehension of its properties and relation to its structure is highly desirable, not only to establish a general concept about the behavior of this semiconducting polymer, but also to optimize its optical and electronic properties, which are strongly dependent on regioregularity, molecular weight,
homogeneity and morphology of the film.12 Thus, the
investigation of this class of polymer using spectroscopic techniques greatly contributes to a better understanding of the relationship between structure and properties.
techniques based on the production of fragments (positive and negative), due to the impact of photons or electrons of known energy on a solid surface. The energy transfer process for both techniques occurs solely through electronic transitions.13,14 Previous PSID studies have been performed
on thiophene-based polymers following sulfur K-shell
photoexcitation.15-17 These results showed the importance
of the resonant Auger process for breaking the C-S bond selectively, as well as the normal Auger process for multiple charge species desorption. Ion desorption due to the indirect X-ray induced electron stimulated desorption (XESD) process caused by inelastically scattered low energy secondary electrons was also discussed, motivating new research on poly(thiophene) films, this time using electrons. Besides, this study is also a relevant topic for the fabrication of organic electronic devices, since organic and polymeric films are frequently submitted to electron bombardment during fabrication.
In order to further study the molecular properties of PT, its interaction with electron beams, and evaluate the contribution of secondary electrons to their fragmentation and desorption processes, the ESID technique coupled with time-of-flight mass spectrometry (TOF-MS) was employed. In this work, an ESID study of PT as a function of the electron energy is presented, ranging from 600 up to 2200 eV and using TOF-MS for ion analysis. The PSID technique was also employed aiming to correlate the intensity of desorbed fragments and polymer thicknesses as well as to improve the discussion about secondary electrons.
Experimental
Poly(thiophene) (PT) films were potentiostatically deposited onto fluorine tin oxide glass (FTO) substrates in a model MQPG-01 potentiostat from Microquimica. FTO substrates (10 < R < 20 Ω/sq) were purchased from
Flexitec Eletrônica Orgânica Ltda. The counter electrode was a PT plate and the pseudo-reference electrode was an Ag wire. The films were deposited under a potential of 3 V, with the thickness being controlled by time deposition.
The electrolyte was a 0.02 mol L−1 of (CH
3)4NBF4 in
acetonitrile, which contained 0.1 mol L−1 thiophene
monomer (Aldrich). Over oxidation was checked by cyclic voltammetry experiments on different potentials, indicating
no irreversible damage.18,19 The films were deposited at
room temperature and their thicknesses were measured using a surface profiler Detak3 (Veeco/Sloan) along the step formed between the polymer and FTO, purposely made with a scratch. The thicknesses of the polymer films studied by PSID were 180 ± 10 nm, 470 ± 20 nm and 660 ± 30 nm. The thinnest one was employed for ESID measurements.
ESID experiments were performed using an ultra-high vacuum (UHV) system maintained under pressure
of about 10−9 Torr. The system contains a commercial
XYZ sample holder, an energy variable electron gun, a home-made time-of-flight mass spectrometer (TOF-MS)
for positive and negative ion analysis,20 and a quadrupole
mass spectrometer for the study of neutral species and as a residual gas analyser. The TOF-MS consists basically of an electrostatic ion extraction system, a collimating electrostatic lens, a 25 cm field free drift tube and a pair of microchannel plate (MCP) detectors, disposed in the
chevron configuration.21
The films were irradiated by a pulsed beam of monoenergetic electrons at various energies using a constant potential applied to the sample. Incident electron currents of the order of nanoamperes were used throughout the measurements. The incident beam formed an angle of 60° with respect to the normal to the sample surface, situated about 10 mm away from the first grid of the TOF-MS. The start signal is provided by a pulse generator (80 kHz frequency and 20 ns pulse width), which controls the electron gun. The stop signal corresponds to the detector output, processed using a standard system of counting pulses, consisting of a preamplifier and a discriminator. These signals are sent to a time-to-digital converter (TDC) with a time resolution of 1 ns per channel.
Two constant positive extraction potentials applied to the sample, namely +500 V and +1200 V, were employed for positive ESID ion analysis. This affects the energy of the incident electrons, such that the final electron energy is the sum of the potential difference applied to the sample and the nominal electron beam energy, which was varied from 150 to 1000 eV. ESID spectra were normalized by the number of starts given by the counting pulse card, TDC, and mass calibration was performed through simulations of the ion trajectories and flight times using the SIMION 3D 6.0.14
program.22 All simulations were performed considering that
desorbed species angles are between 0 to 90°, with kinetic energies between 0 to 10 eV. The results were checked through the use of different extraction potentials applied to
the sample and the well-known equation for a linear TOF.23
Photoabsorption, near-edge X-ray absorption fine structure (NEXAFS), and PSID measurements were performed at the Brazilian Synchrotron Light Source (LNLS), during the single-bunch operation mode of the storage ring, with a period of 311 ns and width of 60 ps. The employed soft X-ray spectroscopy (SXS) beamline (790-4000 eV) mounted with a double-crystal type monochromator and using the InSb(111) plane gives
an energy resolution of about 2.8 eV at 4 keV.24 The
The NEXAFS spectra were recorded by measuring the total electron yield, TEY (drain current at sample), mode.
Results and Discussion
ESID analysis
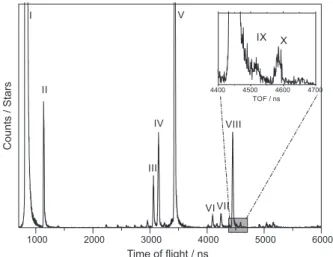
The +1700 eV final electron energy (extraction potential of +1200 V plus nominal electron energy of 500 eV) ESID spectrum of PT is shown in Figure 1. The highest intensity fragments are labeled in roman numerals from I to X. Table 1 presents the most probable ion assignments based on their mass-to-charge ratio conversion.
Peak labeled as I is assigned to H+, which is the most
intense ion, as expected for ESID measurements of organic
samples. H2+ (II) clusters and other less intense peaks
were also detected in this spectrum. Atomic sulfur ions are presented with appreciable intensity meaning that this
energy is appropriate to break the C-S bond. The signal at
m/z = 19 (V in Table 1) is due to the presence of fluorine in
silver paint, used to electrically ground the sample around its edge. A similar result was also reported in the ESID
study of poly(3-hexyl-thiophene).25 Fragments related to
peaks with masses higher than 100 a.m.u are very weak or not detected.
Figure 1 also shows a zoomed area around 4400 ns containing three labeled peaks (VIII, IX and X), which are related to sulfur ion and its isotopes, according to their m/z.
It is well known that the natural isotopic abundances for 32S, 33S and 34S are, respectively, 94.99, 0.75 and 4.25% resulting
in relative abundances of, approximately, 32S/33S = 126.65
and 32S/34S = 22.35.26 Gaussian fitted areas for VIII, IX
and X peaks give, respectively, (1.73 ± 0.046) × 10−4,
(3.96 ± 0.84) × 10−6 and (6.95 ± 0.83) × 10−6. Relative
Gaussian areas are accordingly VIII/IX = 43.68 ± 5.47 and VIII/X = 24.89 ± 5.54. According to this result, it was possible to assign the feature X as 34S isotope. On the
other hand, the feature IX is better assigned to 33SH+ ion.
Such assignment is consistent with the ESID study for
poly(3-hexyl-thiophene) films.25
Figure 2 presents a comparison between ESID spectra for a constant potential of +500 V and nominal electron energies of 300, 400, 700 and 900 eV. It can be observed clearly that there is a relative increase of desorbed ions up to 400 eV nominal energy (900 eV final electron energy),
Table 1. Mass/charge assignment for poly(thiophene) from ESID spectra
Peak TOF / ns m/z Assignment
I 826 1 H+
II 1137 2 H2+
III 3062 15 CH3+
IV 3155 16 S2+ / CH
4+
V 3431 19 F+ / H
3O+
VI 4100 27 C2H3+
VII 4244 29 C2H5+
VIII 4447 32 32S+
IX 4520 33 32SH+
X 4586 34 34S+
Figure 1. ESID spectrum of PT films obtained for positive extraction potential of +1200 V and nominal electron energy of 500 eV, totalling a final energy of +1700 eV. The inset shows atomic sulphur desorptions.
which is followed by a decrease in intensity. Unlike photons, the cross-section for Auger decay process due to electron impact varies between 2-4 times the inner-shell ionization energy.27,28 In this case, C 1s ionization may be
considered to fall at approximately 290 eV and the S edges at approximately 2470, 230 and 170 eV for 1s, 2s and 2p ionizations, respectively. Therefore, the electron energy interval of 600-1500 eV reported in the present study will specifically cover processes at the carbon 1s edge.
Previous ESID studies conducted on poly(methyl
methacrylate) (PMMA),29 and poly(pyrrole) (PPy),30
covered the same electron energy range. They showed also maxima in the ion yield curves, plotted as a function of the electron energy. These results were interpreted in terms of the Auger stimulated ion desorption mechanism after carbon 1s ionization.
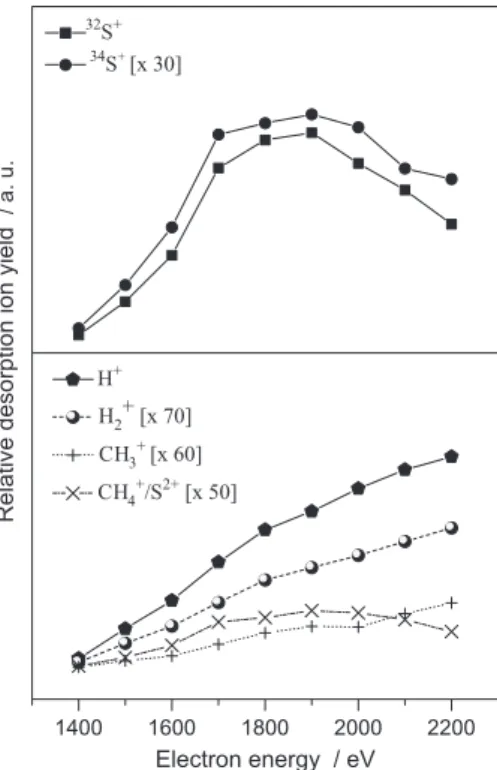
To investigate the influence of the Auger decay on specific peaks of poly(thiophene), the ion yield was calculated by correlating their respective areas (fitted by Gaussian functions), normalized in terms of the total acquisition scans (starts) and plotted as a function of the final electron beam energy. The selected ions were those with higher intensities in the spectra. Figure 3 presents desorption ion yields for selected ions with applied extraction potential of +500 V. The measurements showed clearly a maximum at about 900 eV, which may be assigned to the Auger stimulated ion desorption mechanism at
the C K-edge, reflecting its importance to ion formation
probabilities. At this lower extraction potential, 34S+
desorption peak showed very low intensity and for this reason its desorption yield curve is not present in Figure 3.
The production and consequent interaction of secondary electrons on a solid sample can be broken down into a few steps: first, an energy transfer process occurs between the primary source and sample molecules, producing secondary electrons. Then, these species can be transported through the sample bulk toward the surface and finally escape to solid-vacuum interface or, during the path, they may promote other valence excitation/ionization mechanisms, which will reflect on ESID/PSID yield curves as well as the primary process.13,14
The main difference between primary inner-shell induced desorption and secondary electrons mechanisms is basically the energy-dependent behavior of desorption yield curves for a specific ion, if the radiation source energy increases, it will produce more secondary electrons, increasing the ion desorption yield for all species.15,17,31-36
However, if it takes into account the primary inner-shell desorption mechanism, it will only increase at the absorption edge of the specific element from the sample.
ESID yield curves were also obtained for higher extraction potential of +1200 V, presented in Figure 4. For all fragments, an increase of the ion yield with the increase of the electron energy is observed. This may be explained by the action of secondary electrons, which are
Figure 3. Relative desorption ion yield curves as a function of the electron energy for selected ions in PT film using an extraction potential of +500 V.
intensely produced in the material and may then cause an enhancement of the ion yield for all species.
NEXAFS and PSID analysis
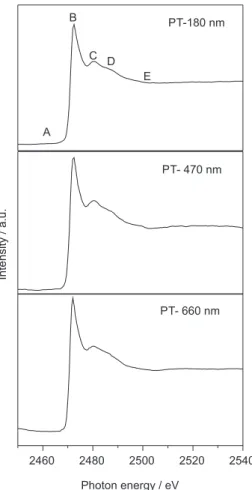
Figure 5 shows NEXAFS spectra for PT films with different thicknesses recorded at the sulphur K-edge and covering the energy range from 2450 to 2550 eV. The spectra show the same features as those assigned previously
by Santa Rita et al.15 The sharp peak (labeled as B) was
ascribed to the overlap of 1s > π* and 1s > σ*(S-C)
transitions, while two broad features labeled as C and D can be ascribed to higher energy excitations, probably
containing Rydberg character.37 The photon energy marked
as B in the NEXAFS spectrum was used for the comparative analysis presented in Figure 6.
The effect of the thickness in desorption mechanism of PT films was investigated by the PSID spectra analysis. For a comparative point of view the TOF-PSID spectra presented in Figure 6 were normalized with respect to the
H+ peak (at 82 ns). The main difference between these
spectra was observed by the peak localized at 158 ns and
assigned as C3HS+ (69 a.m.u.).15 This peak shows the major
increase in its relative intensity for higher thicknesses. This last result suggests an important effect of the film thickness in the production of higher mass ionic fragments.
Similar behavior was reported by Sekiguchi and Baba,38
for Si(CH3)3F physisorbed on metallic Cu(001), which
was interpreted as a reduction of the neutralization effect by the metallic substrate at high film thicknesses. In this case as was reported by Santa Rita et al.,15 C
3HS+species
are originated by the indirect XESD desorption mechanism. Therefore, the increment in the relative intensity of this peak is an evidence of the important role of secondary electrons created in the inner layers for the desorption of higher mass fragments. Desorption ion yield curves were also obtained and studied15.
Conclusions
Poly(thiophene) films were studied by the electron (ESID) and photon (PSID) stimulated ion desorption techniques. ESID spectra present mainly contribution from atomic sulfur ions, including isotopes. Different profiles were measured for the ion yields depending on the electron impact energy. Maximum intensities in the ion yield curves were attributed to the Auger stimulated ion desorption process. At higher energies the ion yields show an accentuated increase, demonstrating the influence of secondary electrons in the desorption process. The comparative analysis of the TOF-PSID spectra for PT films with different thicknesses shows an increase of the desorption of the highest ionic mass fragment. This fact was attributed to the influence of the indirect relaxation process induced by secondary electrons originated in the inner layers.
Figure 5. S K-edge NEXAFS spectra of PT films with different thicknesses.
Acknowledgments
The authors would like to thank National Council for Technological and Scientific Development (CNPq), Brazilian Federal Agency for Support and Evaluation of Graduate Education (CAPES), Brazilian Synchrotron Light Laboratory (LNLS) and Rio de Janeiro Research Foundation (FAPERJ) for financial support.
References
1. Friend, R. H.; Gymer, R. W.; Holmes, A. B.; Burroughes, J. H.; Marks, R. N.; Taliani, C.; Bradley, D. D. C.; dos Santos, D. A.; Brédas, J. L.; Logdlund, M.; Salaneck, W. R.; Nature1999, 397, 21.
2. Xia, Y.; Luo, J.; Deng, X.; Li, X.; Li, D.; Zhu, X.; Yang, W.; Yong, C.; Macromol. Chem. Phys. 2006, 207, 511.
3. Aydin, M.; Esat, B.; Kilic, C.; Kose, M. E.; Ata, A.; Yilmaz, F.;
Eur. Polym. J. 2011, 47, 2283.
4. Kaminorz, Y.; Smela, E.; Johansson, T.; Brehmer, L.; Andersson, M. R.; Inganas, O.; Synth. Met. 2000, 113, 103.
5. Garten, F.; Vrijmoeth, J.; Schlatmann, A. R.; Gill, R. E.; Klapwijk, T. M.; Hadziioannou, G.; Synth. Met. 1996, 76, 85. 6. Nguyen, P. T.; Rammelt, U.; Plieth, W.; Richter, S.; Plotner, M.;
Fischer, W. J.; Kiriy, N.; Potje Kamloth, K.; Adler, H. J.;
Electrochim. Acta 2005, 50, 1757.
7. Borrelli, D. C.; Barr, M. C.; Bulovic, V.; Gleason, K. K.; Sol. Energy Mater. Sol. Cells 2012, 99, 190.
8. Jin, S. H.; Yoo, B. U.; Kang, S. Y.; Gal, Y. S.; Moon, D. K.; Opt. Mater. 2002, 21, 153.
9. Senthilkumar, B.; Thenamirtham, P.; Selvan, R. K.; Appl. Surf. Sci. 2011, 257, 9063.
10. Li, X.; C., L.; Chen, J.; Li, C.; Sun, C.; J. Chromatogr., A 2008,
1198, 7.
11. Tuken, T.; Yazici, B.; Erbil, M.; Prog. Org. Coat. 2005, 53, 38. 12. Brown, P. J.; Sirringhaus, H.; Phys. Rev. B:Condens. Matter
Mater. Phys. 2001, 63, 125204.
13. Williams, E. M.; de Segovia, J. L.; Vacuum 1989, 39, 633.
14. Madey, T. E.; Doering, D. L.; Bertel, E.; Stockbauer, R.;
Ultramicroscopy 1983, 11, 187.
15. Santa Rita, J. R.; Arantes, C.; Araújo, G.; Roman, L. S.; Micaroni, L.; Rocco, M. L. M.; J. Electron Spectrosc. Relat. Phenom. 2011, 184, 265.
16. Araújo, G.; Arantes, C.; Roman, L. S.; Zarbin, A. J. G.; Rocco, M. L. M.; Surf. Sci. 2009, 603, 647.
17. Rocco, M. L. M.; Weibel, D. E.; Roman, L. S.; Micaroni, L.;
Surf. Sci. 2004, 560, 45.
18. Valaski, R.; Canestraro, C. D.; Micaroni, L.; Mello, R. M. Q.; Roman, L. S.; Sol. Energy Mater. Sol. Cells 2007, 91, 684.
19. Tang, H.; Zhu, L.; Harima, Y.; Yamashita, K.; Synth. Met. 2000,
110, 105.
20. Mendes, L. A. V.; Magalhães, S. D.; Arantes, C.; Rocco, M. L. M.; Polym. Degrad. Stab. 2007, 92, 741.
21. Wisa, J. L.; Nucl. Instrum. Methods Phys. Res., Sect. B 1979,
162, 587.
22. Dahl, D. A.; Simion 3D Version 6.0, User’s Manual, Idaho National Engineering Laboratory, 1995.
23. Guilhaus, M.; J. Mass Spectrom. 1995, 30, 1519.
24. Corrêa, M. C.; Tolentino, H.; Craievich, A.; Cusatis, C.; Rev. Sci. Instrum. 1992, 63, 896.
25. Ahn, H.; Oblas, D. W.; Whitten, J. E.; Macromolecules 2004, 37, 3381.
26. de Laeter, J. R.; Bohlke, K. J. R.; de Bièvre, P.; Hidaka, H.; Peiser, H. S.; Rosmas, K. J. R.; Taylor, P. D. P.; Pure Appl. Chem. 2003, 75, 683.
27. Feldman, L.C.; Fundamentals of Surface and Thin Film Analysis, 1st ed.; Prentice Hall: New York, USA, 1986. 28. Netzer, F. P.; Matthew, J. A. D.; Bertel, E.; Spectroscopy of
Surfaces: Advances in Spectroscopy,Wiley:New York, USA,
1988.
29. Rocco, M. L. M.; Weibel, D. E.; Pontes, F. C.; Pinho, R. R.; Faraudo, G. S.; de Souza, G. G. B.; Polym. Degrad. Stab. 2003,
80, 263.
30. Arantes, C.; Rocco, A. M.; Rocco, M. L. M.; J. Electron Spectrosc. Relat. Phenom. 2009, 175, 66.
31. Ueno, N.; Tanaka, K.; J. Appl. Phys. 1997, 36, 7605. 32. Tinone, M. C. K.; Ueno, N.; Maruyama, J.; Kamiya, K.; Harada;
Sekitani, T.; Tanaka, K.; J. Electron Spectrosc. Relat. Phenom.
1996, 80, 117.
33. Rocco, M. L. M.; Faraudo, G. S.; Pontes, F. C.; Pinho, R. R.; Ferreira, M.; de Souza, G. G. B.; Chem. Phys. Lett. 2004, 393,
213.
34. Rocco, M. L. M.; Pontes, F. C.; Faraudo, G. S.; de Souza, G. G. B.; Weibel, D. E.; Pinho, R. R.; Quim. Nova 2004, 27, 160. 35. Rocco, M. L. M.; Faraudo, G. S.; Pontes, F. C.; Pinho, R. R.;
Ferreira, M.; de Souza, G. G. B.; Braz. J. Phys. 2006, 36, 534. 36. Weibel, D. E.; Rocco, M. L. M.; Pontes, F. C.; Ferreira, M.; de
Souza, G. G. B.; Polym. Degrad. Stab. 2006, 91, 712. 37. Hitchcock, A. P.; Horsley, J. A.; Stöhr, J.; J. Chem. Phys. 1986,
85, 4835.
38. Sekiguchi, T.; Baba, Y.; Surf. Sci. 1999, 433, 849.