Article
J. Braz. Chem. Soc., Vol. 24, No. 10, 1669-1678, 2013. Printed in Brazil - ©2013 Sociedade Brasileira de Química 0103 - 5053 $6.00+0.00
A
*e-mail: [email protected]
Individual and Simultaneous Square Wave Voltammetric Determination of the
Anticancer Drugs Emodin and Irinotecan at Renewable Pencil Graphite Electrodes
Yassien M. Temerk* and Hossieny S. M. Ibrahim
Chemistry Department, Faculty of Science, Assiut University, Assiut, Egypt
Um método versátil e com rápida sensibilidade para a determinação individual e simultânea das drogas anticancerígenas emodina (Em) e irinotecano (Irino) em fluidos biológicos baseados na voltametria de onda quadrada (SWV) utilizando um eletrodo de grafite de lápis renovável (PGE), foi investigado. A acumulação adsortiva controlada de Em e Irino na superfície PGE foi explorada para a determinação de traços de drogas anticancerígenas em fluidos biológicos. Sob as condições experimentais otimizadas como o pH do eletrólito suporte, potencial e tempo de acumulação e parâmetros eletroquímicos, curvas de calibração para análise de traços de Em e Irino individualmente e simultaneamente, mostraram uma excelente resposta linear. Os limites de detecção 5,17 × 10⁻¹⁰ e 1,68 × 10⁻⁹ mol L−1 de Em e Irino foram obtidos usando SWV em um
PGE, respectivamente. Os resultados obtidos mostraram boa estabilidade, reprodutibilidade, repetibilidade e alta recuperação para a determinação de traços das duas drogas em fluidos biológicos. A análise estatística e os dados da curva de calibração para determinação de traços de Em e Irino individualmente, bem como, simultaneamente, são relatados.
A rapid sensitive and versatile method for the individual and simultaneous determination of the anticancer drugs emodin (Em) and irinotecan (Irino) in biological fluids based on the square wave voltammetry (SWV) using a renewable pencil graphite electrode (PGE) was investigated. Controlled adsorptive accumulation of both Em and Irino on the PGE surface was exploited for trace determination of the anticancer drugs in biological fluids. Under the optimized experimental conditions such as supporting electrolyte pH, accumulation potential and time and electrochemical parameters, calibration curves for trace assay of Em and Irino individually and simultaneously showed an excellent linear response. Limits of detection of 5.17 × 10⁻¹⁰ and 1.68 × 10⁻⁹ mol L−1
Em and Irino in bulk form were achieved using SWV at a PGE, respectively. The obtained results showed good stability, reproducibility, repeatability and high recovery to assay of two drugs in biological fluids. The statistical analysis and the calibration curve data for trace determination of Em and Irino individually as well as simultaneously are reported.
Keywords: emodin, irinotecan, voltammetry, drug analysis, biological fluids
Introduction
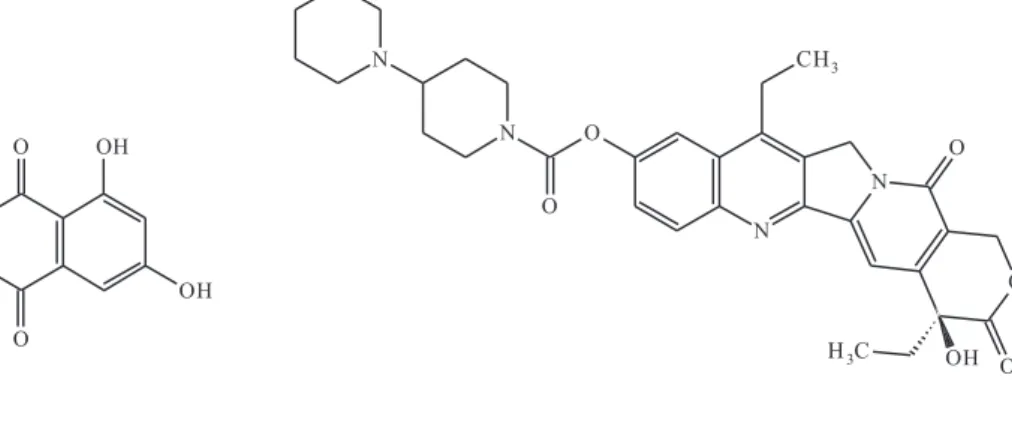
The antitumoral activity of emodin (1,3,8-trihydroxy-6-methyl-anthraquinone) and irinotecan {7-ethyl-10-[4-(1-piperidino) 1-piperidino] carbonyloxy camptothecin} (Figure 1) against certain types of cancers was previously reported.1−5 In this context, emodin (Em) drug has a
specific antineuroectodermal tumor activity in vitro and in vivo.6 It suppresses tyrosine kinase activity in
HER-2/neu over expressing breast cancer cells, and mainly represses the transformation phenotypes of these cells, acting as a tyrosine kinase inhibitor; furthermore; it can
hit androgen receptors directly suppressing cell growth in prostate cancer.7,8 Irinotecan (Irino) was widely used for the
treatment of colorectal cancer, refractory cervical cancer and other gynecological cancers.9
Because emodin and irinotecan are being increasingly used for therapeutic purposes, their determination and quality control are of a vital importance. Many methods for determining Em and Irino drugs were reported, such as chromatographic,10−21 spectrofluorimetric,22
chemiluminescent,23,24 spectroscopic25-30 and electrochemical
techniques.31−39 To the best of our knowledge, individual and
of Em and Irino, this work was aimed to develop a simple and a sensitive electrochemical method based on square wave cathodic adsorptive stripping voltammetry using a PGE for individual and simultaneous determination of the anticancer drugs Em and Irino in biological fluids.
In the current work renewable pencil graphite electrode (PGE) is used for the individual and simultaneous determination of Em and Irino using Osteryoung square wave voltammetry procedure. The proposed methodology is simple and does not generate hazardous chemical wastes, thus it is easily possible to be used in control analysis of Em and Irino in biological fluids. The developed method permits the screening of the two anticancer drugs in a single voltammetric run with high accuracy and precision.
Experimental
Instrumentation
Square-wave voltammetry was performed using an EG&G PAR 384 B polarographic analyzer controlled by the 394 software. The electrode system consisted of the pencil graphite working electrode, a Ag/AgCl (3 mol L−1 NaCl)
reference electrode (Model RE-1, BAS), and a platinum counter electrode. A rotring pencil Model Tikky special 0.5 mm (Germany) was used as a holder for the pencil lead (rotring, 2B, 0.5 mm diameter, Germany). Electrical contact with lead was achieved by soldering a metallic wire to the metallic part that holds the lead in place inside the pencil. The pencil was fixed vertically with 6 mm of the pencil lead extracted outside and 3 mm of the lead pencil immersed in the solution. Prior to experiments, the electrochemical treatment of PGE was achieved by the potential cycling between 0.4 V and −1.4 V with scan rate
50 mV s−1 for5 scans in blank Britton-Robinson buffer. The
treated PGE was washed with deionized water and stored at room temperature in vacuum desiccator until its use.
Details of the pencil electrode were described earlier.40 For
voltammetric measurements, the test solution was placed in a polarographic cell (10 mL) and deoxygenated by bubbling nitrogen for 15 min to remove any oxygen to a level not interfering with the voltammetry to cathodic potentials.
Chemicals and reagents
Emodin and irinotecan were obtained from sigma (U.S.A) and used without purification. Stock solutions of Em and Irino were prepared by dissolving a required weight of chemically pure product in a specific volume of deionized water. As a supporting electrolyte, a series of Britton-Robinson (BR) buffer of pH 2-11, a mixture of 0.04 mol L−1 of each acetic, orthophosphoric and boric
acids adjusted to the required pH with 0.2 mol L−1 sodium
hydroxide was prepared. The BR buffer was brought to a constant ionic strength by the addition of 0.5 mol L−1 NaX
(X = Cl−, NO
3−, SO42−). The pH values of the buffer solutions
were measured with a digital radiometer pH meter, Jenway 3310 accurate to ± 0.5 unit. All chemicals were reagent grade (E. Merck Darmstadt). Deionized water was used to prepare the solutions.
Urine and serum treatment
Human urine and serum samples were taken from healthy donor and used shortly after collection. Urine samples were centrifuged and filtered before use. A 0.9 mL aliquot of the serum sample was treated with 2 mL methanol as serum-protein precipitating agent. The precipitated proteins were separated out by centrifugation for 20 min at 1400 rpm using tabletop high speed centrifuge TDZ4A-WS. The clear supernatant layer was filtered through 0.45 µm millipore filter to obtain a protein-free spiked human serum samples. The standard addition method was then applied, adding successive concentrations of the investigated drug.
Results and Discussion
Voltammetric behavior of Em and Irino individually and in a combined mixture
The electrochemical behaviour of Em and Irino on a pencil graphite electrode was studied in BR buffer solutions in the presence of different anions such as NO3−, Cl− and
SO42− using square wave voltammetry. The maximum
responses for the electroreduction of Em and Irino in BR buffer at different pH values containing 0.5 mol L−1 NO
3−
indicate that NO3− exhibits lower tendency for specific
adsorption and less adsorption forces on the electrode surface(Figure 2). The recorded SWV peaks of Em at various pH values in the potential range of 0.0 to −1.0 V
are mainly due to the direct reduction of the anthraquinone moiety.41 Voltammograms, obtained for Irino, in BR buffer
solutions are attributed to the electroreduction of the lactone moiety of camptothecin to a lactol ring.42
The peak potential (EPC) shifted linearly to more
negative values on the increase of pH of the medium according to the equations 1 and 2:
EPC(V) = −0.046 pH −0.37 (R
2 = 0.997) for Em (1)
EPC(V) = −0.062 pH −0.78 (R2 = 0.999) for Irino (2)
The peak height is clearly dependent on pH and maximum response for Em was found at pH 5.0 whereas pH 3.0 for Irino gave concentration sensitive peak height compared to media with other pH values.
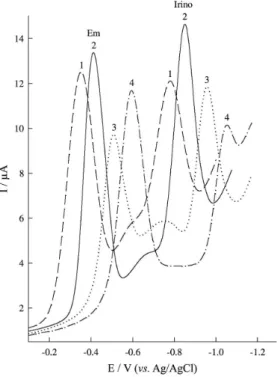
The electrochemical responses when Em and Irino co-exist using the pencil graphite electrode were investigated. Figure 3 shows square wave voltammograms for a mixture solution of Em and Irino in solutions of different pHs in order to obtain the best cathodic peak resolution (∆EPC)
and maximum sensitivity in mixture solution of two drugs. The results of SWV indicate that the electroreduction of the two drugs in combined mixtures depend on pH of the solution and the reduction peaks shifted to more negative potential with increasing pH value. Two well-defined peaks are observed at pH 3.0 corresponding to the adsorption and reduction of the two drugs in the combined mixture.
The reduction of Em in the combined mixture at pH 3.0 showed well-defined peak at –0.41 V (vs. Ag/AgCl saturated KCl) while that of Irino indicated a cathodic peak at −0.85 V in BR buffer of the same pH. The peak
position of Em and Irino in a mixture might be attributed to different electrochemical activity of their functional groups on the electrode surface. According to the presented results, the best peak separation can be achieved at pH 3.0
which permits the limits of detection and quantitation for simultaneous determination of both drugs. This means that the cathodic peaks generated for both drugs in BR of pH 3.0 are well potentially separated and therefore the SWV form using a PGE is a suitable mode for the voltammetric assay of the two drugs in a mixture. The EPC for both drugs
in a mixture has linear relationship with pH of the buffer solution regarding following equations 3 and 4:
EPC(V) = −0.048 pH −0.28 (R
2 = 0.998) Em in a mixture (3)
EPC(V) = −0.055 pH −0.68 (R2 = 0.997) Irino in a mixture (4)
The peak potential of the two drugs in the binary mixtures using a PGE was dependent on pH and shifted to more negative potential with increasing of pH.
Selection of electrochemical parameters
The influence of electrochemical parameters known to affect SWV, viz pulse height, frequency and scan increment were studied. In the investigation process for assay of Em and Irino separately or in a combined mixture, each variable was changed while the other two were kept constant. The variables of interest were studied over the range of 10-60 mV of pulse height, 20-120 Hz of frequency and 2-10 mV of scan increment. Table 1 indicates the optimum obtained values which reflect voltammograms of relatively high sensitivity and well-shaped waves with relatively narrow peak width.
Effect of accumulation parameters
The effect of varying accumulation potential (Eacc)
on the bulk current of the square wave voltammograms for the assay of both investigated drugs individually or in a combined mixture was evaluated. Maximum peak heights were achieved at accumulation potentials of +0.4 V
and −0.75 V for the individual assay of Em and Irino,
respectively, whereas at +0.4 V for the detection of Em
and Irino in a combined binary mixture.
Moreover, dependence of the accumulation time of the two drugs individually or in a combined mixture was studied. Such time dependent profiles represent the corresponding adsorption isotherms as the peak current depends on the amount accumulated. As in all type of
stripping measurements, the choice of accumulation time requires a trade off between sensitivity and speed. At a relative longer accumulation time an equilibrium surface concentration is reached and the peak height became then constant. The rising part corresponds to the diffusion controlled adsorption and the plateau part represents the full coverage of the electrode surface. The optimized accumulation time should be chosen according to the concentration level for assay of Em and Irino drugs separately, or in a combined mixture. Preconcentration time of 5 min was arbitrary adopted at the concentration range of 10−8
−10−7 mol L−1 to determine the Em and the Irino
drugs individually or in a combined mixture throughout this work as compromise between high sensitivity and short analysis time.
Determination of Em and Irino individually
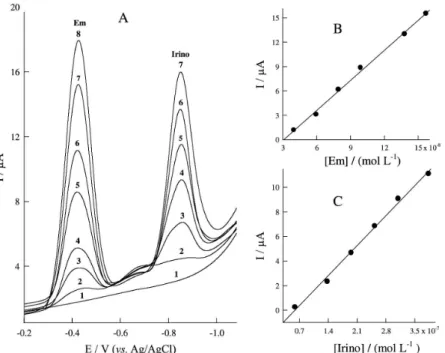
For determination of anticancer drugs Em and Irino individually the best results were obtained using SWV, as indicated by figures of merit such as detection limit and sensitivity (Figure 4). The plot of the peak reduction current vs. Em or Irino concentration was linear in the concentration range 3.98 × 10⁻⁸ to 2.34 × 10⁻⁷ mol L−1
for Em and 7.94 × 10⁻⁸ to 4.03 × 10⁻⁷ mol L−1 for Irino, at
optimum values of experimental conditions (Table 1). The variation of ip (µA) with concentration of the investigated drug is represented by the straight line equation ip = aC + b
Figure 3. SW voltammograms of a mixture of 9.62 × 10⁻⁷ mol L−1 Em and 2.88 × 10⁻⁶ mol L−1 Irino at different pH values: (1) pH 2, (2) pH 3, (3) pH 5 and (4) pH 7. Other conditions are the same as in Figure 2.
Table 1. The optimum solution, instrumental and adsorption parameters for the assay of Em and Irino drugs individually and in a combined mixture using SWV at a PGE
Parameters Em Irino Binary mixture of Em and Irino
pH 5 3 3
Pulse height / (mVpp) 60 80 60
Frequency / Hz 120 100 120
Scan increment / mV 6 6 4
Accumulation potential / V 0.4 –0.75 0.4
Accumulation time / min 5 5 5
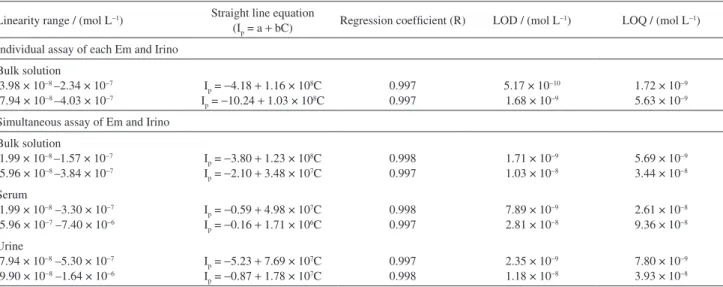
where a and b are the slope and the intercept of straight line respectively. The data for three to five replicated measurements are subject to a least square refinement and the values of the regression coefficient (R) are computed and assembled together with the straight line constant. The calibration curve data for assay each of Em and Irino drugs in bulk solution are cited in Table 2.
The limits of detection (LOD) and quantitation (LOQ) for both drugs individually were calculated using the relation kS.D/b (where k = 3 for LOD and 10 for LOQ, S.D is the standard deviation of the intercept and b is the slope of calibration curve).43 The LOD and LOQ for the
investigated drugs were estimated and reported in Table 2, their values confirming the sensitivity of the proposed procedure for the determination of Em and Irino drugs by SWV using a PGE.
T h e o b t a i n e d l i m i t o f d e t e c t i o n f o r E m (5.17 × 10⁻¹⁰ mol L−1) using SWV at a PGE is quite lower
compared with data reported previously at glassy carbon electrode (1.6 × 10⁻⁷ mol L−1 , 7.8 × 10⁻⁹ mol L−1),31,34
multi-walled carbon nanotube modified glassy carbon electrodes (3.0 × 10⁻⁷ mol L−1),35 graphene modified
electrode (3.0 × 10⁻⁹ mol L−1)36 carbon paste electrode
(3.0 × 10⁻⁹ mol L−1),37 carbon-coated nickel magnetic
nanoparticles modified glassy carbon electrode (2.08 × 10⁻⁹ mol L−1),38 flow injection chemiluminescence
(7.4 × 10⁻¹⁰ mol L−1),24 fluorescence emission spectra
(1.26 × 10⁻⁶ mol L−1),28 resonance light scattering
(3.81 × 10⁻⁸ mol L−1)29 and resonance Rayleigh light
scattering technique (5.55 × 10⁻⁹ mol L−1).30 An improved
detection limit was also achieved for determination of the anticancer Irino (1.69 × 10⁻⁹ mol L−1) at a PGE using SWV
than one obtained by HPLC method (2.41 × 10⁻⁸ mol L−1,
4.01 × 10⁻⁹ mol L−1).12,14
In order to evaluate the accuracy and precision for the proposed method, analysis of Em and Irino drugs at three levels of low, moderate and high concentration of the calibration curve was carried out to seven independent series of the same day (Intra-day) and performed at the same level on seven different days (Inter-day). The average % RSD of intra-day and inter-day precision was 0.43% and 0.61% for Em and 1.11% and 1.113% for Irino, respectively. The mean amount (%) of analyte recovered in the assay was 99.15-100.63% for Em and 98.73-101.44% for Irino. The results demonstrated that the values were within the acceptable range and that the SWV method using a PGE was both accurate and precise for the trace determination of each Em and Irino.
Simultaneous determination of Em and Irino
The square wave curves presented peak reduction potential at −0.41 V for Em and −0.85 V for Irino;
this good peak potential separation of about 440 mV clearly allows the simultaneous determination of the two investigated drugs. To further investigate the electrochemical response when both substances are present in solution, square wave curves were obtained in the presence of a large excess of Em or Irino in the BR buffer solution (pH 3.0). The separate determination of Em in the concentration range 1.99 × 10⁻⁸ to 1.57 × 10⁻⁷ mol L−1
was accomplished in solution containing Irino at fixed concentration of 3.10 × 10⁻⁷ mol L−1 (Figure 5). On the
other hand, the separate determination of Irino in the
Table 2. Characteristics of the calibration curves for individual and simultaneous determination of Em and Irino in bulk solutions and human urine and blood serum samples using SWV at a PGE
Linearity range / (mol L−1) Straight line equation
(Ip = a + bC) Regression coefficient (R) LOD / (mol L−1) LOQ / (mol L−1)
Individual assay of each Em and Irino
Bulk solution
a3.98 × 10−8 –2.34 × 10⁻⁷ b7.94 × 10−8 –4.03 × 10⁻⁷
Ip = −4.18 + 1.16 × 10⁸C Ip = −10.24 + 1.03 × 10⁸C
0.997 0.997
5.17 × 10⁻¹⁰ 1.68 × 10⁻⁹
1.72 × 10⁻⁹ 5.63 × 10⁻⁹
Simultaneous assay of Em and Irino
Bulk solution
a1.99 × 10−8 –1.57 × 10⁻⁷ b5.96 × 10−8 –3.84 × 10⁻⁷
Ip = −3.80 + 1.23 × 10⁸C Ip = −2.10 + 3.48 × 10⁷C
0.998 0.997
1.71 × 10⁻⁹ 1.03 × 10⁻⁸
5.69 × 10⁻⁹ 3.44 × 10⁻⁸
Serum
a1.99 × 10−8 –3.30 × 10⁻⁷ b5.96 × 10−7 –7.40 × 10⁻⁶
Ip = −0.59 + 4.98 × 10⁷C Ip = −0.16 + 1.71 × 10⁶C
0.998 0.997
7.89 × 10⁻⁹ 2.81 × 10⁻⁸
2.61 × 10⁻⁸ 9.36 × 10⁻⁸
Urine
a7.94 × 10−8 –5.30 × 10⁻⁷ b9.90 × 10−8 –1.64 × 10⁻⁶
Ip = −5.23 + 7.69 × 10⁷C Ip = −0.87 + 1.78 × 10⁷C
0.997 0.998
2.35 × 10⁻⁹ 1.18 × 10⁻⁸
7.80 × 10⁻⁹ 3.93 × 10⁻⁸
concentration range 5.96 × 10⁻⁸ to 3.84 × 10⁻⁷ mol L−1
was achieved in solution containing Em at the fixed concentration of 1.00 × 10⁻⁷ mol L−1 (Figure 6). A current
of Em increases regularly as its concentration is increased at a fixed concentration of Irino (its peak reduction current remains constant). Similarly, as shown in Figure 6, the peak reduction current of Irino increases regularly as its concentration increases at a fixed concentration of Em (its peak reduction current remains constant).
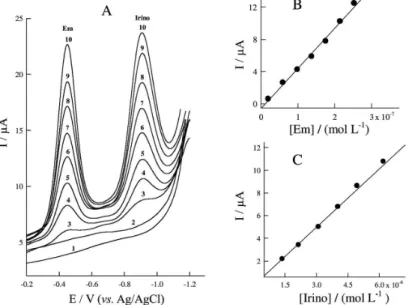
After this previous study, Em and Irino were determined by simultaneous changing their concentrations under the optimum conditions. Figure 7 shows the square wave voltammograms obtained for solution containing Em and Irino in BR buffer solution at pH 3.0, the concentration of Em and Irino increases synchronously in increasing the concentration of two drugs. It can be seen that the peak currents for the two drugs in the combined mixture increase linearly with their concentrations. The calibration curves for Em and Irino present good linear responses in the concentration range 10−8 to 10−7 mol L−1 (R ≤ 0.998).
The corresponding calibration equations and the limits of detection and quantitation are given in Table 2. The lower values of detection limits of Em and Irino in a combined mixture indicate that the simultaneous determination of Em and Irino can be considered as efficient as their separate determinations.
Repeatability (intra-day) of the proposed method was tested for the two drugs in a combined mixture containing lower, middle, and higher concentrations in the linear range. The intermediate precision (inter-day) of the method was evaluated by considering lower, middle, and higher concentrations in linear range in three days. The average % RSD of intra-day and inter-day precision was 1.18% and 1.72% for Em and 1.92% and 4.21% for Irino, respectively. The values obtained for the recoveries (97.22-105.79%) are within limits regarded as acceptable for analysis of biological samples. The aforementioned results for both, intra and inter-day precision and accuracy are within the acceptance criteria.
Effect of foreign ions
The effect of several types of many interfering species on the determination of Em and Irino drugs individually or in a combined mixture was examined and listed in Table 3. The presence of the investigated metal ions at concentration of 3.98 × 10⁻⁷ mol L−1 and
1.38 × 10⁻⁶ mol L−1, respectively, invoked a visible decrease
of the analyte reduction peak. At 3.98 × 10⁻⁷ mol L−1 of
Mg2+, Pb2+, Cd2+, Ca2+, Ba2+, Co2+, Ni2+ and Zn2+ the peak height of Em and Irino separately and in a combined mixture decreased by 1.87%, 0.78-2.18%, 0.68-3.27%, 1.53-3.88%, 1.43-3.81%, 0.83%, 1.56% and 3.54%, respectively. The recovery of Em and Irino separately
Figure 5. SW voltammograms of Em at different concentrations in presence of 3.1 × 10⁻⁷ mol L−1 Irino at pH 3.0; [Em]: 1) Blank solution, 2) 1.99 × 10⁻⁸ mol L−1, 3) 3.98 × 10⁻⁸ mol L−1, 4) 5.96 × 10⁻⁸ mol L−1, 5) 7.94 × 10⁻⁸ mol L−1, 6) 9.90 × 10⁻⁸ mol L−1, 7) 1.38 × 10⁻⁷ mol L−1M and 8) 1.57 × 10⁻⁷ mol L−1; accumulation potential, 0.4 V; accumulation time, 5 min; scan increment, 4 mV; frequency, 120 Hz and pulse height, 60 mVpp.
or in a combined mixture was evaluated by comparing the peak current of analyte reduction in absence and presence of interfering metal ions. The aforementioned result could be explained in terms of the formation of complexes between the interfering metal ions and the investigated drugs in solution. In this case, competitive
adsorption of these complexes would decrease the response of reduction of both drugs. In addition, organic molecules could additionally interfere with simultaneous determination of Em and Irino if they adsorbed on the surface of the PGE electrode or if they are electroactive with a reduction potential close to that of the investigated
Figure 7. (A) SW voltammograms for simultaneous determination of Em and Irino in bulk solutions at pH 3.0, Em concentrations: 1) Blank solution, 2) 1.99 × 10⁻⁸ mol L−1, 3) 3.98 × 10⁻⁸ mol L−1, 4) 5.96 × 10⁻⁸ mol L−1, 5) 7.94 × 10⁻⁸ mol L−1, 6) 9.90 × 10⁻⁸ mol L−1, 7) 1.38 × 10⁻⁷ mol L−1, 8) 1.57 × 10⁻⁷ mol L−1, and Irino concentrations: 1) Blank solution, 2) 5.96 × 10⁻⁸ mol L−1, 3) 1.38 × 10⁻⁷ mol L−1, 4) 1.96 × 10⁻⁷ mol L−1, 5) 2.53 × 10⁻⁷ mol L−1, 6) 3.10 × 10⁻⁷ mol L−1, 7) 3.84 × 10⁻⁷ mol L−1, other conditions are the same as in Figure 5; (B) Plot of I
p as a function of Em concentration; (C) Plot of Ip as a function of Irino concentration.
Table 3. Influence of some metal ions on the degree of recovery for individual and simultaneous determination of Em and Irino separately and in a combined mixture using SWV at a PGE
Metal Ions Concentration of metal ions / (mol L−1)
Degree of recovery / %
Em and Irino separately Binary mixture of Em and Irino
Em Irino Em Irino
Cd(II) 3.98 × 10⁻⁷
1.38 × 10⁻⁶
99.32 96.39
96.73 94.25
98.21 93.49
97.45 94.23
Ca(II) 3.98 × 10⁻⁷
1.38 × 10⁻⁶
97.18 95.27
96.15 92.38
98.47 92.73
97.18 95.64
Ba(II) 3.98 × 10⁻⁷
1.38 × 10⁻⁶
96.22 92.58
96.19 93.23
98.57 94.46
97.27 94.18
Mg(II) 3.98 × 10⁻⁷
1.38 × 10⁻⁶
98.36 97.59
100.0 99.21
99.21 97.65
98.13 96.47
Pb(II) 3.98 × 10⁻⁷
1.38 × 10⁻⁶
99.21 98.24
98.34 96.18
98.77 97.19
97.82 95.37
Co(II) 3.98 × 10⁻⁷
1.38 × 10⁻⁶
98.27 95.58
100.0 100.0
99.21 98.28
99.17 96.83
Ni(II) 3.98 × 10⁻⁷
1.38 × 10⁻⁶
100.0 98.57
100.0 98.77
99.58 97.24
98.44 96.59
Zn(II) 3.98 × 10⁻⁷
1.38 × 10⁻⁶
100.0 96.68
96.46 94.17
99.22 97.54
Figure 8. (A) SW voltammograms for different concentrations of Em and Irino drugs spiked in human serum samples, Em concentrations: 1) Blank solution, 2) Serum, 3) 1.99 × 10⁻⁸ mol L−1, 4) 5.96 × 10⁻⁸ mol L−1, 5) 9.90 × 10⁻⁸ mol L−1, 6) 1.38 × 10⁻⁷ mol L−1, 7) 1.76 × 10⁻⁷ mol L−1, 8) 2.15 × 10⁻⁷ mol L−1, 9) 2.53 × 10⁻⁷ mol L−1, 10) 3.3 × 10⁻⁷ mol L−1, and Irino concentrations: 1) blank solution, 2) Serum, 3) 5.96 × 10⁻⁷ mol L−1, 4) 1.38 × 10⁻⁶ mol L−1, 5) 2.15 × 10⁻⁶ mol L−1, 6) 3.10 × 10⁻⁶ mol L−1, 7) 4.03 × 10⁻⁶ mol L−1, 8) 4.94 × 10⁻⁶ mol L−1, 9) 6.19 × 10⁻⁶ mol L−1, 10) 7.4 × 10⁻⁶ mol L−1, other parameters are as those indicated in Figure 5; (B) Plot of Ip as a function of Em concentration; (C) Plot of Ip as a function of Irino concentration.
drugs. Phenylalanine, alanine, oxalic acid, glutaric acid and ascorbic acid were added to solutions containing Em and Irino in a combined mixture to test their influence on square wave response. The peak height for the reduction of both Em and Irino in a combined mixture decreases by 3-11% in the presence of the aforementioned substances at concentration levels of 5 × 10⁻⁷ mol.L−1. Triton X-100 was
added to the solution as a model surfactant. The percentage of recovery of the analyte response was decreased by 15% in the presence of 0.5 mg L−1 Triton X-100. Interference
of foreign ions as a result of decreased sensitivity of analyte signal can be overcome to so extent by means of the standard addition of the investigated drugs.
Analytical applications
Individual and simultaneous analysis of Em and Irino in human blood serum
The optimized analytical procedure was applied for assay of Em and Irino drugs individually and simultaneously in human serum samples. Representative stripping voltammograms for, simultaneous assay of Em and Irino drugs spiked in human serum samples with the method of standard additions were illustrated in Figure 8. The two reduction peaks at −410 mV and −850 mV were
obtained corresponding to the electroreduction of Em and Irino, respectively and were used as a detection signal for assay of the investigated drug in serum sample. The variation of the peak current vs. the concentration of Em and Irino drugs individually and in a combined mixture
was represented by straight lines (R ≤ 0.998) and the results were summarized in Table 2. The mean percentages recoveries of 95% and 97% were achieved for Em and Irino respectively in human blood serum samples. The aforementioned results indicate that the electrochemical renewal of PGE is efficient and insures the reproducibility of individual and simultaneous measurement of anticancer drugs in serum samples.
Individual and simultaneous analysis of Em and Irino in human urine
Figure 9. (A) SW voltammograms for different concentrations of Em and Irino drugs spiked in human urine samples, Em concentrations: 1) Blank solution, 2) Urine, 3) 7.94 × 10⁻⁸ mol L−1, 4) 1.18 × 10⁻⁷ mol L−1, 5) 2.72 × 10⁻⁷ mol L−1, 6) 3.47 × 10⁻⁷ mol L−1, 7) 4.39 × 10⁻⁷ mol L−1, 8) 5.30 × 10⁻⁷ mol L−1, and Irino concentrations: 1) Blank solution, 2) Urine, 3) 9.90 × 10⁻⁸ mol L−1, 4) 2.91 × 10⁻⁷ mol L−1, 5) 6.78 × 10⁻⁷ mol L−1, 6) 8.71 × 10⁻⁷ mol L−1, 7) 1.26 × 10⁻⁶ mol L−1, 8) 1.64 × 10⁻⁶ mol L−1, other parameters are as those indicated in Figure 5; (B) Plot of I
p as a function of Em concentration; (C) Plot of Ip as a function of Irino concentration.
Conclusions
The developed SWV procedure using inexpensive PGE provides a convenient and efficient method for individual and simultaneous trace determination of anticancer drugs Em and Irino without generation of hazardous wastes. The practical application of SWV method using a PGE is demonstrated by individual and simultaneous analysis of these anticancer drugs in human urine and blood serum. This work opens a new possibility in the application of the stripping performance at a PGE to a simultaneous analysis of more than two anticancer drugs which affect cell division or DNA synthesis.
Acknowledgments
The authors express their gratitude to the Alexander von Humboldt foundation Bonn-Germany for the financial support of this work.
References
1. Chen, Y. C.; Shen, S. C.; Lee, W. R.; Hsu, F. L.; Lin, H. Y.; Ko, C. H.; Tseng, S. W.; Biochem. Pharmacol. 2002, 64, 1713.
2. Chan, T. M.; Leung, J. K. H.; Tsang, R. C.; Liu, W. Z. H.; Li, L. S.; Yung, S.; Kidney Int.2003, 64, 519.
3. Houghton, P. J.; Cheshire, P. J.; Hallman, J. C.; Bissery, M. C.; Boue, A. M.; Houghton, J. A.; Cancer Res.1993, 53, 2823.
4. Potmesil, M.; Cancer Res.1994, 54, 1431.
5. Kunimoto, T.; Nitta, K.; Tanaka, T.; Uehara, N.; Baba, H.; Takeuchi, M.; Yokokura, T.; Sawada, S.; Miyasaka, T.; Mutai, M.; Cancer Res.1987, 47, 5944.
6. Pecere, T.; Gazzola, M. V.; Mucignat, C.; Parolin, C.; Dalla, V. F.; Cavaggioni, A.; Basso, G.; Diaspro, A.; Salvato, B.; Carli, M.; Palu, G.; Cancer Res.2000, 60, 2800.
7. Duncan, M. A.; Russell, C.; Patel, S.; Patel, R.; Int. Immunopharmacol.2004, 4, 1775.
8. Huang, Q.; Shen, H. M.; Ong, C. N.; Biochem. Pharmacol.
2004, 68, 361.
9. Gerrits, C. J.; De Jonge, M. J.; Schellens, J. H.; Stoter, G.; Verweij, J.; Br. J. Cancer1997,76, 952.
10. Singh, N. P.; Gupta, A. P.; J. Chromatogr., A2005, 1077, 202.
11. Yang, X.; Zeping, H.; Chan, S. Y.; Goh, B. C.; Duan, W.; Chan, E.; Zhou, S.; J. Chromatogr., B: Anal. Technol. Biomed. Life Sci.2005, 821, 221.
12. Ragot, S.; Marquet, P.; Lachatre, F.; Rousseau, A.; Lacassie, E.; Gaulier, J. M.; Dupuy, J. L.; Lachatre, G.; J. Chromatogr., B: Biomed. Sci. Appl.1999, 736, 175.
13. Escoriaza, J.; Aldaz, A.; Castellanos, C.; Calvo, E.; Giraldez, J.;
J. Chromatogr., B: Biomed. Sci. Appl. 2000, 740, 159. 14. Bansal, T.; Awasthi, A.; Jaggi, M.; Khar, R. K.; Talegaonkar, S.;
Talanta 2008, 76, 1015.
15. Ramesh, M.; Ahlawat, P.; Srinivas, N. R.; Biomed. Chromatogr.
2010, 24, 104.
16. Corona, G.; Elia, C.; Casetta, B.; Toffoli, G.; Ther. Drug Monit.
17. Baylatry, M. T.; Joly, A. C.; Pelage, J. P.; Bengrine-Lefevre, L.; Prugnaud, J. L.; Laurent, A.; Fernandez, C.; J. Chromatogr., B: Anal. Technol. Biomed. Life Sci. 2010,878, 738.
18. Liu, W.; Zheng, Z.; Liu, X.; Gao, S.; Ye, L.; Yang, Z.; Liu, M. H. Z.; J. Pharm. Biomed. Anal. 2011, 54, 1157.
19. Mandrioli, R.; Mercolini, L.; Ferranti, A.; Fanali, S.; Raggi, M. A.; Food Chem.2011, 126, 387.
20. Goldwirt, L.; Lemaitre, F.; Zahr, N.; Farinotti, R.; Fernandez, C.;
J. Pharm. Biomed. Anal. 2012, 66, 325.
21. Chen, X.; Peer, C. J.; Alfaro, R.; Tian, T.; Spencer, S. D.; Figg, W. D.; J. Pharm. Biomed. Anal. 2012, 62, 140.
22. Caceres, M. I. R.; Meras, I. D.; Soto, N. E. O.; Alba, P. L. L.; Martınez, L. L.; Talanta2008, 74, 1484.
23. Yingying, S.; Wang, J.; Chen, G.; Talanta2006, 68, 883. 24. Zhang, Y.; He, X.; Song, Z.; J. Spectrosc. 2012, 27, 73. 25. Sevilla, P.; Rivas, J. M.; García-Blanco, F.; García-Ramos, J. V.;
Sánchez-Cortés, S.; Biochim. Biophys. Acta2007, 1774, 1359. 26. Shuyun, B.; Zhang, H.; Chunyu, Q.; Sun, Y.; Liu, C.;
Spectrochim. Acta, Part A2008, 69, 123.
27. Hernandez, M.; Recio, G.; Martin-Palma, R. J.; Garcia-Ramos, J. V.; Domingo, C.; Sevilla, P.; Nanoscale Res. Lett.2012, 7, 364.
28. Ma, L.; Zhu, X.; Spectrochim. Acta, Part A2012, 95, 246. 29. Xiang, H.; Luo, Q.; Dai, K.; Duan, W.; Fan, Y.; Xie, Y.;
Spectrochim. Acta, Part A2012, 96, 874.
30. Bi, S.; Wang, Y.; Wang, T.; Pang, B.; Zhao, T.; Spectrochim. Acta, Part A2013, 101, 233.
31. Wang, L.; Zhang, Z.; Baoxian, Y.; Electrochim. Acta2006, 51, 5961.
32. Zhihong, Y.; Junan, L.; Fei, J.; Mao, X.; Gao, P.; Ding, Y.; Anal. Lett. 2005, 38, 1641.
33. Norouzi, P.; Qomi, M.; Nemati, A.; Ganjali, M. R.; Int. J. Electrochem. Sci. 2009, 4, 1248.
34. Yingying, S.; Jian, W.; Guonan, C.; Talanta2006, 68, 883. 35. Zhao, H. Y.; Qiao, X.; Yi, T.; Qiu, J. Z.; Jiu, H. Y.; Yuan, D. Z.;
Bioelectrochemistry 2008, 72, 155.
36. Juan, L.; Jinghua, C.; Xiao, L. Z.; Chun, H. L.; Huang, H. Y.;
Talanta2010, 83, 553.
37. Yan, W.; Huayu, X.; Xiuhua, Z.; Shengfu, W.; Microchim. Acta
2010, 169, 255.
38. Chunli, B.; Lin, Z.; Huayu, X.; Xiuhua, Z.; Shengfu, W.;
Electroanalysis 2010, 22, 1.
39. Li, J.; Chen, J.; Zhang, X. L.; Lu, C. H.; Yang, H. H.; Talanta
2010, 83, 553.
40. Wang, J.; Kawde, A.; Sahlin, E.; Analyst2000, 125, 5. 41. Zhu, Z. W.; Li, N. Q.; Microchem. J.1998, 59, 294. 42. Du, W.; Tetrahedron2003, 59, 8649.
43. Ferreira, V. S.; Zanoni, M. V. B.; Fogg, A. G.; Anal. Chim. Acta
1999, 384, 159.
Submitted: April 18, 2013

![Figure 6. SW voltammograms of Irino at different concentrations in presence of 1 × 10 −7 mol L −1 Em at pH 3.0; [Irino]: 1) Blank solution, 2) 5.96 × 10 −8 mol L −1 , 3) 1.38 × 10 −7 mol L −1 , 4) 1.96 × 10 −7 mol L −1 , 5) 2.53 × 10 −7 mol L −1 ,](https://thumb-eu.123doks.com/thumbv2/123dok_br/18997172.462568/6.892.124.358.306.665/figure-voltammograms-irino-different-concentrations-presence-irino-solution.webp)