Artigo
*e-mail: [email protected]
#Programa de Pós-Graduação em Produtos Naturais e Sintéticos Bioativos
CHEMICAL CONSTITUENTS ISOLATED FROM Turnera subulata Sm. AND ELECTROCHEMICAL CHARACTERIZATION OF PHAEOPHYTIN B
Severino Gonçalves de Brito Filhoa,#, Marianne Guedes Fernandesa,#, Otemberg Souza Chavesa,#, Maria Célia de Oliveira Chavesa,#, Felipe Bastos Ararunac, Carla Eirasc, José Roberto de Souza de Almeida Leitec, Maria de Fátima Agraa,#, Raimundo Braz-Filhob and Maria de Fátima Vanderlei de Souzaa,*,#
aCentro de Ciências da Saúde, Universidade Federal da Paraíba, João Pessoa – PB, Brasil
bLaboratório de Ciências Químicas, Universidade Estadual do Norte Fluminense Darcy Ribeiro, 28013-602, Campos dos Goytacazes – RJ, Brasil//Departamento de Química, Universidade Federal Rural do Rio de Janeiro, Seropédica – RJ, Brasil
cCentro de Pesquisa em Biodiversidade e Biotecnologia, Campus de Parnaíba, Universidade Federal do Piauí, Parnaíba – PI, Brasil
Recebido em 14/10/2013; aceito em 13/12/2013; publicado na web em 27/03/2014
Turnera subulata Sm., known as “Chanana” or “flor-do-Guarujá” in Brazilian folklore, is a plant species belonging to the
subfamily Turneroideae of family Passifloraceae, which is used for various medicinal purposes in Brazil. The phytochemical study conducted here led to the isolation and identification of ten compounds present in T. subulata: two mixtures of steroids, sitosterol and stigmasterol (nonglycosylated and glycosylated); a mixture of flavonoids, 5,7,4′-trihidroxiflavona-8-C-α-glucopyranoside and 5,7,3′,4′-tetrahidroxiflavona-8-C-α-glucopyranosidel; and four phaeophytins, phaeophytin purpurin-18-phytyl ester, a rare natural product, phaeophytin a, 132-hydroxy-(132-S)-phaeophytin a, and phaeophytin b. Phaeophytin b exhibited electrochemical activity similar to that of phthalocyanines.
Keywords: Turneroideae; Turnera subulata;Phaeophytins.
INTRODUCTION
According to Thulin et al.,1 the Turneroideae family, in its tradi-tional sense, comprises 10 genera and approximately 200 species that now are included in a widely circumscribed Passifloraceae family. In Brazil, this family is represented by approximately 80 species belonging two genera, Piriqueta and Turnera, found mainly in areas of savannas and rocky fields.2
Turnera species are recognized by their herbaceous shrub habit.3 Species of these genera have been used to cure various diseases, arousing the curiosity of natural-product researchers. They are characterized by the presence of terpenoids, flavonoids, steroids, benzenoids, alkaloids, and lipids.3
The aqueous extract of Turnera diffusa Willd. exhibited aphro-disiac activity in male rats, which was best evidenced by the ability of impotent male rats performance of sexual intercourse.4 The anti--inflammatory activity of Turnera ulmifolia L. was tested in rats and mice using the crude hydroalcoholic extract of aerial parts and the ethyl acetate and dichloromethane fractions. Both the extract and the fractions were observed to inhibit edema induced by carragenine.5
Turnera subulata Sm., known as “Chanana” or “flor-do- Guarujá,” is a herbaceous, shrubby plant with simple leaves; its flowers are white with yellow or orange petals that may or may not be stained at the base. T. subulata Sm. is a South American species whose roots have been used medicinally in Brazilian folk medicine for the treatment of amenorrhea.3 In this work, we isolated steroids, flavonoids, and phaeophytins from T. subulata Sm.
EXPERIMENTAL
Instruments and reagents
NMR spectra (1H, 13C, HSQC, HMBC, COS, and NOESY) were acquired on a Varian Mercury spectrometer operated at 200 (1H) and 50 MHz (13C) (LMCA/UFPB) (substances 1, 2, 3, 5, 6, 7, and 8) and on another Varian Mercury instrument operated at 500 (1H ) and 125 MHz (13C) (LMCA/UFPB) (compound 4). The NMR data were measured in CDCl3, CD3OD, and C5D5N; the chemical shifts were expressed in ppm relating to the solvent signal. Medium-pressure liquid chromatography (MPLC) was performed using a BUCHI (Switzerland) C-615 pump manager. The spectra in the infrared region were obtained on a Perkin-Elmer FT–IR-1750 using 0.001–0.003 g of sample compacted into a KBr disk. The absorptions were recorded in wavenumbers (cm−1).
Plant materials
The aerial parts of Turnera subulata Sm. were collected at Campus I of the Universidade Federal da Paraíba (UFPB), munici-pality of João Pessoa, and State of Paraíba, and they were identified by botanist Profª. Drª. Maria de Fátima Agra. The voucher specimen Agra & Barbosa 6273 is deposited at the Herbarium Professor Lauro Pires Xavier (JPB) of UFPB.
Extraction, fractionation, and isolation of the chemical constituents
was concentrated in a rotatory evaporator, yielding 604.42 g of crude ethanol extract (CEE).
A 300.0 g portion of the CEE was dissolved in a EtOH:H2O (7:3) solution. The water–alcohol solution was sequentially partitioned with hexane, chloroform, ethyl acetate, and n-butanol. The obtained solutions were concentrated in a rotatory evaporator under reduced pressure, yielding 107.6 g of the hexane phase, 12.8 g of the chlo-roform phase, 12.3 g of the ethyl acetate phase, and 20.8 g of the n-butanol phase.
The hexane phase of the CEE (50.0 g) was subjected to vacuum filtration using silica gel 60 (Merck) 7734 (70–230 mesh) as a sta-tionary phase supported by a Büchner funnel with a porous plate. Hexane, hexane:EtOAc (9:1; 7:3; 1:1), and EtOAc were used as eluents. The fractions were concentrated in a rotary evaporator under reduced pressure, yielding 11.7 g (hexane), 5.0 g (hexane:EtOAc 9:1), 5.7 g (hexane:EtOAc 7:3), 2.7 g (hexane:EtOAc 1:1), and 11.3 g (EtOAc).
The EtOAc fraction (5.0 g) of the hexane phase of the CEE was subjected to column chromatography using silica gel 60 (Merck) 7734 (70–230 mesh) as a stationary phase and hexane, EtOAc, and MeOH (as pure or binary mixtures with an increasing gradient of polarity) as eluents. From this column, 250 25-mL fractions were collected, concentrated under vacuum, and analyzed by thin layer chromato-graphy (TLC) according to their retention factors.Fractions 01/67 and 68/86 each provided a precipitate as well as a supernatant. The mixture of precipitates 01/86 (116.4 mg) from the collected fractions present in the crystalline form exhibited a melting point of 137 °C. The precipitate 01/86 was labeled as compound 1.
The hexane:EtOAc 7:3 fraction (5.7 g) of the hexane phase of the CEE from T. subulata was subjected to column chromatography using silica gel 60 (Merck) 7734 (70-230 mesh) as an adsorbent and hexane, dichloromethane (CH2Cl2), and MeOH (pure or binary mixtures with increasing gradient polarity) as eluents. From this column, 250 40.0-mL fractions were collected, concentrated on a rotary evaporator, and grouped according to their TLC analyses. Sub-fraction 132/250 (3.0 g) was subjected to a second column chro-matographic separation using the previous methodology. From this column, we collected 262 20.0-mL fractions, concentrated them on a rotary evaporator, and analyzed them by TLC. Sub-fraction 186/262 (2.0 g) collected from the previous column was subjected to another column chromatographic separation using silica gel as the adsorbent 60 (Merck) and hexane, dichloromethane (CH2Cl2), and MeOH (pure or in binary mixtures) as the eluents. From this column, we collected 69 25-mL fractions, concentrated each fraction a rotary evaporator, and analyzed them by TLC. Fraction 03/04 (0.0106 g), which was a dark purple amorphous solid, was subjected to 1H and 13C NMR spectroscopy; this fraction was subsequently labeled as compound 2.
The n-butanol phase (20.8 g) was subjected to column chroma-tography using Amberlite XAD-2 as the stationary phase and H2O, H2O:MeOH 7:3 and 1:1, MeOH, hexane, acetone, and EtOAc as the eluents. The fractions obtained with H2O were concentrated in a rotary evaporator under reduced pressure, lyophilized and analyzed by TLC. The H2O: MeOH (1:1) fraction consisted of yellow crystals with a melting point of 168.2–170.5 °C, which was subsequently labeled as compound 3.
A 300-g aliquot of the crude ethanolic extract was subjected to fractionation using hexane, chloroform, and methanol,6 which resulted in three fractions that after being concentrated in a rotary evaporator, it provided three residues: hexane (8.36 g), chloroform, (15.82 g), and methanol (207.9 g).
The previously obtained chloroform residue (12.0 g) was sub-jectedto filtration under reduced pressure in a Büchner funnel using silica gel 60 as the stationary phase and acetate and hexane (pure or
as binary mixtures) as eluents. Seven fractions were obtained from this filtration.
The hexane:EtOAc (8:2) fraction (0.9849 g) obtained through the filtration of the chloroform residue from the CEE was subjected to MPLC using silica flash as the stationary phase and hexane, ethyl acetate, and methanol (pure or as binary mixtures) as the mobile phase, which resulted in 150 15-mL fractions. These fractions were concentrated on a rotary evaporator and analyzed by TLC. Sub-fraction 23/49 (0.096 g) was subjected to preparative TLC and eluted with hexane:EtOAc (9:1), which resulted in 0.026 g of a dark green amorphous solid; this solid was labeled as compound 4.
The 7:3, 1:1, and 3:7 hexane:EtOAc fractions obtained through the filtration of the CEE chloroform residue were combined accor-ding to their TLC retention times, which resulted in 2.2137 g that was chromatographedusing a silica gel 60 column and eluted with hexane, EtOAc, and MeOH (pure or as binary mixtures); 181 fractions were collected and analyzed by TLC. Sub-fraction 29/41 (0.034 g) was subjected to preparative TLC and eluted withhexane:EtOAc (85:15). A dark green amorphous solid (0.0161 g) was obtained and labeled as compound 5.
The EtOAc fraction (0.6682 g) obtained from the filtration of the chloroform residue of the CEE of the aerial parts of Turnera subu-lata Sm. was subjected to column chromatography on a column of Sephadex LH-20 and was eluted with MeOH. Ten 10-mL fractions were collected, concentrated on a rotary evaporator, and analyzed by TLC. Sub-fraction 7/10 was recrystallized in MeOH:CHCl3 (1:1) to yield 0.0076 g of a white amorphous solid, which was labeled as compound 6.
The methanolic residue of CEE of the aerial parts of Turnera subulata Sm. (5.0 g) was subjected to chromatography on a silica gel 60 column and eluted with a mixture of CHCl3, MeOH, and H2O using the method described by Zhao.6 We obtained 96 75-mL frac-tions and analyzed each by TLC. Sub-fraction 15/18 (0.109 g) was subjected to chromatography on a fresh silica column using hexane, CHCl3, and MeOH as eluents; we obtained 59 25-mL fractions and analyzed them using the same methodology previously described. Sub-fraction 18/20 (0.0123 g) was an amorphous yellow–brown solid and was labeled as compound 7.
Electrochemical characterization of phaeophytin b
Phaeophytin b was electrochemically characterized using cyclic voltammetry (CV). The voltammograms were collected using a potentiostat/galvanostat (Autolab PGSTAT 128N) and a 10.0-mL three-electrode electrochemical cell containing a silver wire as a quasi-reference electrode (Ag-QRE) and two platinum plates (each with a surface area of 2.0 cm2) as auxiliary and working electrodes. All the experiments were performed under an inert N2 atmosphere at room temperature in acetonitrile (ACN, Aldrich) containing 0.01 mol L−1 of lithium perchlorate (LiClO
4, Aldrich) as an electrolyte; the scan rate was 50 mV s−1. The phaeophytin b was solubilized in ACN and added to the cell in aliquots of 10 µL.
UV–VIS spectroscopy
The absorption spectra of phaeophytin b in ACN solution were obtained using a Shimadzu UV spectrophotometer.
RESULTS AND DISCUSSION
Structural characterization of substances 1 and 6
at 2958 and 2866 (C-sp3), 3417 (OH), and 1375 cm−1 (C–O). The spectral data, along with comparisons to the literature data,7 allowed us to identify compound 1 as a mixture of the steroids β-sitosterol (1A) and stigmasterol (1B) and compound 6 (Figure 1) as a mixture of the steroids sitosterol-3-O-D-glucopyranoside (6A) and
stigmasterol-3-O-β-D-glucopyranosoide (6B).7
Structural characterization of mixture 3
The IR spectrum (KBr) of compound 3 (Figure 1)exhibited ab-sorptions at 2990 and 2831 (C-sp 3), 3394 (OH), and 1654 cm−1 (C=O). The 1H and 13C NMR spectra of compound 3 exhibited absorp-tions consistent with a flavonoid. The existence of only one singlet at δH 6.28 with integration to one hydrogen was attributed to H-6 skeletal flavonoids with an oxygen moiety on carbons C-5 and C-7 of ring A. Two doublets at δH 5.03 (J = 2.5 Hz) and δH 5.01 (J = 2.0 Hz), which were assigned to anomeric hydrogen atoms, allowed us to hypothesize that 3 contained two osidic units. Signals at δH 6.27, 6.60, 6.91, 7.51, and 7.56 corroborated the hypothesis that 3 was a mixture of two substances; these substances are flavonoids, which we coded as 3A and 3B. A more detailed analysis of the 1H NMR spectrum led to the hypothesis that 3B differs from 3A with respect to the substitution pattern of ring B. This hypothesis was supported by the presence of two doublets at δH 6.91 and δH 7.56 with an in-tegration for one hydrogen each, thereby indicating ortho coupling (J = 8.5 Hz) and meta coupling (J = 2.0 Hz), respectively, and by a double doublet at δH 7.51 that also integrated for hydrogen with ortho coupling (J = 8.5 Hz) and meta coupling (J = 2.0 Hz). The 13C NMR spectrum obtained using the APT technique supported the hypothesis based on the 1H NMR data that 3 was a mixture of two flavonoid glycosides; the 13C NMR spectrum exhibited 38 signals for 42 carbon atoms, 27 of which were attributed to the flavonoid
carbon nuclei of 3A and 3B and 11 of which were attributed to the two glucose units (Table 1).
The 1H x-13C NMR–HMBC spectra allowed the proposed shift to be unambiguously assigned to hydrogen and carbon substance 3A through the correlations of two and three bonds between them. The system AA′BB′ was confirmed by further interactions: correlations to three bonds (3J
CH) between hydrogen atoms 2′ and 6′ (δH 7.98) and carbon C-4′ (δC 161.39) and between hydrogen atoms 3′ and 5′ (δH 6.94) and carbon C-1′ (δC 122.21). Ring A of 3A and 3B was defi-ned by 3J
CH correlations between hydrogen H-6 and carbon C-8 and between hydrogen atoms H-3 and H-6 and carbon C-10, in addition to 2J
CH correlations observed between hydrogen H-3 and carbon C-2 and between hydrogen H-6 and carbon C-5 (Table 1).
A comparison of the 1H and 13C NMR (1D and 2D) spectral data and the data reported in the literature8-10 allowed 3A to be identified as 5,7,4′-trihidroxiflavona-8-C-α-glucopyranoside (apigenin-8-C-α-glucopyranoside) and 3B to be identified as 5,7,3′,4′- tetrahidroxiflavona-4′-8-C-α-glucopyranoside (vitexina) (Table 1). The occurrence of these flavonoids in the genera Turnera is reported here for the first time.
Structural characterization of compounds 2, 4, 5, and 7
The IR spectra (KBr) of compounds 2, 4, 5, and 7 exhibited absorptions at 2926 (C-sp3), 3435 (OH or NH), and 1377 cm−1 (CN); these results are consistent with the presence of a porphyrin nucleus in these compounds.
The 1H and 13C NMR–APT spectra of compound 4 (Figure 1) exhibited the necessary diagnostic peaks for this compound to be identified as a phaeophytin. The resonances of the methyl groups atC-7, C-2, and C-12 appeared as sharp singlets at δH 3.21, 3.40, and 3.82, respectively. Hydrogen atoms H-5, H-10, and H-20 were
Table 1. 1H and 13C NMR (CD
3OD, 500 and 125 MHz) HSQC/HMBC spectral data for 3 HSQC
HMBC
3A 3B
δC δH δC δH 2J CH 3J CH
C
2 165.40 - 165.36 H-3
3 102.33 6.53 (s) 102.28 6.60 (s)
4 182.29 - 182.77
-5 161.35 - 161.35 - H-6
6 98.48 6.28 (s) 98.42 6.27 (s)
7 162.79 - 162.78
-8 104.32 - 104.28 - H-1” H-6
9 156.56 - 156.53 - H-1”
10 104.64 - 104.16 - H-3; H-6
1’ 122.21 - 122.72 - H-3’/H-5, ’H-5’
2’ 128.72 7.98 (d, J= 9.0 Hz) 115.38 7.56 (d, J=2.0Hz)
3’ 115.73 6.94 (d, J=9.0 Hz) 145.65 - H-5’
4’ 161.39 - 149.54 - H-2’/H-6’, H-6’
5’ 115.73 6.94 (d, J=9.0 Hz) 115.61 6.91 (d, J=8.5 Hz) 6’ 128.72 7.98 (d, J=9.0 Hz) 119.57 7.51 (dd, J=8.5; 2.0 Hz) 1’’ 76.73 5.01 (d, J=2.0 Hz ) 76.73 5.03 (d, J=2.5 Hz) 2’’ 72.37 4.26 (dd, J=8.5; 2.0 Hz) 72.32 4.24 (dd, J= 8.5; J=2.5 Hz)
3’’ 80.29 3.60 80.22 3.60
4’’ 70.76 3.61 70.58 3.61
5’’ 81.50 3.44 (m) 81.47 3.44 (m)
6’’ 61.78 3.86 (m)
3.82 (m)
observed as sharp singlets at δH 9.38, 9.53, and 8.58, respectively, in the 1H spectrum. A vinyl group was present at C-3, as indicated by the H-31 double doublet at δ
H 7.98 (J = 17.81 and 11.51 Hz) coupled trans, cis, and geminate with H-32δ
H 6.28 (d-J = 17.81 Hz) and δH 6.17 (dd-J = 11.51 and 1.0 Hz), respectively. An ethyl group was observed to be present at C-8. The methylene group at C-81 appeared as a large singlet at δH 3.68, and the methyl group at C-8
2 occurred as a triplet at δH 1.69 (J = 7.55 Hz). Similar to phaeophytin a, compound 4 has a five-membered ring in position 13. A keto group was observed at C-131, as indicated by the fully substituted carbon resonance at δ
C 189.51. The signals at δH 6.27 (H-13
2), δ
C 169.49 (C-13 3), and δ
C 52.86 (C-134), through comparison with the literature data,11,12 showed that compound 4 corresponds to phaeophytin a (Figure 1).
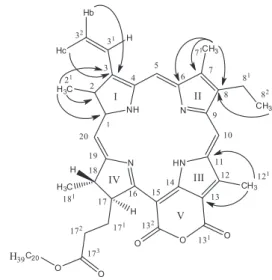
The hydrogen and carbon assignments of compounds 2 (Figure 2), 5, and 7 (Figure 1) are similar to those of compound 4 (Tables 2 and 3), consistent with compounds 2, 5, and 7 containing a porphyrin nucleus.
The similarity between the spectral data of compounds 4 and 5 (Tables 2 and 3), the absence of signals at δH 6.25 (H-13
1) and δc 88.96 (C-132) in the spectra of compound 5, which were present in the spectra of compound 4, in combination with the literature data13 allowed us to conclude that 5 is 132-hydroxy-(132-S)-phaeophytin a.
The suggestion that 7 may be related to phaeophytin a was ex-cluded by the absence of a singlet at approximately δH 3.20 for the methyl group (CH3-7
1) characteristic of phaeophytin a and by the lack of protection experienced by H-5 in 7 (δC 10.36) compared with H-5 in 4 and 5that generate signals at δH 9.38 and δH 9.54, respectively. This lack of protection of 7 was caused by a diamagnetic anisotropy site due to the presence of an aldehyde carbonyl at position C-71 (δ
C 11.38). Analysis of the 13C NMR spectra using the APT technique
corroborated the structure suggested by the 1H NMR results, where the molecule has an aldehyde group at δC 187.77 (C-7
1), consistent with the resonance of the C=O group of phaeophytin b. Other spectral data were compared with those of Schwikkard et al.11
The 1H NMR of spectrum compound 2 contained signals char-acteristic of a substance containing a porphyrin nucleus, as indicated by the presence of three methyl groups attached to an aromatic ring [δH 3.75 (H-12
1), δ
H 3.34 (H-2 1), and δ
H 3.15 (H-7
1)], three olefinic hydrogen signals [δH 9.60 (H-10), δH 9.39 (H-5), and δH 8.64 (H-20)], and a vinyl group [δH 6.21 (H-3
2b), δ
H 6.29 (H-3 2c), and δ
H 7.87 (H-31)]. The APT spectrum allowed us to establish the structure as a six-membered cyclic anhydride, allegedly present between carbons C-15 and C-13 in the E ring, with two carbonyl signals at δC 159.32 (C-131) and δ
C 164.11 (C-13 2). The two- (2J
CH) and three-bond ( 3J
CH) HMBC two-dimensional heteronuclear correlation spectra showed a 3J correlation of the hy-drogen signals at δH 6.29 (Hb-3
2c) and δ
H 6.21 (C-3
2b) with the carbon signal at δC 137.70 (C-3) and also of the H-8
2 signal at δ
H 1.63 with the C-8 carbon at δC 145.91. These correlations allowed us to unam-biguously define positions 3 and 8 as the locations of the vinyl and ethyl groups, respectively. The 2J
CH correlation between the hydrogen atoms of the methyl groups and the sp2 C were also established by the HMBC experiment: δH 3.34 (H-2
1) with δ
C 131.75 (C-2) and δH 3.15 (H-71) with δ
C 136.57 (C-7). The spectra also revealed correlations of the three bonds (3J
CH) between the hydrogen at δH 3.34 (H-2
1) and the carbons at δC 144.05 (C-1) and δC 137.70 (C-3), between the hydrogen at δH 3.15 (H-7
1)and the carbons at δ
C 156.22 (C-6) and δC 145.91 (C-8), and between the hydrogen at δH 3.75 (H-12
1) and the carbons at δC 131.46 (C-11) and δC 111.43 (C-13) (Figure 2).
The relative configurations at C-17 and C-18 were determined as trans on the basis of spatial interactions of the H-17 (δH 5.22) with the methyl δH 1.76 (H-18
1) observed through the NOESY spectrum. The other signals were compared with literature data,14,15 which allowed 2 to be identified as phaeophytin purpurin-18-phytyl ester.
Compounds 2, 4, 5, and 7 are substituted with a phytyl ester at C-173 (Table 3) according to a comparison with the data reported by Melos et al.16 and by Tomaz.12 These compounds were isolated for the first time from species of Turnera and Turneroideae, whereas compound 3 was first isolated from the genera Turnera.
The occurrence of pheophytins in plants has been well established to result from the decomposition of chlorophyll, and different types of solvents are known to affect the physicochemical and spectroscopic proprieties of these macrocyclic compounds.17
Figure 2. Compound 2 isolated from Turnera subulata Sm. andsome
corre-lations observed in the HMBC (Jn) spectral data
Electrochemical characterization of phaeophytin b
Several electrochemical experiments were conducted to determine the optimum conditions. Different organic solvents, electrolyte salts, potential ranges, electrode materials, and scan rates were studied until the voltammogram depicted in Figure 3 was obtained. During the forward (oxidative) scan, the cyclic voltammogram ofphaeophytin b revealed two oxidation processes (at −0.67 and +1.55 V vs. Ag-QRE), and during the reverse (reductive) scans, we observed three reduction processes (+0.028, −0.42, and −0.92 V vs. Ag-QRE). A description of the species related to each process will require a more detailed investigation.
The reproducibility, reversibility, and stability of the electroche-mical response of phaeophytin b allowed us to construct an energy diagram18-20 by obtaining the ionization potential (IP), electron affinity (EA), and gap energy (Eg). The IP and EA determine the interfacial
energy barrier between the electrode and the electroactive molecule and are usually used to optimize the performance of electronic devices. These parameters (IP, EA, and Eg) are typically estimated from the electrochemical potentials, as demonstrated by Micaroni et al.19 The high value obtained for the HOMO energy, shown in the schematic diagram of Figure 4, suggests that a positive potential must be applied for the oxidation of phaeophytin b at the electrode surface. This result agrees with previously reported results related to phthalocyanines.20
These results allow us to affirm that phaeophytin b, extracted from Turnera subulata Sm., possesses a macrocyclic ring structure very similar to those of phthalocyanines, which are materials used in the construction of optical-electronic devices used in photodyna-mic therapy and, especially in the development of electrochephotodyna-mical biosensors.18-20
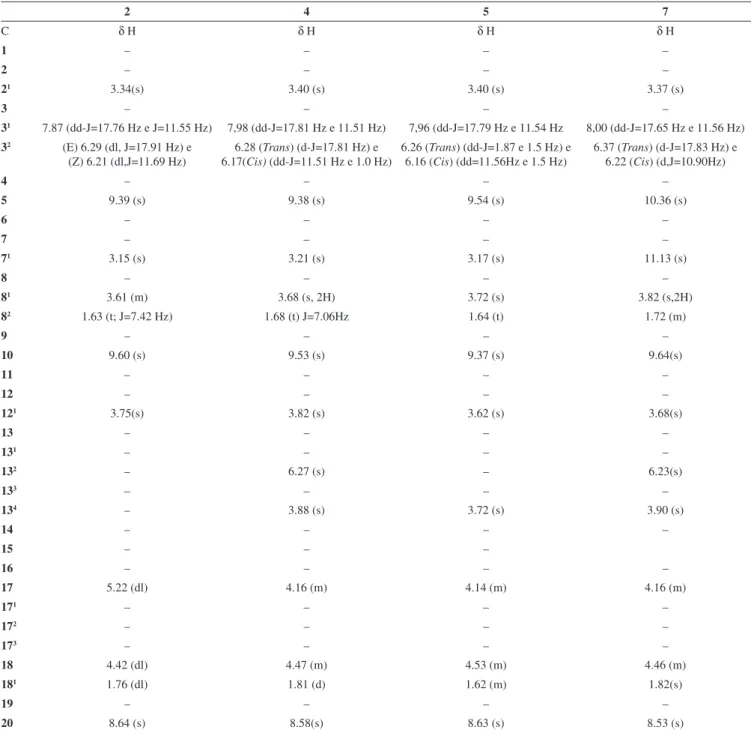
Table 2. 1H NMR data for compounds 2, 5, and 7 (δ, CDCl
3, 200 MHz) and for compound 4 (δ, CDCl3, 500 MHz)
2 4 5 7
C δ H δ H δ H δ H
1 – – – –
2 – – – –
21 3.34(s) 3.40 (s) 3.40 (s) 3.37 (s)
3 – – – –
31 7.87 (dd-J=17.76 Hz e J=11.55 Hz) 7,98 (dd-J=17.81 Hz e 11.51 Hz) 7,96 (dd-J=17.79 Hz e 11.54 Hz 8,00 (dd-J=17.65 Hz e 11.56 Hz)
32 (E) 6.29 (dl, J=17.91 Hz) e
(Z) 6.21 (dl,J=11.69 Hz)
6.28 (Trans) (d-J=17.81 Hz) e 6.17(Cis) (dd-J=11.51 Hz e 1.0 Hz)
6.26 (Trans) (dd-J=1.87 e 1.5 Hz) e 6.16 (Cis) (dd=11.56Hz e 1.5 Hz)
6.37 (Trans) (d-J=17.83 Hz) e 6.22 (Cis) (d,J=10.90Hz)
4 – – – –
5 9.39 (s) 9.38 (s) 9.54 (s) 10.36 (s)
6 – – – –
7 – – – –
71 3.15 (s) 3.21 (s) 3.17 (s) 11.13 (s)
8 – – – –
81 3.61 (m) 3.68 (s, 2H) 3.72 (s) 3.82 (s,2H)
82 1.63 (t; J=7.42 Hz) 1.68 (t) J=7.06Hz 1.64 (t) 1.72 (m)
9 – – – –
10 9.60 (s) 9.53 (s) 9.37 (s) 9.64(s)
11 – – – –
12 – – – –
121 3.75(s) 3.82 (s) 3.62 (s) 3.68(s)
13 – – – –
131 – – – –
132 – 6.27 (s) – 6.23(s)
133 – – – –
134 – 3.88 (s) 3.72 (s) 3.90 (s)
14 – – – –
15 – – –
16 – – – –
17 5.22 (dl) 4.16 (m) 4.14 (m) 4.16 (m)
171 – – – –
172 – – – –
173 – – – –
18 4.42 (dl) 4.47 (m) 4.53 (m) 4.46 (m)
181 1.76 (dl) 1.81 (d) 1.62 (m) 1.82(s)
19 – – – –
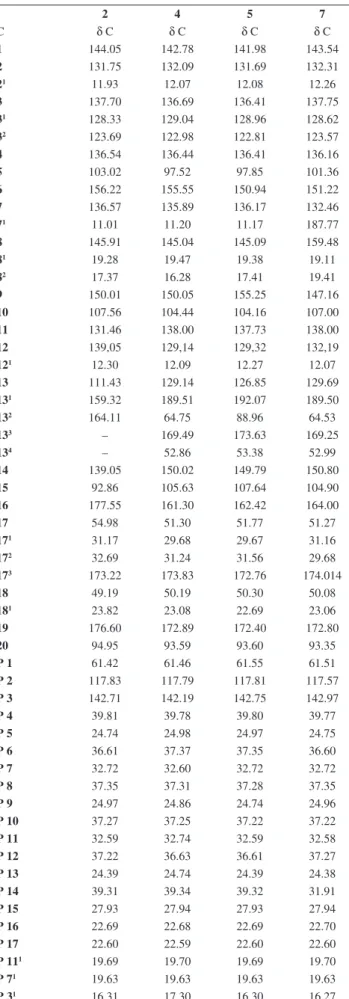
Table 3. 13C NMR spectral datafor compounds 2, 5, and 7 [50 MHz, CDCl 3,
δ (ppm)] and 4 [125 MHz, CDCl3, δ (ppm)]
2 4 5 7
C δ C δ C δ C δ C
1 144.05 142.78 141.98 143.54
2 131.75 132.09 131.69 132.31
21 11.93 12.07 12.08 12.26
3 137.70 136.69 136.41 137.75
31 128.33 129.04 128.96 128.62
32 123.69 122.98 122.81 123.57
4 136.54 136.44 136.41 136.16
5 103.02 97.52 97.85 101.36
6 156.22 155.55 150.94 151.22
7 136.57 135.89 136.17 132.46
71 11.01 11.20 11.17 187.77
8 145.91 145.04 145.09 159.48
81 19.28 19.47 19.38 19.11
82 17.37 16.28 17.41 19.41
9 150.01 150.05 155.25 147.16
10 107.56 104.44 104.16 107.00
11 131.46 138.00 137.73 138.00
12 139,05 129,14 129,32 132,19
121 12.30 12.09 12.27 12.07
13 111.43 129.14 126.85 129.69
131 159.32 189.51 192.07 189.50
132 164.11 64.75 88.96 64.53
133 – 169.49 173.63 169.25
134 – 52.86 53.38 52.99
14 139.05 150.02 149.79 150.80
15 92.86 105.63 107.64 104.90
16 177.55 161.30 162.42 164.00
17 54.98 51.30 51.77 51.27
171 31.17 29.68 29.67 31.16
172 32.69 31.24 31.56 29.68
173 173.22 173.83 172.76 174.014
18 49.19 50.19 50.30 50.08
181 23.82 23.08 22.69 23.06
19 176.60 172.89 172.40 172.80
20 94.95 93.59 93.60 93.35
P 1 61.42 61.46 61.55 61.51
P 2 117.83 117.79 117.81 117.57
P 3 142.71 142.19 142.75 142.97
P 4 39.81 39.78 39.80 39.77
P 5 24.74 24.98 24.97 24.75
P 6 36.61 37.37 37.35 36.60
P 7 32.72 32.60 32.72 32.72
P 8 37.35 37.31 37.28 37.35
P 9 24.97 24.86 24.74 24.96
P 10 37.27 37.25 37.22 37.22
P 11 32.59 32.74 32.59 32.58
P 12 37.22 36.63 36.61 37.27
P 13 24.39 24.74 24.39 24.38
P 14 39.31 39.34 39.32 31.91
P 15 27.93 27.94 27.93 27.94
P 16 22.69 22.68 22.69 22.70
P 17 22.60 22.59 22.60 22.60
P 111 19.69 19.70 19.69 19.70
P 71 19.63 19.63 19.63 19.63
P 31 16.31 17.30 16.30 16.27
Figure 3. The electrochemical behavior of the systems were evaluated by cyclic voltammetry (CV). In CV, the current (µA) is measured as a function
of potential (V vs. Ag-QRE). Electrochemical response E of phaeophytin b
in an electrolytic solution (ACN containing 0.01 mol L−1 LiClO
4) and at a
scan rate of 50 mV s−1
Figure 4. Proposed energy diagram for phaeophytin b
ACKNOWLEDGMENTS
REFERENCES
1. Thulin, M.; Razafimandimbison, S. G.; Chafe, P.; Heidari, N.; Kool, A.; Shore, J. S.; Taxon 2012, 61, 308.
2. Souza, V. C.; Lorenzi, H.; Botânica sistemática: guia ilustrado para identificação das famílias de fanerógamas nativas e exóticas do Brasil,
baseado em APG II.; 2ªed., Nova Odessa: São Paulo, 2008.
3. Barbosa, D. A.; Silva, K. N.; Agra, M. F.; Rev. Bras. Farmacogn. 2007,
17, 396.
4. Arletti, R.; Benelli, E.; Cavazzutti , E.;Scarpetta, G.; Bertolini, A.;
Psy-chopharmacology1999, 143, 19.
5. Antonio, M. A.; Sousa Brito, A. R. M.; J. Ethnopharmacol. 1998, 61, 215.
6. Zhao, J.; Dasmahapatra, A. K.; Khan, S. I.; Khan, I. A.; J.
Ethnopharmacol. 2008, 120, 387.
7. Kojima, H.; Sato, N.; Hatano, A.; Ogura, H.; Phytochemistry1990, 29, 2351.
8. Costa, D. A; Silva, D. A; Cavalcanti, A. C.; Medeiros, M. A. A.; Lima, J. T., Cavalcante, J. M. S; Silva, B. A.; Agra, M. F.; Souza, M. F. V.; Quim. Nova 2007, 30, 901.
9. Pizzolatti, M. G.; Cunha Jr., A.; Szpoganicz, B,; Sousa, E.; Braz-Filho, R.; Schripsema, J.;Quim. Nova 2003, 26, 466.
10. Silva, D. A.; Silva, T. M. S.; Lins, A. C. S.; Costa, D. A.; Cavalcante, J. M. S.; Matias, W. N.; Braz-filho, R.; Souza, M. F. V.; Quim. Nova2006,
29, 1250.
11. Schwikkard, S. L.; Mulholland, D. A.; Hutchings, A.; Phytochemistry
1998, 49, 2391.
12. Tomaz, A. C. A.; Nogueira, R. B. S. S.; Pinto, D. S.; Agra, M. F.; Souza, M. F. V.; Cunha, E. V. L.; Rev. Bras. Farmacogn. 2008, 8, 47. 13. Jerz, G.; Arrey, T. N.; Wray, V. Du, Q.; Winterhalter, P.; Innovative Food
Science & Emerging Tecnologies2007, 8, 413.
14. Sakdarat, S.; Shuypron, A.; Ayudhya, T. D.; Waterman, P. G.; Karagianis, G.; Thai Journal of Phytopharmacy2008, 51, 13. 15. Silva, T. M. S.; Camara, C. A.; Barbosa-Filho, J. M.; Giulietti, A. M.;
Quim. Nova 2010,33, 571.
16. Melos, J. L. R.; Silva, L. B.; Peres, M. T. L. P.; Mapeli, A. M.; Faccenda, O.; Anjos, H. H.; Torres, T. G.; Tiviroli, S. C.; Batista, A. L.; Almeida, F. G. N.; Flauzino, N. S.; Tibana, L. A.; Hess, S. C.; Honda, N. K.; Quim. Nova2007, 30, 292.
17. Moreira, L. M.; Rodrigues, M. R.; Oliveira, H. P. M.; Lima, A.; Soares, R. S. S.; Batistela, V. R.; Gerola A. P.; Hioka, N.; Severino, D.; Baptista, M. S.; Machado, A. E. H.; Quim. Nova 2010, 33, 258.
18. Crespilho, F. N.; Zucolotto, V.; Siqueira, J. R., JR.; Carvalho, A. J. F.; Nart, F. C.; Oliveira Jr., O. N.; Int. J. Electrochem. Sci. 2006, 1, 151. 19. Micaroni, L.; Nart, F. C.;Hummelgen, I. A.; J. Solid State Electrochem.
2002, 7, 55.
20. Zampa, M. F.; Brito, A. C. F.; Kitagawa, I. L.; Constantino, C. J. L.; Oliveira Jr, O. N.; Cunha, H. N.; Zucolotto, V.; Santos Jr, J. R. C.;