Article
*e-mail: [email protected]
The Use of a Graphite-Silicone Rubber Composite Electrode in the Determination of
Rutin in Pharmaceutical Formulation
Sidney X. dos Santos, Luiz H. Mazo and Éder T. G. Cavalheiro*
Instituto de Química de São Carlos, Universidade de São Paulo, Av. Trabalhador Sãocarlense, 400, CP 676, 13560-970 São Carlos-SP, Brazil
O uso de um eletrodo compósito à base de grafite de borracha de silicone (GSR) na determinação de rutina, (vitamina P), por voltametria de pulso diferencial, é descrito. Voltamogramas cíclicos da rutina apresentaram um par de picos de oxidação/redução no GSR em 0,411 e 0,390 V (vs. ECS), respectivamente, em solução tampão Britton-Robinson (B-R) pH 4,0. Em voltametria de pulso diferencial (DPV), após a otimização das condições, o pico de oxidação em 0,370 V (vs. ECS) foi usado na determinação quantitativa de rutina. Neste caso, um intervalo linear entre
5,0-50,0×10⁻⁸ mol L-1 foi observado com um limite de detecção de 1,8×10⁻⁸ mol L-1. Recuperações de 94 a 113% foram observadas. A superfície do eletrodo foi renovada por polimento, com uma repetibilidade de 1,09 ± 0,06 µA (n = 10) para a corrente de pico. A rutina foi determinada em uma formulação farmacêutica e os resultados concordaram com aqueles obtidos de um método oficial com 95% de confiança.
The possibility of using a graphite silicone-rubber composite electrode (GSR) in a differential pulse voltammetric(DPV) procedure for rutin (vitamin P) determination is described. Cyclic voltammograms of rutin presented a reversible pair of oxidation/reduction peaks respectively at 0.411 and 0.390 V (vs. SCE) at the GSR surface in Britton-Robinson(B-R) buffer solution pH 4.0.
In DPV after optimization of conditions, an oxidation peak at 0.370 V (vs. SCE) was used to
quantitative determination of rutin in B-R buffer solution pH 4.0. In this case a linear dynamic range of 5.0×10⁻⁸ to 50.0×10⁻⁸ mol L-1 was observed with a detection limit of 1.8×10⁻⁸ mol L-1 for the analyte. Recoveries from 94 to 113% were observed. The electrode surface was renewed by polishing after each determination, with a repeatability of 1.09 ± 0.06 µA (n = 10) peak current. Rutin was determined in a pharmaceutical formulation using the proposed electrode and the results agreed with those from an official method within 95% confidence level.
Keywords: composite electrode material, graphite, silicone rubber, rutin
Introduction
The use of carbon based electrodes became very popular in electroanalysis due to its satisfactory response in the positive potential range, in which the mercury does not present an adequate behavior. Carbon electrodes can be used in the study of organic and inorganic substances, in both oxidation and reduction processes. The highest success is obtained when applied in investigations in the oxidative reactions, due to its wide range of anodic polarization with
low residual currents.1
The literature presents several kinds of carbon based
electrodes, being classical examples the pyrolytic graphite,2
glassy carbon (GC)3 and carbon fiber4 electrodes besides
the composite materials prepared with several organic or
polymeric solvents as binders.5
According to Tallman and Petersen, a composite electrode can be defined as “a material consisting of at least one conductor phase commingled with at least one
insulator phase”.6
The advantages of the composite electrodes are the relative easiness of preparation and surface renewing, possibility of modifier incorporation and relative repeatability of effective area.7
Among these composite materials, one can stand out the graphite silicone-rubber electrode (GSR), a polymeric material that was first described by Pungor
and Szepesváry1 and recently retaken by our group.8 In
the composite can be moulded in different shapes and sizes. After curing of the polymeric phase, the composite presents mechanical resistance, besides stability in non-aqueous solvents and capability for flow analysis
applications.9
Flavonoids represent a large family of polyphenolic
compounds widely present in plants10 that have been
demonstrated to be important factors for color, taste, arome
and stability of many plant-based food or beverages.11 They
naturally occur in fruits, vegetables, nuts, seeds, flowers, and bark. They also have been reported to exhibit a wide range of biological effects, including antibacterial, antiviral, anti-inflammatory, anti-allergic, and vasodilator actions. In addition, flavonoids inhibit lipid peroxidation platelet aggregation, capillary permeability, and fragility, and the activity of enzyme systems including cyclo-oxygenase and
lipoxygenase.12
Rutin, 3’,4’,5,7-tetrahydroxyflavone-3β–D-rutinoside,
is a glucoside flavonoid very common in the alimentary diet
and also known as vitamin P.13 Rutin presents the capability
to increase the strength of the capillary blood vessels and to improve the permeability, being essential for a better
absorption of vitamin C in the organism.13 This flavonoid
has been applied to treat high blood pressure and vascular fragility and related diseases.14 The rutin chemical structure
is presented in Scheme 1.
The literature presents many reports regarding the determination of rutin using electroanalytical procedures. Using a GC electrode Ghica and Brett performed an investigation of electrochemical behavior of rutin, in
which an oxidation mechanism is proposed.10 Kang et al.14
quantified rutin using DPV in several samples of chinese
medicines. Hua et al.15 studied the electrochemical behavior
by square wave stripping voltammetry and applied in determination of rutin in tablets.
Malagutti et al.16 reported a comparative study of rutin at
a GC electrode and a rigid graphite-polyurethane composite electrode. A procedure based on square wave voltammetry (SWV) was developed and applied in the determination of rutin in tea infusion samples.
Examples of the use of carbon paste electrodes are the works of Volikakis and Efstathiou that used adsorptive stripping voltammetry to determine twelve flavonoids in a flow injection system17 and Zoulis et al.18 that studied the
preconcentration of rutin and other flavonoids in carbon paste and carried out its determination by adsorptive stripping voltammetry.
Some papers described the use of modified carbon based electrodes. Examples are those presented by
Yongxia et al.19 that used carbon nanotubes to modify the
GC surface and studied rutin electrochemical behavior
by cyclic voltammetry (CV) and SWV in details. Santos et al. 20 deposited a film of poly glutamic acid in a GC
electrode and determined rutin by SWV in pharmaceutical formulation.
He et al.21 modified a GC electrode with multi-wall
carbon nanotubes (MWCNT)-β-cyclodextrin film.
The electrochemical behavior of rutin at a chemically modified electrode was investigated by CV. This sensor was used for the determination of rutin in
urine samples. Franzoi et al.22 modified a carbon paste
electrode with poly(vinylpyrrolidine) and evaluated the effect of several parameters in the performance of the modified electrode. Such device was successfully applied to the determination of rutin in pharmaceutical formulation.
In this work we report the use of a GSR 70% (graphite, m/m) for the voltammetric determination of rutin in pharmaceutical formulation. Such electrode was used considering the easiness of preparation, low cost, high stability, long life and reproducible response between successive surface renovations, since rutin strongly adsorbs at the carbon surface.
Experimental
Reagents and solutions
All reagents were of analytical grade and used as received. Solutions were prepared with water treated in a Milli-Q system (Millipore).
Rutin was purchased from Natural Pharma (Brazil). Britton-Robinson (B-R) buffer solutions at various pH values were used as supporting electrolytes.
With the aid of ultrasonic agitation, stock solution of
rutin were prepared daily at a 0.50 mmol L-1 concentration
in ethanol, and kept at 4 ºC in a refrigerator. These solutions were diluted to the desired concentrations with the buffer solutions.
Apparatus
Voltammetric experiments were performed using a BAS-CV 50W potentiostat (Bionalytical Systems, USA) coupled to a personal computer and controlled with BAS 2.3 software. A three-electrode cell, with 25.0 mL total capacity, was used with a saturated calomel electrode (SCE) and a platinum wire (1 cm longer) as the reference and counter electrodes, respectively. The 70% (graphite, m/m)
composite8 and a GC were used as working electrodes for
Preparation of the composite electrodes
The electrodes were prepared by mixing adequate amounts of graphite powder and silicone-rubber in a glass mortar for 10 min, in order to obtain a mixture with 70% of graphite (m/m). The resulting mixture was inserted in
a glass tube (φ 3.0 mm) and with the aid of a copper wire
(φ 3.0 mm) it was compressed in a hydraulic press for 24 h. After curing, the electric contact was established
connecting the copper wire (φ 3.0 mm) to the composite
with the help of a silver epoxy (EPO-TEK 410E, Epoxy Technology, USA).
Procedures
The voltammetric experiments for rutin determination
were performed after dearation with N2 bubbled for 10
min. The electrode surface was renewed between each measurement by polishing in 600 grit sand paper followed by a soft cloth in an APL-2 (Arotec, Brasil) polishing wheel.
Procedures for pharmaceutical formulation analysis
According to the Brazilian Pharmacopeia,23 twenty
tablets of Novarrutina® were weighed accurately up to
± 0.1mg. The tablets were powdered in a glass mortar and a portion equivalent to 40 mg of rutin, according to the label, was dissolved in 25.0 mL of ethanol. An aliquot of this solution was diluted in 25.0 mL of B-R buffer pH 4.0 to prepare a sample solution.
An appropriate aliquot of this sample solution was then diluted directly in the cell in order to reach a final 2.0 × 10⁻⁷ mol L -1 rutin concentration.
To this solution three 150 µL aliquots of rutin standard
solution, 1.0 × 10⁻⁵ mol L-1, was added successively. After
each addition three differential pulse voltammograms
were taken between 100-600 mV (vs. SCE) at 10 mV s-1
scan rate.
Comparison method
For comparison it was used the official method
described in the AOAC Official Methods,24 that consists of
a spectrophotometric procedure based in the measurement of the sample solutions absorbance at 338.5, 352.5 and 366.5 nm wavelengths using water as a blank.
The standard solution was prepared by dissolving 100 mg of rutin in 250 mL of a solution of ethanol and
acetic acid 0.9 mol L-1 (11:1, v/v). An aliquot of 5 mL of
this solution was diluted to 100 mL in water to obtain a
standard solution of 0.02 mg mL-1. In this case, the sample
solution was prepared weighing a tablet amount equivalent to a rutin mass between 0.05 and 0.5 g and dissolving in
solution of ethanol and acetic acid 0.9 mol L-1 (11:1, v/v),
resulting in an approximately 0.02 mg mL-1 solution.
Results and Discussion
According to the previously described CV and scanning
electron micrography results8 using composites containing
between 30 and 70% of graphite (m/m), it was the 70% (graphite, m/m) the composition that presented the best electroanalytical response, thus it was used in the present work.
Cyclic voltammetry
The oxidation reaction of flavonoids is strongly related to their structure, which contains several free phenolic hydroxyl groups, particularly o-phenolic ones.10 In the case
of rutin, the reversible redox process can be represented by
the chemical reaction, represented in Scheme 1.10
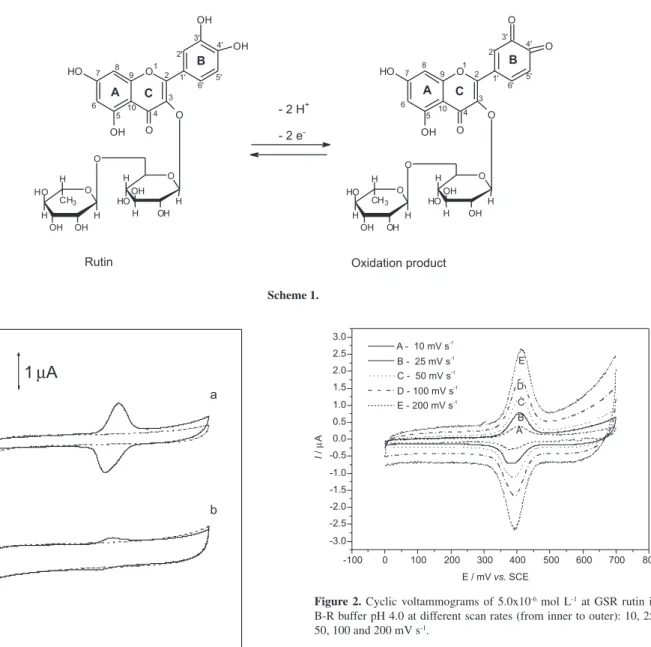
According to the cyclic voltammograms of rutin in B-R buffer solution (Figure 1), at pH 4.0 and scan rate 50 mV s-1,
there was only one pair of oxidation-reduction peaks when the potential is scanned from 0.0 to 0.6 V. Under these conditions the oxidation and reduction peak potentials
of rutin were, respectively, 0.411 and 0.390 V (vs. SCE),
which corresponded to the oxidation of the 3’,4’-dihydroxy substituent on the B-ring of rutin and the reduction of the
corresponding 3,4-diquinone respectively.10
The GSR presented a better peak definition and higher current signal when compared with the GC as presented in Figure 1.
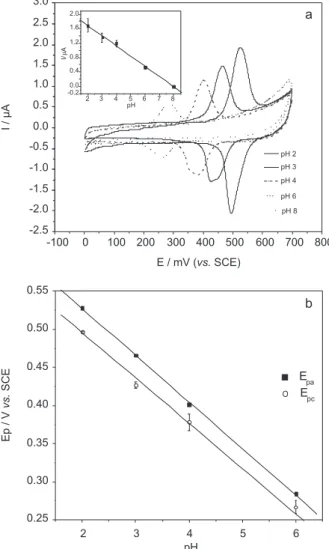
The small difference in the background currents between GC and GSR can be related to an adsorption of the analyte on the composite electrode. The adsorption was investigated by observing the dependence of peak potentials and currents as a function of the scan rate.
The peak potentials in both anodic and cathodic sweeps
as weel as the ΔEp ≈ 21 mV are practically independent of
the scan rate, suggesting that the redox process is controlled
by adsorption (Figure 2).25
However the peak currents (anodic and cathodic)
change linearly with the scan rate only for ν > 50 mV s-1
as presented in Figure 3a. This is not expected for a totally adsorption controlled process.25 On the other hand it is
Zheng et al.27 observed a totally adsorption control
during the all scan rate range, but using a single wall carbon nanotube modified gold electrode.
If the potential sweep is extended up to 1.2 V, an additional irreversible oxidation process is observed at 1.0 V
(vs. SCE). According to Ghica and Brett, this is related to
the oxidation of the –OH groups in the A ring of rutin.10
Effect of pH on the voltammograms
The anodic and cathodic peak potential changes to more negative values when the pH varies from 2 to 6. The
respective peak current diminishes as the pH increases. Under the conditions used in this work, above pH 6 no peaks were observed in the cyclic voltammograms (Figure 4a).
A linear dependence of peak potential is observed as presented in Figure 4b, and obeyed the following relationships:
Epa (mV) = 649 mV - 61 pH (r = 0.999), n = 4 (1)
Epc (mV) = 604 mV - 56.4 pH (r = 0.998), n = 4 (2)
The slopes of these equations, close to 59 mV suggest that the same number of protons and electrons are involved
in the redox process. According to many authors,10, 27, 28 in
this case, 2 protons and 2 electrons are involved.
Zeng et al.27 suggested that at higher pH medium the
electrochemical reaction became more difficult due to the shortage of proton.
Scheme 1.
Figure 1. Cyclic voltammograms obtained with (a) the GSR and (b) GC
electrodes in B-R buffer pH 4.0. (—) containing 5.0 x 10⁻⁶ mol L-1 rutin
(----) without rutin. Scan rate 50 mV s-1.
Figure 2. Cyclic voltammograms of 5.0x10⁻⁶ mol L-1 at GSR rutin in
The potential shift per pH unit is about −0.06 V, which is similar to the behavior of anthraquinones,14 and is
reasonable for the expected 2-electron/2-proton oxidation of the cathecol 3’,4’-dihydroxyl group in the rutin molecule
to the quinone form.14,29
DPV measurements and optimization of the composite electrode response
Optimal conditions for rutin determination using DPV were first established. The effect of scan rate
(10-100 mV s-1) and pulse amplitude (10-100 mV) were
first evaluated being 10 mV s-1 and 50 mV the best
parameters. Although higher peak currents were observed in pH 2.0 this was not chosen for analytical purposes since a relative higher standard deviation in successive measurements was noted (see insert in Figure 4a). The pH 4.0 was chosen once the results were more reproducible.
After optimization of the DPV experimental conditions at the GSR, voltammetric measurements were accomplished in B-R buffer solution pH 4.0 in different rutin concentrations to obtain an analytical curve for the determination of the linear range for this system. The voltammetric response was
linear from 0.050 to 0.50 µmol L−1 (n = 7), at 0.370 V (vs.
SCE) potential peak obeying the following equation:
Ip = −3.54 × 10⁻⁹ A + 0.2855 A mol−1 L × C
Rutin,
(r = 0.9945, n = 7) (3)
in which Ip is the peak current (A) and CRutin is the total rutin
concentration (mol L−1). The analytical curve was obtained
measuring the peak currents for three successive DPV runs
at each concentration. From these data a 17.64 nmol L−1
detection limit was determined for rutin.
Analytical curves (Figure 5) were also obtained at a GC electrode for comparison. At the GC a linear dynamic
Figure 3. Dependence of anodic and cathodic peak currents with scan
rate (a) and square-root of scan rate (b).
Figure 4. (a) Influence of supporting electrolyte pH on current response of 5.0 × 10⁻⁶ mol L-1 rutin. Scan rate 50 mV s-1. Insertion show the dependence
range between 0.24 to 0.82 µmol L-1 was observed with a
slope of 0.0616 A mol-1L which is markedly lower than
that observed for the GSR as in equation 3, the limit of
detection (LOD) obtained was 47.7 nmol L−1. In Figure
5, the analytical curves obtained for both GSR and glassy carbon are presented. A second linear range was observed
for the GSR between 0.56-0.98 µmol L-1.
The presence of a shorter second linear dynamic range, has been attributed to an adsorption of the analyte on the electrode surface, that becames evident at higher concentration, that increases the sensitivity. Above 1.0 µmol L-1 a typical saturation of the electrode active
takes place as presented in Figure 5.
In the case of the GC the saturation also occurs above
1 µmol L-1, with only one linear range.
The GSR electrode was submitted to 10 successive
determinations of rutin using a 5.0×10⁻⁶ mol L−1 in B-R
buffer pH 4.0 solution in order to evaluate the repeatability of the measurements. The electrode surface was renewed after each determination, resulting in a mean peak current
of 1.09 ± 0.06 µA (n= 10).
Apparently the standard deviation within the analytical curve is lower than that observed outside the linear range. To evaluate this, three successive determinations of 0.476
and 1.303 µmol L-1 were taken after surface renewing. The
peak currents at these concentrations were 0.136 ± 0.008 and 0.42 ± 0.03 µA, respectively. Thus we concluded that the repeatability is not affected significantly by the amount of analyte in solution, since the standard deviation is in the order of 5-7% in or outside the linear region.
Determination in pharmaceutical formulation
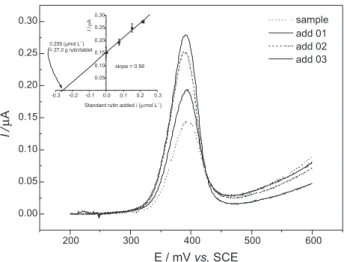
Finally the performance of the proposed method in the determination of rutin in pharmaceutical formulations
was evaluated. For the voltammetric determination of the rutin in tablets, the standard addition method was used (Figure 6).
The results obtained by DPV were compared to those obtained by official method and were presented in Table 1. The DPV results agreed with those from the spectrophotometric procedure within 95% of confidence level.
The agreement between results from the two methods leads to conclude that there are more rutin in the samples than stated in the label. Considering that the pharmaceutical product is a natural extract is not at all a surprise the relatively higher rutin amount found by both the proposed and the official methods.
Recovery tests were also performed resulting in a mean recovery of 93.7 to 113.0% using the proposed procedure.
Conclusions
According to the results obtained in this work, the GSR represented a promising alternative as an electrodic material
Table 1. Determination of rutin in three aliquots of the pharmaceutical formulations Novarrutina® using the 70% (graphite, m/m) composite
electrode and spectrophotometric method
Samplea Rutin (mg/tablet) |Relative error|/ (%)b
DPV Spectrophotometric
1 28.0 27.0 3.7
2 28.2 27.0 4.4
3 27.0 27.0 0
aLabeled value: 20 mg/tablet. b|Relative error| = [(DPV− Spectrophotometric)/
Spectrophotometric×100%].
Figure 5. Analytical curves obtained for GSR and GC electrodes in B-R
buffer pH 4.0. Scan rate 10 mV s-1 and pulse amplitude 50 mV. Figure 6. Standard addition curves for rutin determination in tablets
Novarrutina®. B-R buffer pH 4.0. Scan rate 10 mV s-1 and pulse amplitude
50 mV. The sample was prepared to be ± 2.0x10⁻⁷ mol L-1 in rutin according
in the determination of flavonoids. The GSR presented higher sensitivity when compared with GC and other electrodes presented earlier, easy preparation, low cost, long useful life and easy surface renewal. The electrode is quite stable and has been used for more than 1 year in our laboratory.
The proposed method could be successfully applied to the determination of rutin in pharmaceutical formulations, providing results that were comparable with those obtained from the official spectrophotometric method. It requires renewal of the electrode surface due to the adsorption of the analyte, however reasonable repeatability could be obtained.
The performance of the GSR electrode proposed in this work is better than those observed for the GC. When compared to other electrodes described in literature, the LOD is much lower to the CNT sensor that falls in the 10-7-10-8 mol L-1 range.15,19,21,30,31 The LOD is comparable
with that found with the graphite-poliuretane composite electrode16 in the order of 10-9 mol L-1.
Other components of the pharmaceutical formulation (a natural extract) did not interfere in the measurements as performed.
References
1. Pungor, E.; Szepesváry, É.; Anal. Chim. Acta 1968, 43, 289. 2. Miller, F. J.; Zittel, H. E.; Anal. Chem.1963,35, 1866. 3. Zittel, H. E.; Miller, F. J.; Anal. Chem. 1965, 37, 200. 4. Edmonds, T. E.; Anal. Chim. Acta 1985, 176, 1.
5. Kissinger, P. T.; Heineman, W. R.; Laboratory Techniques in Electroanalytical Chemistry, Marcel Dekker: New York, 1996.
6. Tallman, D. E.; Petersen, S .L.; Electroanalysis 1990, 2, 499. 7. Kalcher, K.; Kauffman, J. M.; Wang, J.; Svancara, I.; Vytras,
K.; Neuhold, C.; Yang, Z.; Electroanalysis 1995, 7, 5. 8. Oliveira, A. C., Santos, S. X., Cavalheiro, E. T. G.; Talanta
2008, 74, 1043.
9. Céspedes, F.; Martinez-Fábregas, E; Alegret, S.; Trends Anal. Chem. 1996, 15, 296.
10. Ghica, M. A.; Brett, A. M. O.; Electroanalysis 2005, 17, 313. 11. Reichart, E.; Obendorf, D.; Anal. Chim. Acta 1998, 360, 179. 12. Cook, N. C.; Samman, S.; J. Nutr. Biochem. 1996, 7, 66.
13. Zoulis, N. E.; Efstathiou, C. E.; Anal. Chim. Acta 1996, 320, 255.
14. Kang, J. W.; Lu, X. Q.; Zeng, H. J.; Liu, H. D.; Lu, B.Q.; Anal. Lett. 2002, 35, 677.
15. Hua, J.; He, X.; Liao, F.; Zhu, Q.; Dianhuaxue2008, 14, 87. 16. Malagutti, A. R.; Zuin, V. G.; Cavalheiro, E. T. G.; Mazo, L.
H.; Electroanalysis2006, 18, 1028.
17. Volikakis, G. J.; Efstathiou, C. E.; Talanta2000, 51, 775. 18. Zoulis, N. E.; Efstathiou, C. E; Anal. Chim. Acta1996, 320,
255.
19. Yongxia, Q.; Li, R.; Shen, J.; Huang, S.; Huaxue Chuanganqi 2007, 27, 49.
20. Santos, D. P.; Bergamini, M. F.; Santos, V. A. F. F. M.; Furlan, M.; Zanoni, M. V. B.; Anal. Lett.2007, 40, 3430.
21. He, J.; Yang, Y.; Yang, X.; Liu, Y.; Liu, Z.; Shen, G.; Yu, R.; Sens. Actuators, B2006, 114, 94.
22. Franzoi, A. C.; Spinelli, A.; Vieira, I. C.; J. Pharm. Biomed. Anal.2008, 47, 973.
23. Farmacopéia Brasileira, 4a ed., Atheneu Editora São Paulo
LTDA: São Paulo, 1988, Vol. II.
24. Cunnif, P., ed. In Official Methods of Analysis of AOAC International, vol. 1, Arlington: AOAC International, 1995, p. 29.
25. Bard, A. J.; Faulkner, L. R.; Electrochemical Methods: Fundamentals and applications, 2nd ed., Wiley & Sons: New
York, 1980.
26. Brown, E. R.; Large, R. F.; Physical Methods of Chemistry, vol.1; Wiley Interscience: New York, 1971, pp.425-530. 27. Zeng, B.; Wei, S.; Xiao, F.; Zhao, F.; Sens. Actuators, B2006,
115, 240.
28. van Acker, S. A. B. E.; de Groot, M. J.; van den Berg, D. J.; Tromp, M. N. J. L.; Donne-op den Kelder, G.; van der Vijgh, W. J. F.; Bast, A.; Chem. Res. Toxicol.1996, 9, 1305. 29. Bao, X.; Zhu, Z.; Li, N.; Chen, J.; Talanta 2001, 54, 591. 30. Zhang, Y.; Chen, W.; Wu, P.; Lin, X.; Huaxue Yanjiu2005, 16,
84.
31. Sun, Y.; Lan, H.; Huaxue Fence2003, 39, 579.
Received: April 3, 2008
Web Release Date: October 8, 2008