A
r
ti
c
le
0103 - 5053 $6.00+0.00
*e-mail: [email protected]
Sodium Dodecyl Sulfate-Coated Alumina and C
18Cartridge for the Separation
and Preconcentration of Cationic Surfactants Prior to their Quantitation
by Spectrophotometric Method
Mohammad Ali Karimi,*,a,b Reza Behjatmanesh-Ardakani,bAli Aghaei Goudib and Sara Zalib
aDepartment of Chemistry, Faculty of Science, Payame Noor University (PNU), Sirjan, Iran
bDepartment of Chemistry, Faculty of Science, Payame Noor University (PNU), Ardakan, Iran
Um novo método de extração em fase sólida foi desenvolvido para separar e pré-concentrar traços de tensoativos catiônicos, tais como, brometo de dodeciltrimetilamônio (DTAB), brometo de cetiltrimetilamônio (CTAB) e cloreto de cetilpiridínio (CPC). Esse método é baseado na sorção do tensoativo aniônico (AS−), dodecilssulfato de sódio (SDS), sobre a superfície de γ-alumina,
enquanto um cartucho C18 é utilizado para a pré-concentração dos tensoativos catiônicos (CS+). O
método espectrofotométrico, utilizado para a determinação dos tensoativos catiônicos, baseia-se na competição entre o corante catiônico, azul de metileno (MB+), e o CS+, para associação e formação
do complexo SDS. O íon complexo formado (MB+) pode ser quantitativamente substituído pelo CS+,
levando a um aumento da absorvância medida em 662 nm. Foram estabelecidas ótimas condições experimentais para a separação, pré-concentração e determinação dos tensoativos catiônicos. Sob essas condições otimizadas, realizou-se a pré-concentração (2×) e os resultados mostraram que a determinação do CPC, DTAB e CTAB poderia ser realizada nas faixas de concentração de 1×10⁻⁵-2×10⁻⁴, 4×10⁻⁵-5×10⁻⁴ and 5×10⁻⁵-5×10⁻⁴ mol L-1, respectivamente. Por fim, a partir de
onze determinações de 10,0 mg mL-1 das soluções de CPC, DTAB e CTAB obtiveram-se RSDs de
4,3, 3,7 e 4,0%, respectivamente. O método foi validado por meio de um conjunto de diferentes amostras que continham os tensoativos catiônicos.
A new solid phase extraction method has been developed to the separation and preconcentration of trace amounts of cationic surfactants i.e. dodecyltrimethylammonium bromide (DTAB), cetyltrimethylammonium bromide (CTAB) and cetylpyridinium chloride (CPC). This method is based on the sorption of anionic surfactant (AS-) of sodium dodecyl sulfate (SDS) on the
γ-alumina surface and C18 cartridge is used for preconcentration of cationic surfactants (CS +).
Spectrophotometric determination method used for the determination of cationic surfactants is based on the competition between the cationic dye of methylene blue (MB+) and CS+ for
association complex formation with SDS. The MB+ in the ion associate complex can be
quantitatively substituted by CS+ leading to an increase in the absorbance measured at 662 nm.
Optimum experimental conditions for separation, preconcentration and determination of cationic surfactants have been reported. Under the selected optimal conditions, preconcentration factor of two-fold was achieved and the results showed that determination of CPC, DTAB and CTAB could be performed in concentration ranges of 1×10⁻⁵-2×10⁻⁴, 4×10⁻⁵-5×10⁻⁴ and 5×10⁻⁵-5×10⁻⁴ mol L-1,
respectively. Eleven determinations of 10.0 mg mL-1 of CPC, DTAB and CTAB solutions led to
RSD’s of 4.3, 3.7 and 4.0%, respectively. Method was validated using a set of different samples containing cationic surfactants.
Keywords: cationic surfactants, sodium dodecyl sulfate, γ-alumina, C18 cartridge, solid phase extraction
Introduction
Cationic surfactants are widely used as surface cleaning agents in the manufacture of commodity samples, i.e.
detergents, soaps and shampoos, but they have also been reported as pollutants.1 In most cases, the cationic
surfactant (CS+) is discharged directly into environmental
associate with anionic surfactants (AS-) because of their
high ion-associate constants2 and the high concentration
of anionic surfactants in the water. Thus, in order for CS+
to be determined, it is necessary to separate AS- from CS+
before CS+ determination process.
Several methods have been reported to be used for the determination of cationic surfactants such as classic-titrimetry,3 spectrophotometry,4 electroanalytical
techniques,5 fluorometry,6 chemiluminescence,7 HPLC,8
GC,9 and capillary electrophoresis.10 Several literature
based on the extraction of the cationic surfactants with anionic dyes as counter ions, such as Disulfine Blue,11
tetrabromophenolphthalein ethyl ester12 or Orange II13
were reported to be used for determining of cationic surfactants. Liquid–liquid extraction is the classical approach for surfactants extraction from water samples; however, because of its disadvantages, it has been widely replaced with solid-phase extraction (SPE).14
Several works reported the use of solid-phase micro extraction and SPE with different sorbents such as alkyl-bonded silica,15 graphitized carbon black (GCB)16 and
styrene–divinylbenzene resins.17 Recent studies on the
use of surfactant-coated mineral oxides columns for SPE have demonstrated that these new sorbent materials are promising tools for the extraction/preconcentration of organic compounds in a wide polarity range.18-21
Adsorption of ionic surfactants on mineral oxides is a cooperative process; firstly, a monolayer of surfactant (i.e.
hemi-micelles) is formed with the surfactant head-group facing towards the oxide surface and its hydrocarbon tail-groups protrude into solution, interacting laterally between them. Then, surfactant adsorption occurs through hydrophobic interactions between hydrocarbon tail-groups, which results in the formation of discrete surface aggregates termed admicelles. Attractive electrostatic interactions between surfactant and analyte ionic groups bearing opposite charges,22 and p-cation
interactions between aromatic neutral organic compounds and adsorbed cationic surfactants have been previously demonstrated to be highly contributive to the quantitative retention of polar organic substances on supramolecular sorbents.20
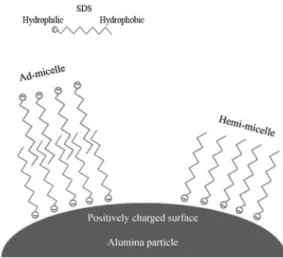
In this work, γ-Al2O3 column was used as sorbent for separation of anionic from cationic surfactants. The anionic surfactant is effectively sorbed on the positively charged
γ-alumina surface to form aggregates (hemi-micelles). The formation of hemi- and ad- micelles may depend on the concentration of SDS (Figure 1). γ-Al2O3 completely sorbs the AS- over a wide pH range of 1.0-7.5.23
Then C18 cartridge was used for preconcentration of cationic surfactants. C18 cartridge is used for reversed phase
extraction of nonpolar to moderately polar compounds, such as surfactants. The solution consisting of cationic surfactants passes through the C18 membrane surface and then is eluted by methanol. Because of interference in spectrophotometric determination of cationic surfactants, methanol is eliminated after elution and before next steps. The eluted solution is heated in a water bath to have its methanol completely distilled. Because of heating, cationic surfactant concentration may achieve its critical micelle concentration (CMC), so it is necessary to add distilled water, with the same amount of removed methanol. Determination of CS+ was accomplished through
spectrophotometric method by applying methylene blue (MB) and based on the absorbance measured at 662 nm.
Experimental
Reagents
Triply distilled water was used throughout the work. All reagents were of analytical grades and were used without further purification. A stock solution of 2×10⁻³ mol L-1
methylene blue was prepared by dissolving 7.12×10⁻² g
of methylene blue dehydrate (Merck) and diluting to 100 mL with triply distilled water. A stock solution of 3×10⁻³ mol L-1 SDS was prepared by dissolving 8.65×10⁻² g
of sodium dodecyl sulfate (Merck) and diluting to 100 mL with triply distilled water. CTAB, CPC and DTAB solutions (1×10⁻² mol L-1) were prepared by dissolving 0.364 g
of cetyltrimethylammonium bromide (Serva), 0.358 g of N-cetylpyridinium chloride (Merck) and 0.311 g of dodecyltrimethylammonium bromide (Sigma) in water, and diluting to 100 mL with water. The minimum number of dilution steps possible was used for preparation of more Figure 1. Adsorption of anionic surfactant on the positively charged
diluted solutions. Other reagents were γ-alumina (particle size > 0.2 mm, Merck), sodium dodecylbenzene sulfonate (Fluka), Triton X-100 (Fluka), Brij-35 (Fluka).
Apparatus
A Beckman UV 650-DU spectrophotometer with a 1.0 cm glass cell and a flame atomic absorption spectrophotometer (GBC 906AA) with a deuterium lamp background corrector were used. The pH measurements were made with a Metrohm pH meter (model 632) using a combined-glass electrode. C18 cartridge (Varian, 500 mg, volume 3 mL) was used for separation and preconcentration of cationic surfactants. An Edward vacuum pump was used for filtration purposes.
Preparation of sorbent and recommended procedure
A glass column 1.0 cm in diameter and 10.0 cm in length was used for separation. This column was packed with 1.2 g of γ-alumina as sorbent. The column was washed using triply distilled water and then cotton was placed at the bottom and at the top of the column for allowing the adsorbent to settle properly. A volume of 25 mL of 1.2×10⁻⁴ mol L-1 SDS and 1×10⁻⁴ mol L-1 cationic
surfactant solutions at pH 6.0 were passed through the surface of γ-alumina at a flow rate of 1.0 mL min-1 and
then were passed through the C18 surface at the same flow rate. The adsorbed cationic surfactant was eluted using 12 mL of methanol at an elution flow rate of 9.0 mL min-1. The eluate was heated in a water bath to
have its methanol completely evaporated (Attention: methanol vapor is harmful). Determination of CS+ was
accomplished through spectrophotometric method by applying methylene blue (MB). The anion of dodecyl sulfate reacts with dissociated methylene blue (MB+)
to form an ion associate complex. After elimination of methanol eluate was diluted with distilled water (the same amount of removed methanol), and then the concentration of cationic surfactant was determined using ion associate complex of DS− : MB+ (6:1). The MB+ in the ion associate
can be quantitatively substituted by such cationic surfactants leading to an increase in the absorbance measured at 662 nm. This increased absorbance value is proportional to the concentration of cationic surfactants.
For shampoo samples, weighed amounts of shampoo were dissolved in 100 mL triply distilled water. All sample solutions were filtered with Whatman filter paper no. 42. An appropriate volume of the filtrate was further diluted with water so that the concentration of surfactant in the final solution was within the working range.13
Results and Discussion
Effect of pH
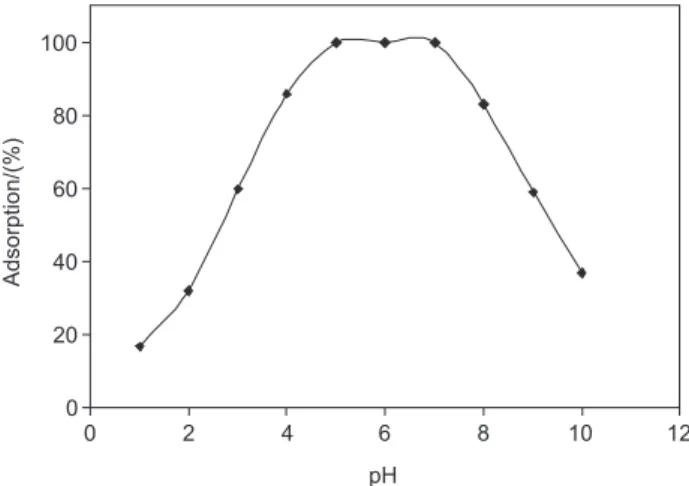
Acidity plays a significant role in preconcentration studies. A series of CPC sample solutions with different pH values from 1 to 10 were introduced into the packed column and after adsorption of CPC ions on the sorbent, a volume of 12 mL methanol as eluent was used for desorption of CP+ from each column. Determination of
CP+ in each effluent was analyzed by spectrophotometric
method using methylene blue. Figure 2 shows that CPC ion was completely adsorbed over the pH range of 5.0-7.0. A pH of 6.0, the middle point in the pH range, was selected as the optimum pH to avoid any abrupt changes in pH that may occur during adsorbing step and could consequently affect the precision. Based on the results obtained, it could be explained that at pH lower than 5, hydronium ion could compete with CP+ to form SDS-:H+ ion pair and prevent the
formation of SDS-:CP+ ion pair, but at pH above 7, CPC and/
or SDS could be washed out by the eluent.24 Consequently
the load of the column with the adsorbent will be decreased; this gives a lower percent recovery for CPC adsorption on C18 as can be observed in Figure 2.
To find the optimum pH for DS−MB+ and CP+ solutions
in spectrophotometric determination of CPC, a series of solutions with different pH values were used. As results show in Figures 3, absorbance is constant up to pH about 11. For pH > 11, because of higher concentration of OH–
and its interaction with MB+, absorbance was reduced. A
pH of 6.0, the middle point in the pH range, was selected as the optimum pH to avoid any abrupt changes in pH that may occur during adsorbing step and could consequently affect the precision.
Choice of the eluent
A variety of solvents were tested in order to elute the adsorbed cationic surfactant from the column. Methanol, acetonitryl, acetone, ethyl acetate and ethanol were studied so that the most effective eluent for the quantitative recovery of cationic surfactant could be chosen. The adsorption studies were carried out maintaining a cationic surfactant concentration of 5×10⁻⁵ mol L-1 CPC. The recovery of CPC
was found to be quantitative with these eluting solvents. When 12 mL of methanol was used as eluent, percent recoveries of eluted CPC were about 101.0%, while at the same volume, recoveries for acetonitryl, acetone, ethyl acetate and ethanol were 73.5, 46.0, 0 and 71.0, respectively. Therefore, methanol as the most suitable eluent was used for further studies. Methanol is a toxic alcohol and toxicity is assumed to come from its conversion to form acid. Thus, one must be careful about its toxicity when it is used as eluent and distilled. If contaminated with methanol, fomepizole is a potent drug and long-acting competitive inhibitor of alcohol dehydrogenase (ADH) that prevents hepatic methanol metabolism to formic acid.25-26
Effect of sample volume, sample and eluent flow rates
The effect of sample volume on the recovery of the analyte was investigated in the range of 25-1500 mL maintaining an overall concentration of 5×10⁻⁵ mol L−1
of cationic surfactant (e.g. CPC). The results are presented in Figure 4. It can be seen that the recovery of CPC is quantitative up to 1200 mL sample volume. A preconcentration factor of 100 could be attained for quantitative recovery of CPC when the sample volume was 1200 mL.
The percent sorption of CPC ion (25 mL of 5×10⁻⁵ mol L-1 CPC at pH 6.0) on the sorbent surfaces (1.2 g
of γ-alumina) and C18 as a function of sample solution flow
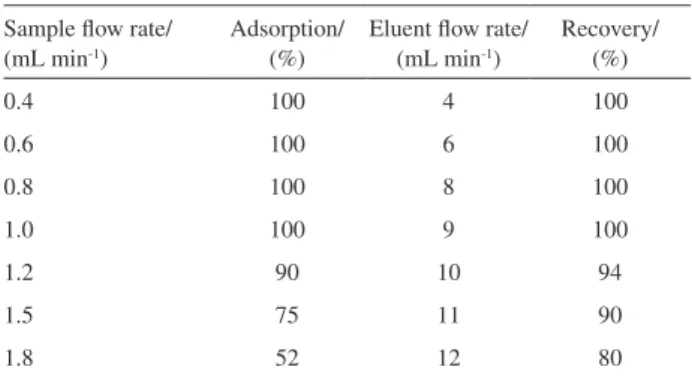
rate was studied. Results (Table 1) show that at flow rate of 1.0 mL min-1, about 100% of CPC was adsorbed. Therefore,
in order to achieve a good precision in further studies, we kept the flow rate at 1.0 mL min-1.
A series of sorbed CPC solutions (25 mL of 5×10⁻⁵ mol L-1
CPC at pH 6.0) on the C18 surface were eluted at different flow rates of eluent (methanol). Percent recoveries of CPC surfactant as a function of eluent flow rate are shown in Table 1. Results showed that recovery is stable with different flow rates of eluent; indicating that methanol is a suitable eluent for our work. An eluent flow rate of 9.0 mL min-1 as the optimum flow rate was chosen for
further studies.
Effect of the amount of alumina and capacity of C
18
The amount of γ-alumina loaded was varied from 0.5 to 2.0 g and the preconcentration studies were carried as before. Quantitative recovery of CPC could be attained in the range 1.2-2.0 g of γ-alumina. Results show that in Figure 3. Effect of pH on the absorbance of DS-:MB+ in the presence
of CPC.
Figure 4. Effect of sample volume on percent recovery of CPC.
Table 1. Effect of sample and eluent flow rates on percent adsorption and recovery of CPC
Sample flow rate/ (mL min-1)
Adsorption/ (%)
Eluent flow rate/ (mL min-1)
Recovery/ (%)
0.4 100 4 100
0.6 100 6 100
0.8 100 8 100
1.0 100 9 100
1.2 90 10 94
1.5 75 11 90
1.8 52 12 80
this range of amount of the sorbent, recovery is quantitative (> 99%). For masses lower than 1.20 g there was a significant reduction in the recovery beyond a sample volume of 25 mL. Therefore, an amount of 1.2 g of
γ-alumina was chosen as the optimum amount for further studies.
Different amounts of CPC were passed through 500 mg of C18. Recoveries of eluted solutions were studied. The results showed that the solution with 4.25×10⁻³ mmol of
CPC was completely sorbed on C18 surface. To confirm this, was analyzed the solution passed through C18 and no amount of CPC was found.
Absorption spectra
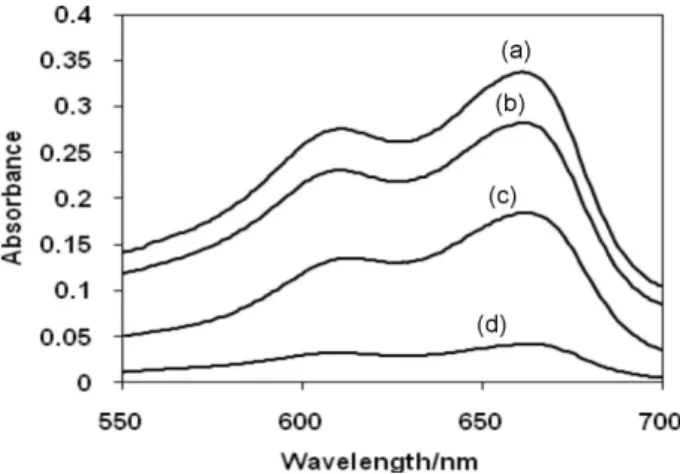
The absorption spectra of the CPC added to DS−MB+
ion associate in the presence of blank are shown in Figure 5. All spectral curves were recorded for solutions in 2×10⁻⁵ mol L-1 MB and 1.2×10⁻⁴ mol L-1 SDS. It is evident
that the maximum absorption of DS−MB+ in the presence
of CPC happens at 662 nm. The approximate pH in this solution is about 5.5. At this pH, MB existed as a cationic species and SDS existed as an anionic species. This implies that anionic DS− reacts with MB+ to form an
ion-association complex DS−MB+ which has a maximum
absorption wavelength at 662 nm. By increasing the CPC concentration in the solution, the absorbance at 662 nm increased gradually. The increase in absorbance was almost linear against the increase of the CPC concentration up to 2×10⁻⁴ mol L-1. This means that the cationic surfactant
(CPC) may substitute for MB to form a non-colored ion-association complex DS−CP+, resulting in the release of
free MB+ from the colored DS−MB+ ion-associate. Thus,
MB+ in the associate of DS−MB+ can be easily replaced with
CP+. Based on these studies, the equilibrium mechanism
of reaction to form colored compound for determination of cationic surfactant may be described as:
Optimization ratio of SDS/MB
Spectrophotometric determination method for the determination of cationic surfactants is based on the competition between the MB+ and CS+ for association
complex formation with dodecyl sulfate anion. The cationic surfactants were quantitatively desorbed with methanol and added to a solution of SDS reacted with MB+ and an
ion associate complex was formed. The MB+ in the ion
associate complex can be quantitatively substituted by CS+ leading to an increase in the absorbance measured at
662 nm. This increased absorbance value is proportional to the concentration of the cationic surfactants. The effect of concentration ratios of SDS/MB on the sensitivity of the method was investigated in the range of 1:1 to 10:1 ratios maintaining a concentration of 2×10⁻⁵ mol L−1 of MB. The
results showed that, maximum sensitivity and good linearity was achieved with a SDS:MB of 6:1. Therefore, for this concentration of MB, concentration of 1.2×10⁻⁴ mol L-1
SDS was chosen as the optimum concentration for further studies.
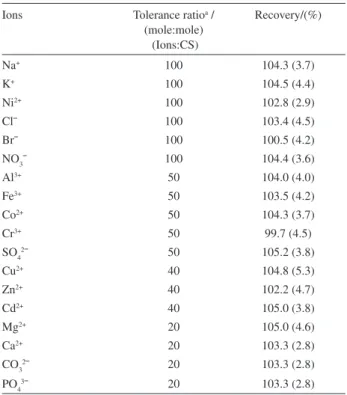
Effect of foreign ions
The selectivity of the system under the optimum conditions was studied by determination of 5 × 10⁻⁵ mol L-1
CPC from 25 mL of binary solutions each containing CPC in the presence of one ion typically co-existing with CPC in many matrixes. To confirm and to show that these ions are not adsorbed on the C18 surface at the established conditions, the eluted solution (waste) was analyzed by flame atomic absorption spectrometer. Percent recoveries of CPC are shown in Table 2. The results show that there is no serious interference for separation of CPC in binary mixtures.
Calibration graphs and sensitivity
A series of CPC, DTAB and CTAB solutions were prepared and the absorbance of each solution was measured at 662 nm in a 1 cm cell. The data were fitted by standard least-squares treatment, and the regression equations were: A = 8.8 × 10³ C
CPC + 0.0654 (r = 0.9960 for n = 7),
A = 8.7 × 10³ C
DTAB + 0.0550 (r = 0.9971 for n = 7), and
A = 8.2 × 10³C
CTAB + 0.0519 (r = 0.9961 for n = 7), respectively,
where A is the absorbance, and C is the concentration of Figure 5. Absorption spectra of 2×10⁻⁵ mol L-1 MB solution in the
cationic surfactants in mol L-1. The reaction to form colored
compound obey Beer’s law over the concentration ranges of 1×10⁻⁵-2×10⁻⁴, 4×10⁻⁵-5×10⁻⁴ and 5×10⁻⁵-5×10⁻⁴ mol L-1
for CPC, DTAB and CTAB, respectively. Theoretical limits of detection27 of CPC, DTAB and CTAB were 8×10⁻⁷,
5×10⁻⁶ and 5×10⁻⁶ mol L-1, respectively. Relative standard
deviations for eight replicate determinations of 1×10⁻⁴ mol L-1
of CPC, DTAB and CTAB were, 3.4, 4.6 and 3.2%, respectively.
Analysis of real samples
To evaluate the analytical applicability of the proposed method, known amounts of standard cationic surfactants were spiked into some water samples in the presence of excess of SDS and the samples were analyzed according to the proposed method. The results obtained, including recovery of cationic surfactants in water samples are summarized in Table 3. Moreover, to show the analytical applicability of the method, the recommended procedure was applied also to the determination of CTAB and CPC Table 2. Effect of diverse ions (in binary mixtures) on percent recovery of CPC
Ions Tolerance ratioa / (mole:mole)
(Ions:CS)
Recovery/(%)
Na+ 100 104.3 (3.7)
K+ 100 104.5 (4.4)
Ni2+ 100 102.8 (2.9)
Cl¯ 100 103.4 (4.5)
Br¯ 100 100.5 (4.2)
NO3¯ 100 104.4 (3.6)
Al3+ 50 104.0 (4.0)
Fe3+ 50 103.5 (4.2)
Co2+ 50 104.3 (3.7)
Cr3+ 50 99.7 (4.5)
SO42¯ 50 105.2 (3.8)
Cu2+ 40 104.8 (5.3)
Zn2+ 40 102.2 (4.7)
Cd2+ 40 105.0 (3.8)
Mg2+ 20 105.0 (4.6)
Ca2+ 20 103.3 (2.8)
CO32¯ 20 103.3 (2.8)
PO43¯ 20 103.3 (2.8)
Experimental conditions: Source: 25 mL of 5×10⁻⁵ mol L-1 of CPC at pH 6.0 with sample flow rate of 1.0 mL min-1; Sorbent: 1.2 g of γ-alumina and 500 mg of C18; Eluent: 12 mL of methanol with an eluent flow rate of 9.0 mL min-1 (numbers in parentheses are relative standard deviations based on three replicate analyses); 2×10⁻⁵ mol L-1 MB and 1.2×10⁻⁴ mol L-1 SDS; aTolerance ratio is the ratio of the interfering ions to cationic surfactant which causes a change of less than 5% in recovery of cationic surfactant.
Table 3. Recovery of CPC, DTAB and CTAB after separation and preconcentration in different water samples#
Sample Amount added/
(mol L-1)
Recovery# (%)
Drinking water 1.0×10⁻⁶ 98.7 (1.3)(a), 100.6 (2.0) (b), 99.2 (1.6) (c)
5.0×10⁻⁶ 102.5 (1.8)(a), 101.9 (2.3) (b), 100.5 (1.5) (c)
1.0×10⁻⁵ 101.6 (2.6)(a), 103.8 (1.9) (b), 101.4 (2.0) (c)
River water 1.0×10⁻⁶ 100.8 (1.7)(a), 98.0 (2.1) (b), 102.3 (3.0) (c)
5.0×10⁻⁶ 101.6 (2.6)(a), 104.7 (2.2) (b), 102.8 (2.8) (c)
1.0×10⁻⁵ 101.5 (2.4)(a), 103.6 (1.8) (b), 103.0 (2.5) (c)
Well water 1.0×10⁻⁶ 101.5 (2.7)(a), 97.8 (3.4) (b), 101.0 (2.4) (c)
5.0×10⁻⁶ 102.3 (2.5)(a), 101.2 (2.5) (b), 101.8 (2.0) (c)
1.0×10⁻⁵ 102.4 (2.2)(a), 101.5 (2.7) (b), 102.0 (2.1) (c)
Experimental conditions: Source: 25 mL of cationic surfactant at pH 6.0 with sample flow rate of 1.0 mL min-1; Sorbent: 1.2 g of γ-alumina and 500 mg of C18; Eluent: 12 mL of methanol with an eluent flow rate of 9.0 mL min-1; 2×10⁻⁵ mol L-1 MB and 1.2×10⁻⁴ mol L-1 SDS; # Each sample was analyzed three times and the results are the averages and numbers in parentheses are relative standard deviation. Recoveries of 0% obtained without spike for each three cationic surfactants in the water samples; a, b and c correspond to CPC, DTAB and CTAB, respectively.
Table 4. Determination of CTAB and CPC in shampoo samplesa
Samples Proposed methodb/ (µg g-1)
Standard methodc/ (µg g-1)
Sample 1 83.25 ± 2.37 81.22 ± 2.64
t = 2.17 F = 2.36
Sample 2 46.08 ± 2.74 44.30 ± 2.32
t = 2.22 F = 3.36
Sample 3 60.86 ± 2.52 62.67 ± 2.28
t = 1.87 F = 2.86
Sample 4 147.0 ± 2.37 151.2 ± 2.35
t = 2.10 F = 3.87
Sample 5 167.5 ± 3.04 172.6 ± 2.92
t = 2.46 F = 3.98
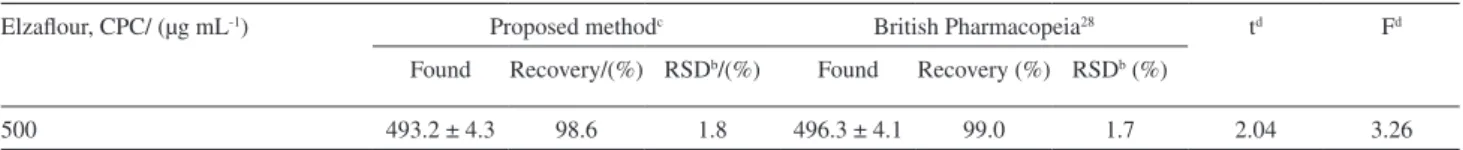
in different shampoo samples and determination of CPC in a mouth wash sample. Results (Tables 4 and 5) were compared with those obtained by the standard methods.13,28
The standard method for analysis of shampoo samples is based on the extraction of the ion pair formed between CS and an anionic dye, Orange II, into chloroform.13 The product
is monitored spectrophotometricaly. Results demonstrated that the method can be employed satisfactorily for the determination of CTAB and CPC in shampoo samples. Statistical analysis of the results reveals that at 95% level of confidence, there is no significant difference between the accuracy and precision of the proposed and standard methods (Table 4). Applying the proposed method for the determination of CPC in mouth wash sample gave good results. Results obtained are shown in Table 5 with average recovery of 98.6% and a relative standard deviation of 1.8% for six replicates. The reliability of the proposed method was statistically examined for the analysis of CPC in mouth wash sample in comparison with British Pharmacopeia method28 as shown in Table 5. Comparison between the
experimental means for the two methods was carried out using the statistical analysis of the results at 95% level of confidence, there is no significant difference between the accuracy and precision of the methods.
Conclusions
The use of γ-alumina as sorbent and C18 cartridge in this work has been demonstrated to be a suitable strategy for the separation/preconcentration of basic solid phase extraction of cationic surfactants. Attractive electrostatic interactions between the anionic surfactant head-groups (e.g., sodium dodecyl sulfate in this work) and the positively charged on the γ-alumina surface played an important role in the retention of cationic surfactants on the sorbent. The proposed method has the advantages of good selectivity and simplicity.
Acknowledgements
The authors would like to express their appreciations to Professor Mohammad Ali Taher and Professor Afsaneh
Safavi for their valuable discussion and useful suggestions. This research was supported by the Payame Noor University of Ardakan.
References
1. Cross, J.; Singer, E. J.; Cationic Surfactants–Analytical and Biological Evaluation, Surfactant Science Series, Marcel Dekker: New York, 1994.
2. Motomizu, S.; Ion Bunseki Kagaku 1999, 48, 151.
3. Schmitt, T. M.; Analysis ofSurfactants, Marcel Dekker: New York, 1992.
4. Li, S.; Zhao, S.; Anal. Chim. Acta2004, 501, 99.
5. Pihlar, B.; Gorenc, B.; Petric, D.; Anal. Chim. Acta 1986, 189, 229.
6. Lucy, C. A.; Tsang, J. S. W.; Talanta2000, 50, 1283. 7. Safavi, A.; Karimi, M. A.; Anal. Chim. Acta2002, 468, 53. 8. Nitschke, L.; Mueller, R.; Metzner, G.; Huber, L.; Fresenius J.
Anal. Chem.1992, 342, 711.
9. Ahel, M.; Giger, W.; Anal. Chem.1985, 57, 2584.
10. Heinig, K.; Vogt, C.; Werner, G.; J. Chromatogr. A1997, 781, 17.
11. Biswas, H. K.; Mandal, B. M.; Anal. Chem.1972, 44, 1636. 12. Sakai, T.; Teshima, N.; Takatori, Y.; Anal. Sci.2003, 19,
1323.
13. Scott, G. V.; Anal. Chem.1968, 40, 768.
14. Boyd-Boland, A. A.; Pawliszyn, J. B.; Anal. Chem.1996, 68, 1521.
15. Fendinger, N. J.; Begley, W. M.; McAvoy, D. C.; Eckhoff, W. S.; Environ. Sci. Technol. 1995, 29, 856.
16. Crescenzi, C.; Di Corcia, A.; Marcomini, A.; Samperi, R.; Anal. Chem.1995, 67, 1797.
17. León-González, M. E.; Pérez-Arribas, L. V.; J. Chromatogr. A 2000, 902, 3.
18. Saitoh, T.; Nakayama, Y.; Hiraide, M.; J. Chromatogr. A 2005,
1069, 271.
19. Cantero, M.; Rubio, S.; P´erez-Bendito, D.; J. Chromatogr. A 2005, 1067, 161.
20. Moral, A.; Sicilia, M. D.; Rubio,S.; Pérez-Bendito, D.;
J. Chromatogr. A2005, 1100, 8.
21. López-Jiménez, F. J.; Rubio, S.; Pérez-Bendito, D.; Anal. Chim. Acta2005, 551, 142.
Table 5. Determination of CPC in Elzaflour mouth wash samplea
Elzaflour, CPC/ (µg mL-1) Proposed methodc British Pharmacopeia28 td Fd
Found Recovery/(%) RSDb/(%) Found Recovery (%) RSDb (%)
500 493.2 ± 4.3 98.6 1.8 496.3 ± 4.1 99.0 1.7 2.04 3.26
22. Merino, F.; Rubio, S.; Pérez-Bendito, D.; Anal. Chem.2004,
76, 3878.
23. Manzoori, J. L.; Sorouraddin, M. H.; Shabani, A. M. H.; J. Anal. At. Spectrom. 1998, 13, 305.
24. Absalan, G.; Aghaei Goudi, A.; Sep. Purif. Technol.2004, 38, 209.
25. McMartin, K. E.; Ambre, J. J.; Tephly, T. R.; Am. J. Med.1980,
68, 414.
26. Burns, M. J.; Graudins, A.; Aaron, C. K.; McMartin, K.; Brent, J.; Ann. Emerg. Med. 1997, 30, 829.
27. Miller, J. N.; Miller, J. C.; Statistics and Chemometrics for Analytical Chemistry, Pearson Education: England, 2000. 28. British Pharmacopeia, HM Stationary Office: London, 1993,
p. 127.
Received: December 12, 2007