Article
J. Braz. Chem. Soc., Vol. 22, No. 10, 1913-1920, 2011. Printed in Brazil - ©2011 Sociedade Brasileira de Química
0103 - 5053 $6.00+0.00
A
*e-mail: [email protected]
Intralaboratory Validation, Comparison and Application of HPLC-UV-DAD
Methods for Simultaneous Determination of Benzalkonium Chloride, Chlorexidine
Digluconate and Triclosan
Simone C. Chiapetta,a,b Érika C. B. de Oliveira,a,b Beta C. Olivier,a,b Luiza A. Mercante,a,b
Danielle M. Henriquesa,c and Annibal D. Pereira Netto*,b
aLaboratório de Análise Orgânica Instrumental, Instituto Nacional de Tecnologia, Av. Venezuela, 82,
Centro, 20081-312 Rio de Janeiro-RJ, Brazil
bInstituto de Química, Universidade Federal Fluminense, Outeiro de São João Batista, s/n, Centro,
24020-141 Niterói-RJ, Brazil
cDepartamento de Química, Instituto de Ciências Exatas, Universidade Federal Rural do
Rio de Janeiro, Pavilhão Roberto Alvahydo, Rodovia BR 465, km 7, 23890-000 Seropédica-RJ, Brazil
Cloreto de benzalcônio (BAC), digluconato de clorexidina (CD) e triclosan (TR) são amplamente usados como agentes antimicrobianos já que são anti-sépticos e desinfetantes, dependendo da concentração. O objetivo deste trabalho foi o desenvolvimento de metodologia para a determinação rápida e simultânea de CD, TR e dos homólogos do BAC (C12, C14 e C16) por CLAE-UV-DAD. Dois sistemas isocráticos em fase reversa foram otimizados: sistema C8 - coluna SB-C8 (250 × 4,6 mm; 5 µm) e fase móvel composta por ACN e tampão de H3PO4/NaH2PO4 0,03 mol L-1, pH 2,0 (80:20, v/v); 2,0 mL min-1 e sistema CN - coluna SB-CN (150 × 4,6 mm; 5 µm) e fase móvel composta por ACN e tampão de HOAc/NaOAc 0,1 mol L-1, pH 5,0 (70:30, v/v); 2,5 mL min-1. O tempo de análise foi menor que 6 min em ambos os sistemas, permitindo alta produtividade e baixo uso de solventes. Faixas lineares com duas ordens de magnitude foram obtidas nos dois sistemas. A sensibilidade obtida no sistema C8, para as cinco substâncias foi cerca de 20% maior que no sistema CN. Ambos os métodos apresentaram precisões melhores que 4,5%, boas resoluções (R > 1,8) e altas recuperações (96 a 103%). Os limites de quantiicação foram adequados para a determinação das cinco substâncias em produtos comerciais. A análise de diversos produtos comerciais indicou boa concordância entre os métodos cromatográicos e entre ele e os valores rotulados.
Benzalkonium chloride (BAC), chlorhexidine digluconate (CD) and triclosan (TR) are widely used antimicrobial agents since they are antiseptics and disinfectants depending on the used concentration. The objective of this work was the development of methodology for the fast and simultaneous determination of CD, TR and the BAC homologues (C12, C14 and C16) using HPLC-UV-DAD. Two isocratic reverse-phase systems were optimized: system C8 - column SB-C8 (250 × 4.6 mm; 5 µm) using a mobile phase composed of ACN and H3PO4/NaH2PO4 buffer 0.03 mol L-1, pH 2.0 (80:20, v/v); 2.0 mL min-1 and system CN - column SB-CN (150 × 4.6 mm; 5 µm) using a mobile phase composed of ACN and HOAc/NaOAc buffer 0.1 mol L-1, pH 5.0 (70:30, v/v); 2.0 mL min-1. In both systems the total analysis time was lower than 6 min, leading to high throughput and low production of solvent rejects. Linear ranges with two magnitude orders were found for the ive substances in both systems. The sensitivity of system C8 for the ive substances was around 20% greater than that of system CN. Both chromatographic methods showed overall precisions better than 4.5%, good resolutions (R > 1.8) and high recoveries (96 to 103%). The limits of quantiication were adequate for the determination of the ive compounds in commercial products. The analysis of several commercial products showed a good agreement between both chromatographic methods. Good agreement among measured concentrations and labeled values was also observed.
Keywords: benzalkonium chloride, chlorexidine digluconate, triclosan, method validation,
Introduction
Antimicrobial agents (AAs) can be classiied in several
ways. They are classiied as disinfectantswhen they are
capable of irreversibly destroying or inactivating the action of microorganisms in inanimate surfaces or objects and classiied as antiseptics when they are capable of preventing or inhibiting the action or growth of microorganisms, not necessarily by killing them, after application in living tissues.1 The activity of AAs is also dependent on the used
concentrations. Therefore, high concentrations are required to a disinfectant action while low concentrations lead to an antiseptic one.
Benzalkonium chloride (BAC), chlorhexidine digluconate (CD) and triclosan (TR) (Figure 1) are widely used AAs since they can behave as antiseptics or disinfectants. They have been widely used in domestic, industrial and hospital areas and in personal care products of different physical characteristics such as sprays, liquids and powders. These compounds have also two important characteristics: they show antimicrobial properties even in low concentrations and they are relatively innocuous to human beings. This way, they show a wide range of applications ranging from pharmaceutical products to crop disinfection even in mixtures or individually.
AAs may possess different functional groups (Figure 1). Thus, BAC, a quaternary ammonium salt, is one of the most worldwide used antimicrobial agents. CD, a biguanidine is considered a irst choice and a standard antibacterial.2,3
TR, a phenolic compound, is highly eficient in reducing the development of microorganisms in hospitals.4 TR has
also shown to be eficient to combat methicillin resistant Staphylococcus aureus (MRSA).5
Mixtures of CD, TR and of BAC homologues are used in personal care products with a primary function of preserving and extending their useful lives. As a consequence, the maximum concentrations of these compounds are regulated according to the product use.
For example, maximum concentrations of 0.3% of CD and TR and of 0.1% of total BAC homologues are allowed in personal hygiene products in Brazil.6
The above discussed points show the need and interest in fast, selective and robust methods for the determination and control of these compounds in pharmaceutical formulations, since these compounds are widely used and have a proven eficiency.
Several analytical techniques have been used to identify and determine BAC homologues, CD and TR. Capillary electrophoresis,7,8 voltametry,9,10 gas
chromatography with lame ionization detection11 or mass
spectrometry detection12 and high performance liquid
chromatography with UV detection (HPLC-UV)13-15 have
been used to evaluate these compounds in pharmaceutical products.
HPLC-UV-DAD was chosen for the development of this study due to its analytical versatility and since it enables the separation, identiication and quantiication of these AAs in commercial formulations of different characteristics and compositions, with adequate sensitivity and speciicity. Here we describe the results of optimization, partial validation and application of two independent HPLC-UV-DAD methods for simultaneous determination of these compounds in common pharmaceutical products.
Experimental
Chemicals and reagents
Solid standards of the studied compounds were purchased as follows: triclosan (TR) (Aldrich Chemical Co., WI, USA), benzyldodecyldimethylammonium bromide
(BAC-C12), benzyltetradecyldimethylammonium chloride
(BAC-C14) and benzylhexadecyldimethylammonium
(BAC-C16) chloride (Sigma, MO, USA). An aqueous
solution containing 20% of chlorhexidine digluconate (CD) (Sigma, MO, USA) was also employed in the study.
Acetronitrile (HPLC grade) was purchased from TediaBrazil (RJ, Brazil). All other reagents (acetic acid, monobasic sodium phosphate, phosphoric acid, sodium acetate) were of analytical grade and were purchased from Merck (RJ, Brazil).
Ultra-pure water was prepared in a millipore simplicity system (MA, USA), following distillation.
Samples
Samples consisted of commercial products (liquid and spray deodorants, ophthalmologic and nasal solutions, general use and oral use antiseptic solutions) usually sold in the local market. They were acquired in drugstores of Rio de Janeiro and Niterói cities, Brazil.
Sample preparation procedures
Samples were previously homogenized in their own packing’s before sampling. Aliquots of the samples were precisely diluted with ultra-pure water, in order to allow determination of the studied compounds in their linear ranges and iltered through 0.45 µm ilters before chromatographic analysis.
Chromatographic analysis
The HPLC system consisted of a quaternary pump, a degasser, an automated injector, a column oven and an UV-DAD detector (all Agilent 1100 Series, USA). An Agilent ChemStation was used for the control of the chromatographic system and data acquisition and treatment.
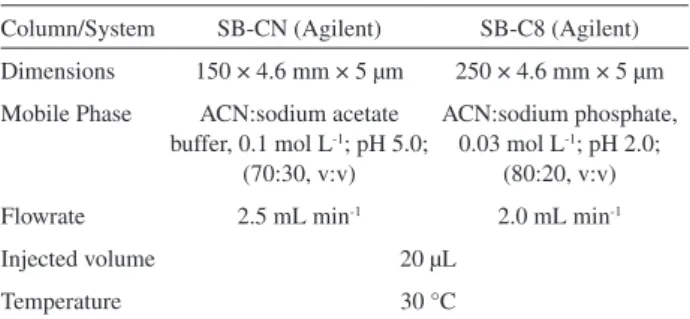
Chromatographic conditions (mobile phase composition and flow-rate) were evaluated and optimized in two different reverse phase columns and solvent systems. Selected chromatographic parameters (peak symmetry, retention time, resolution, peak width and total analysis time) were considered during the optimization. All parameters were calculated by the ChemStation except peak resolution that was calculated considering each pair of peaks of the chromatogram. In order to keep the overall time of analysis as low as possible, isocratic conditions were always employed. Table 1 summarizes the optimized chromatographic conditions.
Compound identiication and quantiication
Compounds were identified by comparison with retention times of true compounds and by their absorption spectra. Quantitative analysis was performed in the maxima absorption wavelengths of the studied compounds that
were previously and off-line evaluated with 100 mg L-1
solutions in a FEMTO 800 XI spectrophotometer (SP, Brazil). Spectra in different pHs (2.0, 5.0 and 10.0) were previously evaluated due to the acid-base characteristics of the studied AAs.
Quantiication of the studied compounds was performed by external standard calibration. Nine level analytical curves (1.00, 5.00, 10.00, 30.0, 60.0, 125, 250, 500 and 1000 mg L-1) were evaluated and each point represents
the mean of 3 injections.17 The limits of detection (LOD)
and limits of quantiication (LOQ) were determined by considering respectively 3 and 10 times the signal to noise ratios estimated by the regression lines. Signal to noise ratios were estimated by the standard deviations of peak areas obtained after 10 subsequent injections of the 10.0 µg L-1 standard.16,17
Partial validation of the analytical methods
Method validation followed the recommendations of the Brazilian Institute of Metrology.17 The following
parameters were studied and evaluated in the optimized chromatographic conditions: selectivity, linearity and linear range, sensitivity, limits of detection (LOD) and limits of quantiication (LOQ), recovery and precision. The selectivity of the method was tested by injecting a standard solution containing 10, 20 and 60% of TR, CD and BAC homologues in commercial products. In order to verify the linearity and the linear range of the calibration lines, a minimum of nine concentration levels distributed along the calibration range23 and equivalent to 1.0, 5.0, 10.0,
30.0, 60.0, 125.0, 250.0, 500.0 and 1000 mg L-1 of CD,
TR and BAC homologues were prepared and injected in independent triplicates. The sensitivities of each compound in both chromatographic systems were evaluated by the angular coeficients of the analytical curves. The recovery of the methods was determined by spikingof know amounts of TR, CD and BAC homologues reference standards added to the commercial products. The precision of the assay was determined by repeatability (intra-day) and intermediate
Table 1. Summary of the optimized chromatographic conditions
Column/System SB-CN (Agilent) SB-C8 (Agilent)
Dimensions 150 × 4.6 mm × 5 µm 250 × 4.6 mm × 5 µm Mobile Phase ACN:sodium acetate
buffer, 0.1 mol L-1; pH 5.0;
(70:30, v:v)
ACN:sodium phosphate, 0.03 mol L-1; pH 2.0;
(80:20, v:v)
Flowrate 2.5 mL min-1 2.0 mL min-1
Injected volume 20 µL
precision (inter-day). Repeatability was evaluated using the data obtained after the injections of the 10.0 µg L-1
standard during the evaluation of LOD and LOQ. The intermediate precision was studied by comparing the areas in different days using three selected concentrations of standard solutions (10.0, 30.0 and 125.0 mg L-1).
Data treatment
Final treatment of data and statistical analysis (Student t-test, F-test, Cochran test and lack-of-fit test) were performed by datasheets prepared in Microsoft Excel®.
Results and Discussion
Absorption spectra
The absorption spectra of the studied compounds were obtained between 240-300 nm. The spectra of BAC homologues showed an absorption maximum at 264 nm that remained constant in different pHs. A similar behavior was observed with CD that showed an absorption maximum at 260 nm. TR showed a different behavior. In lower pHs the absorption maximum was observed at 280 nm while in pH 10.0, this maximum was shifted to 298 nm. Absorption maxima wavelengths were employed in quantitative analysis. All compounds showed good absorption in 264 nm that was used to simultaneous evaluation of chromatographic separations in some steps of the work.
Method validation
The chromatographic conditions shown in Table 1 were employed for method validation and sample analysis. Method validation covered all necessary steps to ensure for correct identiication and appropriate quantiication of the studied compounds.
Selectivity
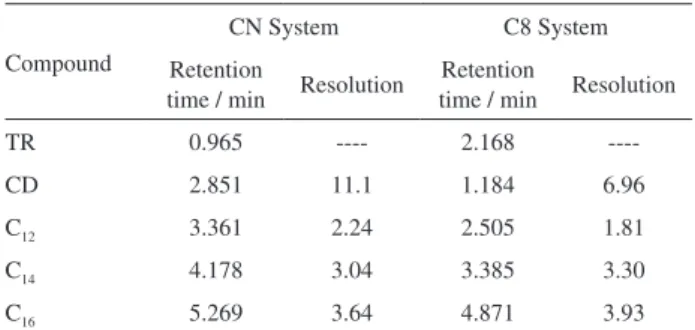
The selectivity of an analytical method is important to the correct identiication of target analytes in real samples. In this work all compounds were identiied by comparison of their retention times with that of true standards. The retention times of the studied compounds together with their resolutions in the optimized chromatographic conditions are shown in Table 2.
Very low variations (< 0.1%) of retention times were observed. Good resolutions (≥ 1.8) and symmetries (≥ 0.59) of the chromatographic peaks were also obtained
in all cases showing the good selectivity of the developed methods. Both chromatographic systems allowed baseline separation of all analytes within 6 min indicating a good method throughput (ca. 10 analyses per hour). It is interesting to observe that TR and CD show inverse elution orders in both chromatographic systems possibly due to the polarity of the stationary phase.
Moreover the identity of the studied compounds was always conirmed by the peak purity tool available in the ChemStation that besides the correct identiication of analytes also allowed evaluation of matrix interferences in more complex matrices.
The addition of standard solutions containing 10, 20 and 60% of TR, CD and BAC homologues in commercial products showed also that there were no interferences among the studied compounds when present in the same product.
Linearity and linear working ranges
Standard solutions containing all compounds in concentrations between 1.00 and 1000 mg L-1 were
analyzed in triplicates. Mean areas were used to draw the analytical curves by the least squares method. Cochran test was applied to evaluation of variance homoscedasticity and it was shown that all analytical lines were homocedastic.
The subsequent step of the work was the evaluation of linear ranges. Although the correlation coeficient (R) is generally used and accepted as a measure of the adequacy
of the linear model by many agencies such as ANVISA,18
the more powerful and robust lack-of-it test (LOF)19,20 was
used to the evaluate linear ranges of the analytical lines. The estimated linear ranges of the analytical curves after the application of LOF test are shown in Table 3. Linear ranges of at least 2 orders of magnitude were obtained allowing the determination of the studied compounds in the evaluated products that when necessary were diluted (1 to 10 or 1 to 25) leading to areas of the studied compounds in the linear ranges of the analytical curves.
Table 2. Selected chromatographic parameters obtained under the optimized conditions
Compound
CN System C8 System
Retention
time / min Resolution
Retention
time / min Resolution
TR 0.965 ---- 2.168
----CD 2.851 11.1 1.184 6.96
C12 3.361 2.24 2.505 1.81
C14 4.178 3.04 3.385 3.30
Estimative of limits of detection and limits of quantiication
Estimated values of LODs and LOQs are shown in Table 4. CD and TR showed values 5 to 10 times below of those of BAC homologues certainly due to the presence of two aromatic rings and of their arrangements when compared to those of BAC homologues (Figure 1) that showed similar LODs and LOQs.
Both LODs and LOQs are of limited importance in the evaluation of method performance because relatively high concentrations of the studied compounds are expected in the commercial products evaluated. Indeed, these values may be useful for comparison with other methods or even to a previous evaluation of method applicability to more diluted samples such as environmental ones after a concentration step.
Sensitivity
The sensitivities of TR and CD (Table 5) were larger than those of BAC homologues in both systems possibly due to the number and spatial arrangement of aromatic rings in the molecules (Figure 1). Similar sensitivities of BAC homologues were observed since they are much related compounds that possess only one aromatic ring. This fact shows the possibility of quantiication of BAC homologues
by area normalization as previously shown.8
As shown in Table 5, the sensitivities of all substances in the CN system were ca. 20% lower than those observed in the C8 system (Table 5). This difference may be attributed to the difference of mobile phase low rates and consequently to sample dilution since identical absorption spectra of the studied compounds were found in both sets of conditions.
Method precision
The precision of the method was evaluated in different experiments. Thus, method repeatability was evaluated with the coeficients of variation (%) (CVs) obtained during the evaluation of LODs and LOQs that is, using data obtained with the 10 mg L-1 solutions (Table 6). The
CVs varied from 0.22 to 3.80% that are satisfactory for quantitative analysis according to the criteria suggested by the Brazilian INMETRO, which are based on the Horwitz equation.17 BAC homologues showed the largest values
among the studied compounds certainly due to the fact that the evaluated concentrations were closer to their LOQs than those of TR and CD.
Between run precision was evaluated by comparison of 3 standards (10.0, 30.0 and 125 mg L-1) that were analyzed
in triplicates in different days (Table 7). The variances of the areas of each compound in both systems and in both days were compared by F-test. Fcalculated were always lower
than Fcritical (F2,2,95% = 19.0) showing that the variances and hence inter-day precisions were not signiicantly different. Table 7 also allows a comparison of the variances of each standard in both systems and no signiicant differences
were observed (F-values not shown).
Recovery evaluation
Recoveries were evaluated by analyzing spiked samples of commercial products of different matrix characteristics
Table 3. Linear ranges of the studied compounds in both chromatographic systems
System CD / (mg L-1) TR / (mg L-1) BAC C
12 / (mg L-1) BAC C14 / (mg L-1) BAC C16 / (mg L-1)
CN 5.00-250 5.00-125 10.0-500 10.0-1000 10.0-500
C8 5.00-125 10.0-250 5.00-500 5.00-1000 5.00-1000
Table 4. Estimated limits of detection (LOD) and limits of quantiication (LOQ) (mg L-1) of the studied compounds in both chromatographic
systems
System Parameters CD TR BAC C12 BAC C14 BAC C16
CN LOD 0.21 0.14 1.11 0.94 1.10
LOQ 0.70 0.48 3.70 3.13 3.65
C8 LOD 0.07 0.06 0.93 0.74 1.19
LOQ 0.22 0.21 3.11 2.46 3.97
Table 5. Sensitivity of both chromatographic systems for the studied compounds
System CD TR BAC C12 BAC C14 BAC C16
CN 31.613 7.392 0.364 0.374 0.345
C8 37.344 9.260 0.461 0.471 0.433
Table 6. Repeatability of the studied compounds in both chromatographic systems evaluated by the coeficients of variation (CV%) (n = 10) after injection of the 10.0 mg L-1 standard
System TR CD BAC C12 BAC C14 BAC C16
CN 0.66 0.59 3.57 2.80 3.28
Table 7. Inter-day comparison of standard deviations (n = 3) obtained at 3 different calibration levels (10.0, 30.0 and 125 mg L-1)
Compounds Concentrations / (mg L-1)
System CN System C8
Day 1 Day 2 Fcalc Day 1 Day 2 Fcalc
CD 10.0 30.0 125 0.48 1.12 0.77 0.14 0.97 0.45 11.8 1.33 2.93 1.79 0.51 1.15 0.54 0.18 1.05 11.0 8.03 1.20 TR 10.0 30.0 125 0.16 0.39 0.39 0.27 0.74 1.32 2.85 3.60 11.5 0.55 0.11 0.1 0.24 0.23 0.36 5.25 4.37 13.0
BAC C12 10.0
30.0 125 0.20 0.15 0.38 0.08 0.13 0.30 6.25 1.33 1.60 0.07 0.05 0.65 0.03 0.06 0.58 5.44 1.44 1.26
BAC C14 10.0
30.0 125 0.08 0.19 0.10 0.23 0.01 0.63 8.26 7.36 16.8 0.45 0.51 0.05 0.22 0.19 0.21 4.18 7.20 17.6
BAC C16 10.0
30.0 125 0.08 0.14 1.06 0.17 0.11 0.44 4.51 1.62 5.80 0.12 0.23 0.86 0.03 0.18 0.56 16.0 1.63 2.36
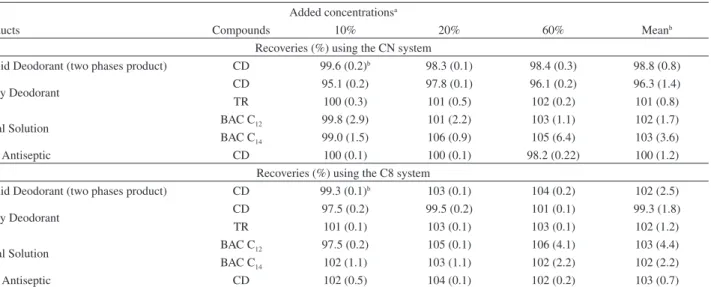
Table 8. Mean recoveries (%) and coeficients of variation (%) (n = 3) of the studied compounds in samples of different characteristics
Added concentrationsa
Products Compounds 10% 20% 60% Meanb
Recoveries (%) using the CN system
Liquid Deodorant (two phases product) CD 99.6 (0.2)b 98.3 (0.1) 98.4 (0.3) 98.8 (0.8)
Spray Deodorant CD 95.1 (0.2) 97.8 (0.1) 96.1 (0.2) 96.3 (1.4)
TR 100 (0.3) 101 (0.5) 102 (0.2) 101 (0.8)
Nasal Solution BAC C12 99.8 (2.9) 101 (2.2) 103 (1.1) 102 (1.7)
BAC C14 99.0 (1.5) 106 (0.9) 105 (6.4) 103 (3.6)
Oral Antiseptic CD 100 (0.1) 100 (0.1) 98.2 (0.22) 100 (1.2)
Recoveries (%) using the C8 system
Liquid Deodorant (two phases product) CD 99.3 (0.1)b 103 (0.1) 104 (0.2) 102 (2.5)
Spray Deodorant CD 97.5 (0.2) 99.5 (0.2) 101 (0.1) 99.3 (1.8)
TR 101 (0.1) 103 (0.1) 103 (0.1) 102 (1.2)
Nasal Solution BAC C12 97.5 (0.2) 105 (0.1) 106 (4.1) 103 (4.4)
BAC C14 102 (1.1) 103 (1.1) 102 (2.2) 102 (2.2)
Oral Antiseptic CD 102 (0.5) 104 (0.1) 102 (0.2) 103 (0.7)
aAdded levels correspond to percentage of labeled compound in each product. bValues between parenthesis correspond to the coeficients of variation (%); n = 3. known to contain the studied compounds. Three different
levels corresponding to 10, 20 and 60% of the labeled concentrations of commercial products were evaluated (Table 8). Very good recoveries between 96.3 and 103% (CN system) and between 99.3 and 103 (C8 system) were obtained for all compounds. These values are within the ranges accepted by the Codex Alimentarius for the expected concentrations of the studied compounds.22
Application of chromatographic methods
Analysis of real samples
Samples of different physical characteristics and compositions were evaluated in both chromatographic systems. When necessary, samples were diluted in order to
it their concentrations in the linear ranges of the analytical curves. Table 9 shows the results obtained by application of both methods to some of the studied samples.
These results also showed good agreements with the labeled values of the product since the Brazilian legislation allows a difference of up to ± 10% between true and labeled concentrations of the studied compounds in personal care products.21
Complementarities of methods
The evaluation of certain samples showed an unexpected facet of the chromatographic methods, i.e., their complementarities, since some samples can be quantiied in one of them even if a huge interference is observed in the other.
Figure 2a shows a chromatogram of a sample of a spray deodorant in the System CN. A clear coelution of an unidentiied interfering compound (rt = 4.2 min) with BAC-C14 homologue (rt = 4.178 min – Table 2) can be observed. This fact hindered the determination of this homologue in this chromatographic system. However, the sample analysis in system C8 allowed a complete separation of BAC homologue series (C12, C14 and C16)
(Figure 2b) without interference. Moreover Figure 2b showed a small peak that was presumably identiied as the BAC-C18 homologue by its UV spectrum. If necessary this
homologue would be also quantiied by area normalization8
since BAC-homologues show similar response factors (Table 5).
Another studied product (a solid antiseptic soap) showed a coelution of a matrix constituent with TR consequently hindering the determination of this compound in the system CN (Figure 3a). This interference was conirmed by purity
peak tool of the ChemStation but it was not observed in the system C8 (Figure 3b), allowing the quantiication of this compound under these conditions.
Conclusions
Our results show that both chromatographic systems allowed a good separation with good resolution of the studied compounds under isocratic conditions in less than 6 min. As a consequence good analytical throughput and relatively low reject production were also obtained.
Good linearity’s of at least 2 orders of magnitude with very good correlations were obtained. They allow the evaluation of the studied compounds in commercial products of different characteristics without or after low dilution. Coeficients of variation lower than 5% were found in all cases showing the good precision of the method.
Table 9. Concentrations (mg L-1) (mean ± standard deviation; n = 3) of
the studied compounds in commercial products and comparison with the labeled values
Samples Compounds System CN System C8concentrationLabeled
Liquid Deodorant (two phases product)
CD 1803 ± 2 1803 ± 2 2000
Spray Deodorant CD 2186 ± 8 2191 ± 3 2000
TR 2130 ± 2 2136 ± 3 2000
Nasal Solution BAC C12 76.8 ± 0.4 77.2 ± 0.2 ---a
BAC C14 33.2 ± 0.5 33.2 ± 0.6 ---a
Sum 110 110 100
Oral Antiseptic CD 2217± 2 2217± 2 2000
Ofthalmic Solution BAC C12 76.3 ± 0.7 75.2 ± 1.1 ---a
BAC C14 33.2 ± 0.3 33.9 ± 0.7 ---a
Sum 110 109 100
General Use Antiseptic
CD 11240 ± 30 11220 ± 10 10000
aindividual concentration of homologue not speciied.
Figure 2. Chromatograms of a sample of spray deodorant with detection at 264 nm, showing the detection of benzalconium chloride (BAC) homologues. (a) System CN; (b) System C8.
The very good recoveries (96 to 103%) indicated also the excellent recovery of the developed methods.
Our results showed that both chromatographic systems led to comparable results in samples of different matrix characteristics and compositions showing that both may represent alternative tools for the evaluation of commercial products.
Although matrix interferences may hinder the determination of some compounds under a set of conditions or chromatographic system they are possible in the other set of conditions showing that the chromatographic methods are complementary. This fact can be also of interest in quality control and quality assurance. In that way the purity peak tool proved to be a valuable tool for interference veriication.
Acknowledgments
The authors are thankful to DQAN/INT, PROPP/UFF and CNPq for grants, fellowships and partial inancial support of this study. A. D. P. N. thanks CNPq for an individual grant.
References
1. Eckroth, D.; Kirk-Othmer Encyclopedia of Chemical Technology, 3rd ed.; John Wiley & Sons: USA, 1978.
2. WHO - World Health Organization; Comparative Table of Medicines on the WHO Essential Medicines List from
1977-2005; 2005. http://whqlibdoc.who.int/hq/2005/a87017_eng. pdf accessed in July, 2011.
3. WHO – World Health Organization; WHO Model List of Essential Medicines. 17th Edition, 2011. http://whqlibdoc.who.
int/hq/2011/a95053_eng.pdf accessed in July, 2011. 4. Campbell, L.; Zirwas, M. J.; Dermatitis2006,17, 204. 5. Suller, M. T. E.; Russell, A. D.; J. Antimicrob. Chemother. 2000,
46, 11.
6. ANVISA - National Health Surveillance Agency; Resolução No. 79; Brasil, 2000. http://www.anvisa.gov.br/cosmeticos/ guia/html/79_2000.pdf accessed in July, 2011.
7. Hou, Y.; Wu, C.; Ding, W.; J. Chromatogr., A2002,976, 207. 8. Prince, S. J.; McLaury, H.; Allen, L.V.; McLaury, P.; J. Pharm.
Biomed. Anal. 1999,19, 877.
9. Wang, L.; Chu, S.; Chromatographia2004,60, 385. 10. Wang, L.; Tsai, S.; Anal. Chim. Acta2001,441, 107. 11. USP 26 NF 2003 - U.S. Pharmacopeia National Formulary
2003 (The Oficial Compendia of Standards);United States Pharmacopeial Convention: Rockville, USA, 2002.
12. Agüera, A.; Fernández-Alba, A. R.; Piedra, L.; Mézcua, M.; Gómez, M. J.; Anal. Chim. Acta2003, 480, 193.
13. Ganzera, M.; Aberham, A.; Stuppner, H.; J. Agric. Food Chem. 2006,54, 3768.
14. De Kruijf, N.; Schouten, A.; Rijk, M. A. H.; Pranoto-Soetardhi, L. A.; J. Chromatogr., A1989,469, 317.
15. Dudkiewicz-Wilczynska, J.; Tautt, J.; Roman, I.; J. Pharmaceut. Biomed. Anal.2004,34, 909.
16. Ramos, G. R.; Álvarez-Coque, M. C. G.; Quimiometria; Sintesis: Spain, 2001.
17. INMETRO - National Institute of Metrology, Standardization and Industrial Quality; Orientação sobre Validação de Métodos de Ensaios Químicos,DOQ-CGCRE-008; Brasil, 2010. http:// www.inmetro.gov.br/Sidoq/Arquivos/CGCRE/DOQ/DOQ-CGCRE-8_03.pdf accessed in July, 2011.
18. ANVISA - National Health Surveillance Agency; Guia para Validação de Métodos Analíticos e Bioanalíticos, Resolução
No. 899; Brasil, 2003. http://www.anvisa.gov.br/medicamentos/ RE_899_validacao.pdf accessed in July, 2011.
19. Einax, J. W.; Zwanziger, H. W.; Geiβ, S.; Chemometrics in Environmental Analysis; VCH: Germany, 1997.
20. Massart, D. L.; Vandeginste, B. G. M.; Buydens, L. M. C.; De Jong, S.; Lewi, P. J.; Smeyers-Verbeke, J.; Handbook of Chemometrics and QualimetricsPart A; Elsevier: Neetherlands, 1997.
21. Farmacopéia Brasileira, 5a. ed., Part 1; Brasil, 2010. 22. Codex Alimentarius Comission; Procedural Manual, 19th
ed.; 2010. Available at ftp://ftp.fao.org/codex/Publications/ ProcManuals/Manual_19e.pdf accessed in July, 2011. 23. Souza, S. V.C.; Junqueira, R. G.; Anal. Chim. Acta2005, 552, 25.
Submitted: November 19, 2010